 Open Access Article
Creative Commons Attribution 3.0 Unported Licence
Glucose monitoring in living cells with single fluorescent protein-based sensors†
Hanyang Huac,
Yufeng Weiac,
Daocheng Wangac,
Ni Suac,
Xianjun Chenac,
Yuzheng Zhaoac,
Guixia Liu *c and
Yi Yang
 *ab
*ab
aSynthetic Biology and Biotechnology Laboratory, State Key Laboratory of Bioreactor Engineering, Shanghai Collaborative Innovation Center for Biomanufacturing Technology, East China University of Science and Technology, 130 Mei Long Road, Shanghai 200237, China
bOptogenetics & Synthetic Biology Interdisciplinary Research Center, CAS Center for Excellence in Brain Science, Shanghai Institutes for Biological Sciences, Chinese Academy of Sciences, Shanghai 200031, China. E-mail: yiyang@ecust.edu.cn
cShanghai Key Laboratory of New Drug Design, School of Pharmacy, East China University of Science and Technology, 130 Mei Long Road, Shanghai 200237, China. E-mail: gxliu@ecust.edu.cn
First published on 10th January 2018
Abstract
Glucose is the main source of energy and carbon in organisms and plays a central role in metabolism and cellular homeostasis. However, the sensitive fluctuation of glucose in living cells is difficult to monitor. Thus, we developed a series of ratiometric, highly responsive, single fluorescent protein-based glucose sensors of wide dynamic range by combining a circularly permuted yellow fluorescent protein with a bacterial periplasmic glucose/galactose-binding protein. We used these sensors to monitor glucose transport in living Escherichia coli cells, and found that the cells take up glucose within 10 min to maintain physiological glucose levels, and observed the differences in glucose uptake and glucose metabolism between wild-type and Mlc knockout cells. These sensors can be specific and simple tools for glucose detection in vitro and non-invasive tools for real-time monitoring of glucose metabolism in vivo.
1. Introduction
Glucose is the main source of energy and carbon in most organisms, from bacteria to humans. Changes in glucose uptake, release, and metabolism are associated with regulation of various physiological and pathological phenomena, such as cell growth, cell proliferation, cell differentiation, cell death, insulin secretion, obesity, and diabetes.1–3 Therefore, sensitive and selective measurement of glucose has become significant. Radiolabeling, chromatography, and mass spectrometry have been used effectively to quantify glucose.4 However, these methods have limited spatiotemporal resolution and are unsuitable for real-time imaging of glucose metabolism in living cells.To monitor glucose in situ, fluorescence resonance energy transfer (FRET)-based glucose biosensors with different affinity have been developed and proven to be useful for imaging glucose flux in living cells.5–10 These sensors are based on enhanced cyan fluorescent protein/enhanced yellow fluorescent protein FRET pair and glucose/galactose-binding protein (GGBP) of Escherichia coli. GGBP is a bacterial periplasmic-binding protein that exhibits a hinge-twist conformational change upon glucose binding.11–13 Unfortunately, the fluorescence changes of these FRET sensors are small, which fall into 10–70%,5–10 and this limits their applications in high-throughput screen and monitoring subtle metabolic changes.
Recently, we have reported a series of metabolite sensors, including NADH (Frex),14 NAD+/NADH ratio (SoNar),15,16 NADPH (iNap)17 and histidine (FHisJ)18 based on circularly permuted yellow fluorescent protein (cpYFP). In cpYFP, the original N- and C-termini are fused by a polypeptide linker, and new termini are introduced close to the fluorophore, making its fluorescence highly sensitive to the protein's conformation.14–18 Compared with FRET-based sensors, cpYFP-based sensors often have larger fluorescence changes; in specific, Frex,14 SoNar,15,16 iNap17 and FHisJ18 sensors have more than 500% dynamic range, rendering them capable of tracking subtle metabolic changes.
To maximize the existing technical advantages, we inserted cpYFP into three linker locations of GGBP and developed a series of ratiometric, highly responsive, single fluorescent protein-based glucose sensors, denoted as FGBP (fluorescent GGBP). Among them, FGBP1 mM sensor with a binding constant (Kd) of 1.0 mM exhibited sevenfold fluorescence ratio changes and fit physiological applications.
2. Experimental
2.1 Plasmid construction and strains
To generate single fluorescent protein-based glucose indicators, the MglB DNA sequence coding for the mature GGBP (positions 70–927 relative to ATG) was amplified from E. coli genomic DNA by PCR with the primers P1 and P2 (sequences available in Table S1†) and cloned into BamHI-HindIII sites in the pRSETb vector (Invitrogen). The GGBP–cpYFP insertion variants were constructed by overlap PCR19 using wild-type GGBP sequence and cpYFP from Frex.14 First, the coding sequences of N and C terminal domain of GGBP, and cpYFP were amplified using the primers P1 and PR, PF and P2, and P3 and P4, respectively (sequences available in Table S1†). Second, the chimeric construct consisting of GGBP and cpYFP was produced using an overlapping PCR with the primers P1 and P2. This product was cloned into the BamHI/HindIII sites of pRSETb (Invitrogen), yielding pRSETb-FGBP (GGBP and cpYFP chimeras) (Fig. S1A and S1B†). We truncated the N and C terminal amino acid residue of cpYFP to expand the dynamic range of FGBP by PCR (Fig. S1C†). To improve the affinity of the sensors, sited directed mutagenesis of FGBP27 μM was generated by PCR (Fig. S1D†). The electrophoresis data showed the protein size of different sensors (Fig. S1E†).Mlc knockout strain is a derivative of E. coli JM109 (DE3). Mlc was deleted according to the method of Datsenko and Wanner20 using plasmid pKD4 or pKD3, leaving the start codon and seven codons at the 3′ end of the target gene. The resistance cassettes were eliminated as described previously.20 To overexpress Mlc, the Mlc gene was amplified from E. coli genomic DNA by PCR and cloned into BamHI-HindIII sites in the pCDFDuet1 vector (Novagen).
2.2 Library construction
Preliminary truncations of the N- and C-terminals of cpYFP indicated that deletions beyond five AAs of the N- and C-terminals (data not shown) caused misfoldings. Therefore, the library was limited to the deletions of four AAs of the N- and C-terminals. Truncation combinations were amplified with Primers STAR HS DNA polymerase (Takara) and fused by T4 DNA ligase (Fermentas). Mutants with different affinities were engineered in FGBP27 μM, using overlap PCR,19 and then transferred to the pRSETb vector. The DNA sequence and amino acid sequence of FGBP1 mM are in the “ESI note†” section.2.3 Protein expression and in vitro characterization
All recombinant proteins with a His6-tag were expressed in E. coli JM109 (DE3) by the pRSETb expression plasmid as previously described.18 Proteins were purified with Ni–NTA His SpinTrap column.Spectral measurement was performed in 20 mM MOPS buffer (pH 7.4) by using a spectrofluorometer (EnSpire). Excitation spectra were recorded between 350 and 510 nm, and emission at 528 nm as previously described.14,15
For glucose titration, the protein was diluted in 20 mM MOPS buffer (pH 7.4) to a final concentration of 1 μM. The fluorescence value of protein was measured by a filter-based Synergy 2 Multi-Mode microplate reader using 400 BP 10 nm, 485 BP 20 nm excitation, and 528 BP 20 nm emission (BioTek). The ratio (R) was defined as the fluorescence intensity at 485 nm divided by the intensity at 400 nm.
The Kd of each glucose sensor was determined by fitting to a single-site binding isotherm:
 | (1) |
2.4 Monitoring glucose transport in E. coli cells
To monitor glucose transport in living cells, E. coli JM109 (DE3) cells carrying pRSETb-FGBP1 mM were grown in Luria-Bertani medium containing 100 μg ml−1 ampicillin at 37 °C until the cultures reached about 0.6–0.8 OD. The expression of proteins was induced by 0.1 mM IPTG at 18 °C overnight. E. coli cells were harvested by centrifugation at 4000 × g for 30 min at 4 °C, washed twice with M9 mini medium (pH 7.4, containing 100 mM HEPES), and then incubated in the same buffer for 6 h to ensure low endogenous glucose levels.After 6 h starving, E. coli cells were harvested by centrifugation, washed twice with M9 mini medium (pH 7.4, containing 100 mM HEPES), and then suspended in the same buffer. Subsequently, 45 μl cultures (0.5 OD) were transferred into 384 well plates. Fluorescence emission at 528 nm (excitation at 400 and 485 nm) was recorded for 5 min by Synergy 2 Multi-Mode microplate reader. M9 mini medium (5 μl) with different glucose concentrations was added manually to the cultures. Fluorescence was then measured for 30 min. Fluorescence values were background corrected by subtracting the intensity of E. coli JM109 (DE3) cell samples not expressing sensors.
3. Results and discussion
3.1 Generation of cpYFP-based sensors for glucose
To engineer a cpYFP-based indicator for glucose, bacterial periplasmic GGBP11–13 was chosen as a suitable glucose-binding detector because of the following findings: (1) glucose binds to GGBP with high specificity11,12 and (2) glucose binding to GGBP results in a dramatic conformational change demonstrated by X-ray and NMR analyses,13 as shown in Fig. 1A. In addition, GGBP was used as a sensor domain of FRET-based glucose indicators as previously reported.8,9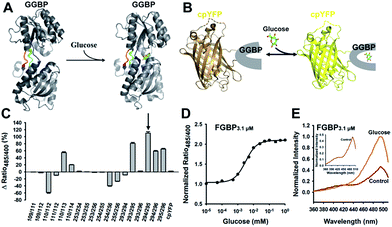 | ||
| Fig. 1 Generation of cpYFP-based glucose sensors. (A) Crystallographic structures of glucose-free (PDB ID code 2FW0) and glucose-binding (PDB ID code 2FVY) GGBP from E. coli are drawn using the molecular-graphics software PyMOL based on Protein Data Bank files. The colored ribbon parts [residues 109–114 (blue), 253–256 (green), 293–296 (red)] represent the flexible and target region for the insertion of cpYFP to generate glucose indicators. (B) Design of glucose sensor, in which cpYFP was inserted into the flexible linker region of GGBP. Binding of glucose (green and red) changes protein conformation and fluorescence. (C) Comparison of cpYFP and 18 sensor variants in glucose responsiveness. (D) Titration of the chimeric Pro294/Tyr295 protein named as FGBP3.1 μM. Fluorescence ratios were normalized to the control condition in the absence of glucose. (E) Excitation spectra of FGBP3.1 μM with or without 100 mM glucose, normalized to the peak intensity in the glucose condition. Emission was measured at 528 nm. For C and D, data are presented in three biological replicates, and error bars represent SEM. | ||
According to crystallographic structures of GGBP,13,18 chimeric proteins were generated by inserting cpYFP into the three flexible linker regions of GGBP, namely, Gly109–Glu114, Thr253–Asn256, and Val293–Val296 (Fig. 1A and B). Among them, the chimera with cpYFP inserted between Pro294 and Tyr295 of GGBP showed a 2.1-fold increase in the ratio of fluorescence when excited at 485 and 400 nm upon glucose addition (Fig. 1C, Table 1). Fluorescence titration studies showed that the Pro294/Tyr295 chimera named FGBP3.1 μM had an apparent dissociation constant (Kd) ∼3.1 μM for glucose at pH 7.4 (Fig. 1D, Table 1). Similar to other cpYFP-based sensors,17,18 FGBP3.1 μM has two typical excitation peaks around 420 and 500 nm and one emission peak near 515 nm (Fig. 1E).
| Sensor | Engineering | Rsat/Rapo (%) | Kd (mM) | Detection range (mM) |
|---|---|---|---|---|
| a P294/Y295, cpYFP was inserted between Pro294 and Tyr295 amino acids of GGBP.b N3C4, N-terminal 3 amino acids and C-terminal 4 amino acids of cpYFP were truncated. | ||||
| FGBP3.1 μM | P294/Y295 | 210 | 0.0031 | 0.0005–0.02 |
| FGBP27 μM | P294/Y295, N3C4 | 590 | 0.027 | 0.0009–0.86 |
| FGBP380 μM | P294/Y295, N3C4, N256S | 510 | 0.38 | 0.014–10 |
| FGBP1 mM | P294/Y295, N3C4, L238S | 690 | 1.0 | 0.026–38 |
| FGBP3.2 mM | P294/Y295, N3C4, A213R | 630 | 3.2 | 0.09–110 |
3.2 Optimization improves the responsiveness and affinity of FGBP sensors
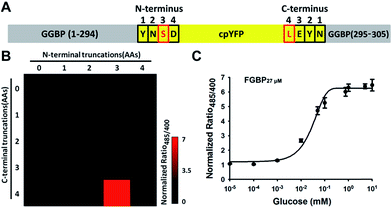
To maximize the response magnitude of sensors, we created a cpYFP-terminal truncation library between GGBP and cpYFP of FGBP3.1 μM (Fig. 2A) and found that the FGBP3.1 μM variant N3C4 manifests the most dramatic increase in the presence of glucose, as measured by the ratio of fluorescence excited at 485 and 420 nm (Fig. 2B). Fluorescence titration studies showed that the N3C4 variant (named FGBP27 μM) had an apparent Kd of ∼27 μM for glucose (Fig. 2C and Table 1).Physiological glucose level has been estimated in the range of 0.4–24 mM, such as 2–5 mM in plants,7 1.5 mM in yeast,21 3–9 mM in blood,22 1–10 mM in liver,23 and 0.4–24 mM in the intestine,24 far exceeding the dissociation constants of FGBP27 μM for glucose. To tune the affinity of the FGBP27 μM sensor, we further created variants of the sensor with single site-directed mutagenesis of three key amino acid residues around the glucose binding pocket (Fig. 3A).25–27 The three mutants, i.e., N256S, L238S, and A213R, had different affinities, with apparent Kd values of ∼380 μM, ∼1.0 mM, and ∼3.2 mM, and were denoted as FGBP380 μM, FGBP1 mM, and FGBP3.2 mM, respectively (Fig. 3B and Table 1). Considering the maximum fluorescence ratio change, affinity, and expression level, we chose FGBP1 mM, which covers the physiological blood glucose range, for further characterization (Table 1).
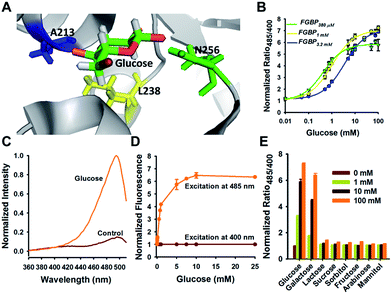 | ||
| Fig. 3 Optimization tunes the affinity of glucose sensor. (A) Crystallographic structure of GGBP (PDB ID code 2FVY) showing the glucose-binding pocket. Three sites (A213, L238, and N256) are potential for sensor affinity improvement. (B) Titration curves of A213R (named FGBP3.2 mM), L238S (named FGBP1 mM), and N256S (named FGBP380 μM) mutants. (C) Excitation spectra of FGBP1 mM with or without 100 mM glucose, normalized to the peak intensity in the glucose condition. Emission was measured at 528 nm. (D) Fluorescence intensities of FGBP1 mM with excitation at 400 or 485 nm normalized to the initial value; emission at 528 nm. (E) Substrate specificity of FGBP1 mM as measured by ratio485/400 in the presence of various sugar ligands. Data were normalized to the control condition in the absence of ligand. For B, D, and E, data are presented in three biological replicates, and error bars represent SEM. | ||
Similar to FGBP3.1 μM, FGBP1 mM also has two typical excitation peaks around 420 and 500 nm and one emission peak near 515 nm (Fig. 3C). Upon glucose binding, the fluorescence of FGBP1 mM excited at 485 nm showed a 6.5-fold increase, and the fluorescence excited at 400 nm was almost constant (Fig. 3D). Apart from glucose and galactose, none of the other sugars tested induced a significant change in ratio at 1 and 100 mM concentrations (Fig. 3E), showing the high selectivity of FGBP1 mM toward glucose. Glucose is expected to be present in significantly higher concentrations than galactose; thus, FGBP1 mM is suitable for glucose monitoring in living cells.
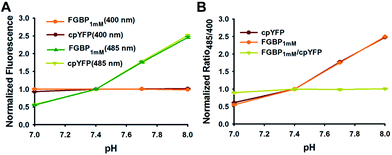
Similar to all other genetically encoded sensors based on cpYFP, FGBP1 mM depended on pH when excited at 485 nm; however, FGBP1 mM fluorescence excited at 400 nm is much more pH resistant (Fig. 4A). At modest pH fluctuations, the pH effects of FGBP1 mM can be corrected by measuring the fluorescence of FGBP1 mM and cpYFP in parallel, due to their very similar pH responses (Fig. 4B).
3.3 Real-time monitoring of intracellular glucose in living cells
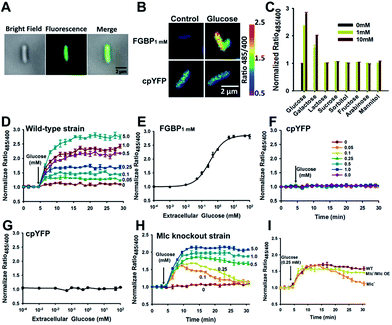
The ability of transport glucose across the plasma membrane is a common feature to nearly all cells, from the simple bacterium to the highly compartmented mammalian cells.28 To test the ability of FGBP1 mM to report changes in intracellular glucose levels, we expressed the FGBP1 mM sensor in living E. coli JM109 (DE3) cells. Fluorescence was uniform throughout the cell, suggesting that this sensor was located in the cytoplasm but not cell surface (Fig. 5A). Addition of exogenous glucose into the culture medium induced a rapid, dose-dependent, and saturable increase in the fluorescence ratio (Fig. 5B–E), whereas addition of glucose analogs had no effect on fluorescence (Fig. 5C). This finding suggested that glucose was readily transported across the cell membrane of these bacteria. Michaelis–Menten fitting of FGBP1 mM's fluorescence ratio versus extracellular glucose concentration produced a K0.5 of ∼0.3 mM (Fig. 5E), which is much higher than the Km for ptsG in E. coli, the high-affinity glucose transporter in the plasma membrane.29 By contrast, only slight changes in the fluorescence ratio were observed in E. coli JM109 (DE3) cells expressing cpYFP instead of FGBP1 mM when glucose was added to the cell culture medium (Fig. 5F and G), excluding the possibilities of fluorescence interference of pH variations of the cpYFP domain.The phosphotransferase system (PTS) is the major sugar transport system in many Gram-positive and Gram-negative bacterial species; however, expression of ptsG is repressed by the Mlc (making large colonies) protein.30 To investigate the role of Mlc on glucose transport, we constructed Mlc knockout E. coli JM109 (DE3) cells. Compared with wild-type cells, we surprisingly found that glucose-induced the increase of fluorescence gradually returned to basal levels as the extracellular glucose was consumed in Mlc knockout cells (Fig. 5D and H), and Mlc overexpression rendered the similarity in metabolic kinetics of these cells (Fig. 5I). These results imply that Mlc expression level not only regulates glucose uptake but also influences the rate of glucose metabolism.
4. Conclusions
In this work, we reported a series of ratiometric, highly specific, highly sensitive, and single fluorescent protein-based glucose sensors with different affinities. Among them, FGBP1 mM can detect glucose in the range of 0.02–40 mM, which covers the physiological glucose concentration in organisms. FGBP1 mM displays a large dynamic range and is very useful for the real-time tracking of subtle changes in cell metabolism. FGBP1 mM displays a ∼700% fluorescence change in vitro, almost 10-fold greater than that of previously reported FRET-based glucose sensors,5–10 rendering it a highly responsive genetic-encoded sensor. Compared with FRET-based glucose sensors, FGBP sensors only have one fluorescent protein and are intrinsically ratiometric, allowing the built-in normalization of the fluorescence signals irrespective of variations in indicator protein concentrations. Considering the admirable properties of these sensors, we believe that FGBP sensors could be good alternatives to existing methods for intracellular glucose detection.Conflicts of interest
The authors have declared no conflicts of interest.Acknowledgements
This work was supported by National Key Research and Development Program of China (2017YFA050400 to Y. Y., 2017YFC0906900 to Y. Zhao), NSFC (31225008, and 31470833 to Y. Y., 31722033, 91649123, and 31671484 to Y. Zhao), the Shanghai Science and Technology Commission (14XD1401400 and 16430723100 to Y. Y., and 15YF1402600 to Y. Zhao), Young Elite Scientists Sponsorship Program by Cast (to Y. Zhao), Shanghai Young Top-notch Talent (to Y. Zhao), the State Key Laboratory of Bioreactor Engineering (to Y. Y.), and the Fundamental Research Funds for the Central Universities (to Y. Y. and Y. Zhao).References
- R. J. DeBerardinis, J. J. Lum, G. Hatzivassiliou and C. B. Thompson, Cell Metab., 2008, 7, 11–20 CrossRef CAS PubMed.
- B. Ghesquiere, B. W. Wong, A. Kuchnio and P. Carmeliet, Nature, 2014, 511, 167–176 CrossRef CAS PubMed.
- A. R. Saltiel and C. R. Kahn, Nature, 2001, 414, 799–806 CrossRef CAS PubMed.
- K. Yamada, M. Saito, H. Matsuoka and N. Inagaki, Nat. Protoc., 2007, 2, 753–762 CrossRef CAS PubMed.
- B. H. Hou, H. Takanaga, G. Grossmann, L. Q. Chen, X. Q. Qu, A. M. Jones, S. Lalonde, O. Schweissgut, W. Wiechert and W. B. Frommer, Nat. Protoc., 2011, 6, 1818–1833 CrossRef CAS PubMed.
- C. Bermejo, F. Haerizadeh, H. Takanaga, D. Chermak and W. B. Frommer, Nat. Protoc., 2011, 6, 1806–1817 CrossRef CAS PubMed.
- K. Deuschle, B. Chaudhuri, S. Okumoto, I. Lager, S. Lalonde and W. B. Frommer, Plant Cell, 2006, 18, 2314–2325 CrossRef CAS PubMed.
- H. Takanaga, B. Chaudhuri and W. B. Frommer, Biochim. Biophys. Acta, 2008, 1778, 1091–1099 CrossRef CAS PubMed.
- M. Fehr, S. Lalonde, I. Lager, M. W. Wolff and W. B. Frommer, J. Biol. Chem., 2003, 278, 19127–19133 CrossRef CAS PubMed.
- K. Deuschle, S. Okumoto, M. Fehr, L. L. Looger, L. Kozhukh and W. B. Frommer, Protein Sci., 2005, 14, 2304–2314 CrossRef CAS PubMed.
- F. A. Quiocho and J. W. Pflugrath, J. Biol. Chem., 1980, 255, 6559–6561 CAS.
- M. N. Vyas, N. K. Vyas and F. A. Quiocho, Biochemistry, 1994, 33, 4762–4768 CrossRef CAS PubMed.
- M. J. Borrok, L. L. Kiessling and K. T. Forest, Protein Sci., 2007, 16, 1032–1041 CrossRef CAS PubMed.
- Y. Zhao, J. Jin, Q. Hu, H. M. Zhou, J. Yi, Z. Yu, L. Xu, X. Wang, Y. Yang and J. Loscalzo, Cell Metab., 2011, 14, 555–566 CrossRef CAS PubMed.
- Y. Zhao, Q. Hu, F. Cheng, N. Su, A. Wang, Y. Zou, H. Hu, X. Chen, H. M. Zhou, X. Huang, K. Yang, Q. Zhu, X. Wang, J. Yi, L. Zhu, X. Qian, L. Chen, Y. Tang, J. Loscalzo and Y. Yang, Cell Metab., 2015, 21, 777–789 CrossRef CAS PubMed.
- Y. Zhao, A. Wang, Y. Zou, N. Su, J. Loscalzo and Y. Yang, Nat. Protoc., 2016, 11, 1345–1359 CrossRef CAS PubMed.
- R. Tao, Y. Zhao, H. Chu, A. Wang, J. Zhu, X. Chen, Y. Zou, M. Shi, R. Liu, N. Su, J. Du, H. M. Zhou, L. Zhu, X. Qian, H. Liu, J. Loscalzo and Y. Yang, Nat. Methods, 2017, 14, 720–728 CrossRef CAS PubMed.
- H. Hu, Y. Gu, L. Xu, Y. Zou, A. Wang, R. Tao, X. Chen, Y. Zhao and Y. Yang, Sci. Rep., 2017, 7, 43479 CrossRef PubMed.
- R. M. Horton, Mol. Biotechnol., 1995, 3, 93–99 CrossRef CAS PubMed.
- K. A. Datsenko and B. L. Wanner, Proc. Natl. Acad. Sci. U. S. A., 2000, 97, 6640–6645 CrossRef CAS PubMed.
- B. Teusink, J. A. Diderich, H. V. Westerhoff, K. van Dam and M. C. Walsh, J. Bacteriol., 1998, 180, 556–562 CAS.
- M. Konig, S. Bulik and H. G. Holzhutter, PLoS Comput. Biol., 2012, 8, e1002577 Search PubMed.
- K. R. Albe, M. H. Butler and B. E. Wright, J. Theor. Biol., 1990, 143, 163–195 CrossRef CAS PubMed.
- R. P. Ferraris, S. Yasharpour, K. C. Lloyd, R. Mirzayan and J. M. Diamond, Am. J. Physiol., 1990, 259, G822–G837 CAS.
- T. J. Amiss, D. B. Sherman, C. M. Nycz, S. A. Andaluz and J. B. Pitner, Protein Sci., 2007, 16, 2350–2359 CrossRef CAS PubMed.
- O. V. Stepanenko, A. V. Fonin, O. V. Stepanenko, K. S. Morozova, V. V. Verkhusha, I. M. Kuznetsova, K. K. Turoverov, M. Staiano and S. D'Auria, J. Phys. Chem. B, 2011, 115, 9022–9032 CrossRef CAS PubMed.
- S. Joel, K. B. Turner and S. Daunert, ACS Chem. Biol., 2014, 9, 1595–1602 CrossRef CAS PubMed.
- M. Mueckler, Eur. J. Biochem., 1994, 219, 713–725 CrossRef CAS PubMed.
- S. Steinsiek and K. Bettenbrock, J. Bacteriol., 2012, 194, 5897–5908 CrossRef CAS PubMed.
- J. Plumbridge, Curr. Opin. Microbiol., 2002, 5, 187–193 CrossRef CAS PubMed.
Footnote |
| † Electronic supplementary information (ESI) available. See DOI: 10.1039/c7ra11347a |
| This journal is © The Royal Society of Chemistry 2018 |

