 Open Access Article
Creative Commons Attribution 3.0 Unported Licence
Analysis based on scaling relations of critical behaviour at PM–FM phase transition and universal curve of magnetocaloric effect in selected Ag-doped manganites
S. Tarhouni *a,
R. M'nassri
 *b,
A. Mleikia,
W. Cheikhrouhou-Koubaaa,
A. Cheikhrouhoua and
E. K. Hlilc
aLT2S Lab (LR16 CRNS 01), Digital Research Center of Sfax, Sfax Technopark, Cité El Ons, B.P. 275, 3021 Tunisia
bUnité de Recherche Matériaux Avancés et Nanotechnologies (URMAN), Higher Institute of Applied Sciences and Technology of Kasserine, Kairouan University, BP 471 Kasserine 1200, Tunisia. E-mail: rafik_mnassri@yahoo.fr
cInstitut Néel, CNRS et Université Joseph Fourier, BP 166, F-38042 Grenoble Cedex 9, France
First published on 18th May 2018
Abstract
The critical behaviour of Pr0.5Sr0.5−xAgxMnO3 (0 ≤ x ≤ 0.2) samples around the paramagnetic–ferromagnetic phase transition is studied based on isothermal magnetization measurements. The assessments based on Banerjee's criteria reveal the samples undergoing a second-order magnetic phase transition. Various techniques such as modified Arrott plot, Kouvel–Fisher method, and critical isotherm analysis were used to determine the values of the ferromagnetic transition temperature TC, as well as the critical exponents of β, γ and δ. The values of critical exponents, derived from the magnetization data using the Kouvel–Fisher method, are found to be (β = 0.43 ± 0.002, 0.363 ± 0.068 and 0.328 ± 0.012), (γ = 1.296 ± 0.007, 1.33 ± 0.0054 and 1.236 ± 0.012) for x = 0.0, 0.1 and 0.2, respectively. This implies that the Pr0.5Sr0.5−xAgxMnO3 with 0 ≤ x ≤ 0.2 systems does not belong to a single universality class and indicates that the presence of magnetic disorder in the system must be taken into account to fully describe the microscopic interaction of these manganites. With these values, magnetic-field dependences of magnetization at temperatures around TC can be well described following a single equation of state for our samples. From magnetic entropy change (ΔSM), it was possible to evaluate the critical exponents of the magnetic phase transitions. Their values are in good agreement with those obtained from the critical exponents using a modified Arrott plot (MAP). We used the scaling hypotheses to scale the magnetic entropy change and heat capacity changes to a universal curve respectively for Pr0.5Sr0.5−xAgxMnO3 samples.
1. Introduction
Since the discovery of colossal magnetoresistance (CMR) in perovskite-manganites, extensive efforts have been carried out theoretically and experimentally to investigate the physical properties of these materials.1–3 These oxide systems showing multifunctional properties have always had a fascination with science and technology and this has developed into research interests due to the rich fundamental physics and their presence in useful applications including magnetocaloric effect (MCE).4–6 This family of materials exhibits a wide variety of interesting phenomena like ferromagnetism, ferroelectricity, transition from metal to insulator behaviour and charge ordering (CO).7 The latter properties are related to the competing electron–lattice and electron–electron interactions.8–10 Generally, in perovskite-manganites system, studies of divalent cation doping show that manganese ions are formed in two oxidation states: a trivalent state (Mn3+) as well as tetravalent state (Mn4+). The induced holes in the eg level create a mixed-valence system and it contributed on ferromagnetism and conduction. These behaviours are usually interpreted with the help of double exchange mechanism, where the magnetic coupling between Mn3+ and Mn4+ ions results from the motion of an electron between the two partially filled d-orbitals with strong on-site Hund's coupling.11The study of phase transitions in manganites is of special importance, since the relationship between the ferromagnetism, CMR and MCE have been a topic of great interest due to the complexity of their magnetic phase diagram. The exploration of critical phenomena in the perovskite manganites has attracted interest since early on in the renaissance of this fascinating class of materials beginning in the 1990s (ref. 12) and still remains one of the actual directions in the condensed state physics. However, half doped manganites Pr0.5Sr0.5MnO3 show interesting properties such as coexistence of contrasting phases, namely, ferromagnetic (FM)–metallic (M) and antiferromagnetic (AF)–insulating (I). In fact, a subtle balance between different phases generally hides behind these complex phenomena, which can be readily shifted or entirely broken by some external stimulus. The substitution with low amount of silver for example destroys the antiferromagnetic phase and drives the system towards a ferromagnetic state at low temperatures.13 Meanwhile, it also provides a precious opportunity for us to discover the potential properties and their critical behaviour.
Ferromagnetic Pr-based manganites are intrinsically inhomogeneous, both above and below FM–PM transition temperature (TC) due to coexistence of FM and antiferromagnetic (AFM) interactions.14 Consequently, to get more information about FM–PM transition nature, it is important to study in detail the critical exponents associated with the transition.15 This analysis can provide us the order, the universality class, and the effective dimensionality of the phase transition around the Curie temperature TC.16 This practice of assigning such universal classes based on theoretical spin–spin interaction models (like mean field, 3D- Ising or 3D- Heisenberg) has been useful in trying to discern the intricacies of magnetic transitions in real systems.17 Several experimental studies of critical phenomena were previously made on ferromagnetic manganites.18–21 Therefore, the critical behaviour of manganites near the PM–FM phase transition by using a variety of techniques have yielded a wide range of values for the critical exponent β. The values from about 0.3 to 0.5, which embrace mean-field (β = 0.5), three-dimensional (3-D) isotopic nearest neighbor Heisenberg (β = 0.365) and 3-D Ising (β = 0.325) estimates.
In order to establish the relationship between the exponent local n and the critical exponents of the materials, field dependence of entropy change (follows a power law ΔSmaxM ≈ (μ0H)n) is checked.22 The MCE data of different materials of the same universality class should fall onto the same curve irrespective of the applied magnetic field. Because of the intrinsic relation between the MCE and the universality class, one can obtain the critical exponents based on the MCE data, which may be another method to determine the critical behaviour of phase transition, i.e., the universality class.23–25 The present work extends recent studies on Pr-based manganites26–29 and presents a detailed investigation of the critical behaviour in Pr0.5Sr0.5−xAgxMnO3 (0.0 ≤ x ≤ 0.2) at its PM–FM transition via the detailed measurement of the dc magnetization. The Curie temperature and the critical exponents β, γ and δ were determined. Here the value of field exponent n can be obtained from results of the critical behaviour and the MCE analyses. In addition, scaling analysis was used in order to check the validity of these exponents.
2. Experimental details
Ceramic samples of Pr0.5Sr0.5−xAgxMnO3 (0.0 ≤ x ≤ 0.2) were synthesized from high purity precursors: Pr6O11, SrCO3, Ag2CO3 and MnO2 (Aldrich 99.9%; USA) in the desired proportions by sol–gel method using nitrate–citrate route.30 Stoichiometric amounts of these reagents which were dissolved in diluted nitric acid with continuous stirring and moderate heating resulting in a transparent solution. NH3 was added to convert the corresponding precursors into their respective nitrates. Citric acid (C6H8O7) in 1![[thin space (1/6-em)]](https://www.rsc.org/images/entities/char_2009.gif) :
:![[thin space (1/6-em)]](https://www.rsc.org/images/entities/char_2009.gif) 1.5 M ratio with respect to the metal nitrates was added to serve as a complexing agent of the metal ions, and the pH of the solution was controlled by the addition of NH3. After continuous stirring for 2 h, ethylene glycol is added as a polymerization agent and the mixture is maintained at 90 °C until the formation of brown gel. The resulting solution was evaporated at 130 °C until a viscous gel-like product was formed. The gel was then dried by slow heating in air up to 300 °C for 2 h. The Pr0.5Sr0.5−xAgxMnO3 (x = 0.0, 0.1 and 0.2) crystallized powders were obtained by calcination at 600 °C for 6 h. The resulting powder was then pressed in a pellet and subsequently heated at 1100 °C for 40 h to be consolidated. Phase purity, homogeneity and cell dimensions were determined by means of X-ray powder diffraction at room temperature (with a diffractometer using Cu Kα radiation). Structural analyses were carried out using the standard Rietveld method.13,31 To understand better the critical exponents of the samples accurately, the magnetization as a function of magnetic field for all materials were measured in the range of 0–5T. The magnetic measurements were carried out using a “cryogenic” vibrating sample magnetometer (VSM). These isothermals are corrected by a demagnetization factor D that has been determined by a standard procedure from low-field dc magnetization measurement at low temperatures (H = Happ − DM).
1.5 M ratio with respect to the metal nitrates was added to serve as a complexing agent of the metal ions, and the pH of the solution was controlled by the addition of NH3. After continuous stirring for 2 h, ethylene glycol is added as a polymerization agent and the mixture is maintained at 90 °C until the formation of brown gel. The resulting solution was evaporated at 130 °C until a viscous gel-like product was formed. The gel was then dried by slow heating in air up to 300 °C for 2 h. The Pr0.5Sr0.5−xAgxMnO3 (x = 0.0, 0.1 and 0.2) crystallized powders were obtained by calcination at 600 °C for 6 h. The resulting powder was then pressed in a pellet and subsequently heated at 1100 °C for 40 h to be consolidated. Phase purity, homogeneity and cell dimensions were determined by means of X-ray powder diffraction at room temperature (with a diffractometer using Cu Kα radiation). Structural analyses were carried out using the standard Rietveld method.13,31 To understand better the critical exponents of the samples accurately, the magnetization as a function of magnetic field for all materials were measured in the range of 0–5T. The magnetic measurements were carried out using a “cryogenic” vibrating sample magnetometer (VSM). These isothermals are corrected by a demagnetization factor D that has been determined by a standard procedure from low-field dc magnetization measurement at low temperatures (H = Happ − DM).
3. Results and discussions
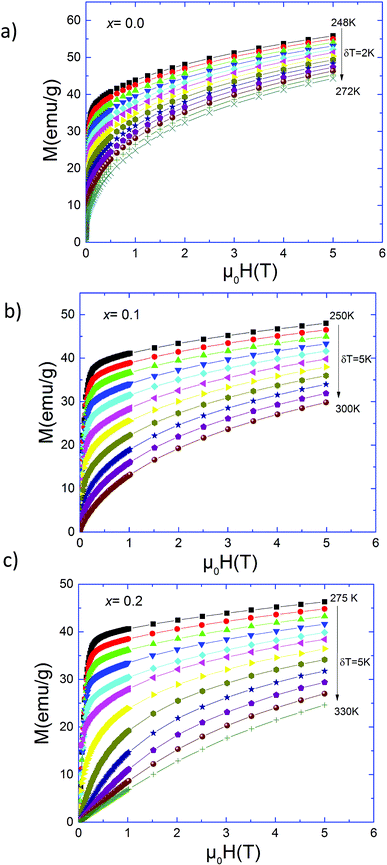
X-Ray diffraction study reveals that all samples crystallize in the distorted orthorhombic symmetry with Pbnm space group. No impurity peaks were observed in the XRD pattern of the Pr0.5Sr0.5MnO3 sample indicating the single-phase formation of this compound but for the Ag-doped samples a detectable secondary phase Ag-metal appears. According to Rietveld refinement, the cell volume is slightly varying between 228.77 Å3 for x = 0.0 and 228.9087 Å3 for x = 0.2 with silver doping and the average crystallite sizes are ∼33.162 nm, 39.0982 nm and ∼59.368 nm respectively for x = 0.0, x = 0.1 and x = 0.2. The morphology and the grains size of the samples reveal that the grains are irregularly spherical-like and the mean sizes are spread between ∼150 nm for x = 0.0 and ∼600 nm for x = 0.2. This result indicates that the incorporation of Ag into the Sr-site facilities the grain growth during the sintering process. It has been observed that the Ag doping strongly influence the structural. The intrinsic Ag agent enhances the grain size, Mn4+/Mn3+ ratio, and causes a nonlinear variation in Mn–O–Mn bond angle and electronic bandwidth W (see ref. 13 for more details).Magnetization measurements versus temperature in field cooled (FC) regime of Pr0.5Sr0.5−xAgxMnO3 (0.0 ≤ x ≤ 0.2) samples are reported elsewhere.13 Our samples present a transition from a ferromagnetic (FM) to a paramagnetic (PM) state at Curie temperature (TC). In Fig. 1, we present the isothermal magnetization M(μ0H) of Pr0.5Sr0.5−xAgxMnO3 (0.0 ≤ x ≤ 0.2) measured from 0 to 5T near their critical regions. These curves exhibit a gradual FM to PM transition. A sharp rise in magnetization at low applied fields has been observed due to magnetic domain rotation in the three compounds.20 In the paramagnetic state, the curves M(μ0H) begin to be linear only at elevated temperatures, well above the TC. Below TC, the magnetization still increases rapidly at low fields, signature of a ferromagnetic behaviour but does not achieve saturation values even at 5T.
In order to determine the type of magnetic phase transition in Pr0.5Sr0.5−xAgxMnO3 (0.0 ≤ x ≤ 0.2) samples, we have analyzed Arrott plots which were converted from the isothermal M–μ0H data. If long-range interactions were responsible for the ferromagnetic transition, there would be a linear behaviour at high fields around TC and the line at T = TC should just pass through the origin. As all curves present a downward slope, a non-mean field behaviour is present in this case. Following the Banerjee criterion,32 the order of magnetic transition can be determined from the slope of straight line. The positive slope corresponds to the second order character of the transition while the negative slope of the curves confirms the first order character transition.33
Fig. 2 contains the standard Arrott plots constructions where M2 is represented as a function of μ0H/M for Pr0.5Sr0.5−xAgxMnO3 (0.0 ≤ x ≤ 0.2) samples. Positive slopes were observed in the Arrott plots around TC for our compounds. Therefore, we can conclude that the para-to-ferromagnetic transition is consistently of second order for all compositions. Basically, the Arrott plots were used to determine the critical exponents if the isotherms M2 vs. μ0H/M constitute a set of parallel straight lines around TC. However, the Arrott plots for our materials show a nonlinear and concave behaviour even in high field range. This indicates that the present phase transition does not satisfy the mean-field theory and that true long-range FM order is absent in all samples. To better, obtain the right values of β and γ exponents, the mean-field approximation can be generalized to the so-called modified Arrott-plot (MAP) expression, based on the Arrott–Noakes equation of state.34 In this context, the second order magnetic transition near the Curie point TC is characterized by a set of interrelated critical exponents β, γ and δ.
 | ||
| Fig. 2 Standard Arrott plots (isotherms H/M vs. M2) for Pr0.5Sr0.5−xAgxMnO3 (0 ≤ x ≤ 0.2) compounds. | ||
From magnetization measurements, the mathematical definitions16,35,36 of the critical exponents are described below:
 | (1) |
 | (2) |
| M = DH1/δ, ε = 0, T = TC | (3) |
| M(H,ε) = εβf±(H/εβ+γ) | (4) |
Generally, the critical exponents and critical temperature can be easily determined from the Arrott–Noakes equation of state:
 | (5) |
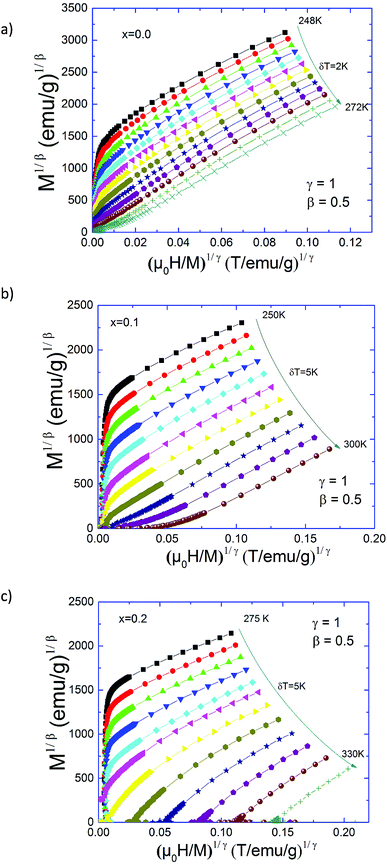
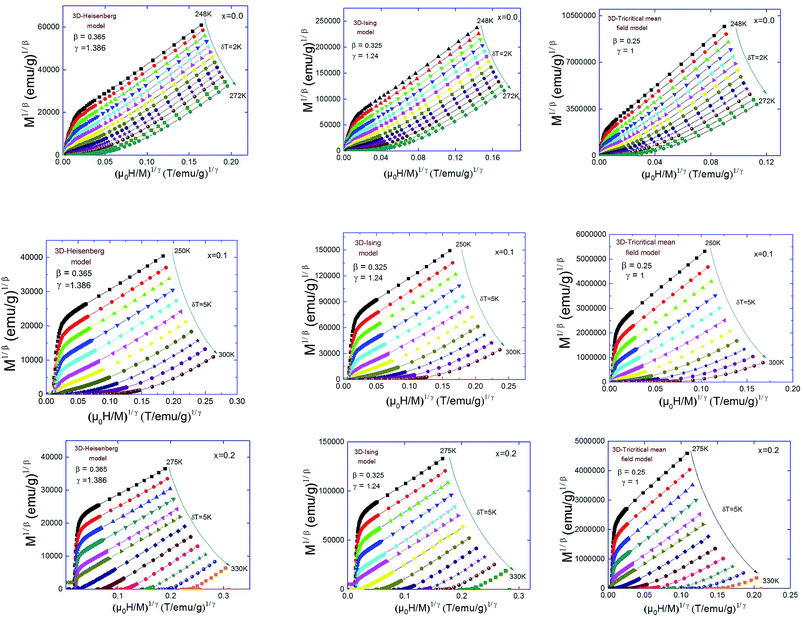 | ||
| Fig. 3 Modified Arrott plots: isotherms of M1/β vs. (H/M)1/γ with the 3D-Heisenberg model, the 3D-Ising model and the tri-critical mean-field model for Pr0.5Sr0.5−xAgxMnO3 compounds. | ||
These three models yield quasi straight lines and nearly parallel in the high field region. Thus, it is somewhat difficult to determine which one of them is the best for the determination of critical exponents. Thus, we calculated the so called relative slope (RS) defined at the critical point as RS = S(T)/S(TC). The RS versus temperature for the three models is shown in Fig. 4. If the modified Arrott plots show a series of absolute parallel lines, the relative slope of the most satisfactory model should be kept to 1 irrespective of temperatures.38 As shown in Fig. 4(a) and (b), the RS of Pr0.5Sr0.5MnO3 and Pr0.5Sr0.4Ag0.1MnO3 using mean-field, 3D-Ising and tri-critical mean-field models clearly deviates from 1, but the RS of 3D-Heisenberg model is close to it. As for Pr0.5Sr0.3Ag0.2MnO3 it is clearly from Fig. 4(c) the RS for our sample (x = 0.2) is very close to 1 when the 3D-Ising model is used. Thus, the critical properties of Pr0.5Sr0.5−xAgxMnO3 (0.0 ≤ x ≤ 0.2) samples can be described with the 3D-Heisenberg for x = 0.0 and 0.1 and 3D-Ising models for x = 0.2.
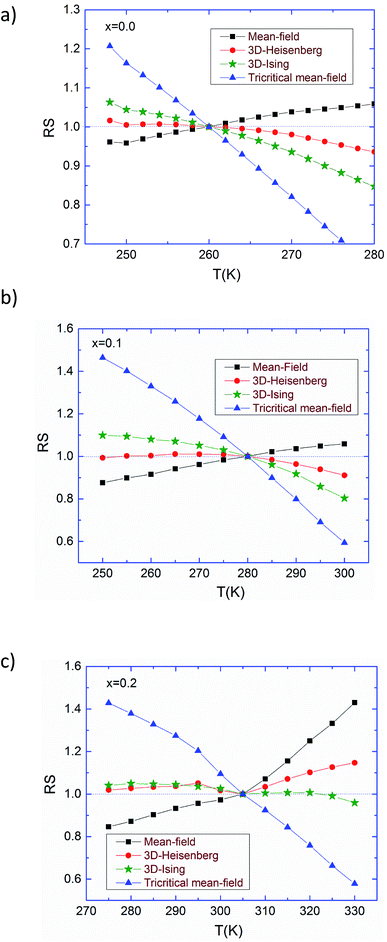 | ||
| Fig. 4 Relative slope (RS) of Pr0.5Sr0.5MnO3 (a), Pr0.5Sr0.4Ag0.1MnO3 (b) and Pr0.5Sr0.3Ag0.2MnO3 (c) samples as a function of temperature defined as RS = S(T)/S(TC), using several methods. | ||
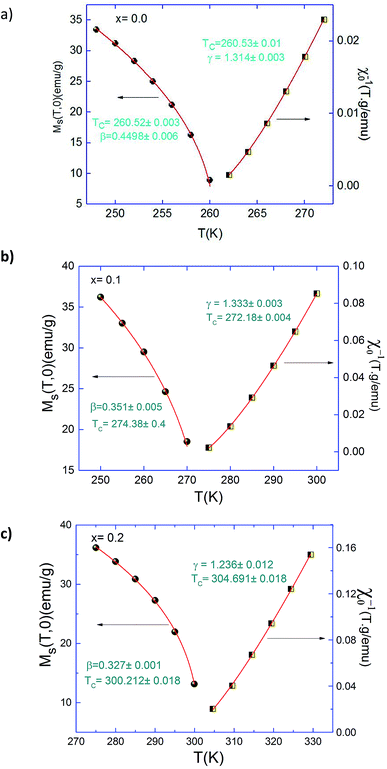
Based on these isotherms, the spontaneous magnetization MS(T,0) and the inverse of susceptibility χ0−1(T,0) data can be calculated from the linear extrapolation in the high field straight-line to the co-ordinate axes M1/β and (H/M)1/γ, respectively. In Fig. 5 we plotted the temperature dependence of MS (T,0) and χ0−1(T,0) for Pr0.5Sr0.5−xAgxMnO3 (x = 0.1 and 0.2) samples. We get new values of β, γ and TC by fitting these plots with eqn (1) and (2). Thus, new values of the critical exponents were determined and reported in Table 1.
| Materials | Technique | TC (K) | β | γ | δ | Ref. |
|---|---|---|---|---|---|---|
| Mean-field model | Theory | 0.5 | 1.0 | 3.0 | 18 | |
| 3D-Heisenberg model | Theory | 0.365 ± 0.003 | 1.386 ± 0.004 | 4.80 ± 0.04 | 18 | |
| 3D-Ising model | Theory | 0.325 ± 0.002 | 1.241 ± 0.002 | 4.82 ± 0.02 | 18 | |
| Tricritical mean-field model | Theory | 0.25 | 1 | 5 | 18 | |
| Pr0.5Sr0.5MnO3 (Heisenberg) | MAP | 260.52 ± 0.004 | 0.44 ± 0.006 | 1.31 ± 0.003 | 3.98 | This work |
| KF | 260.49 ± 0.03 | 0.43 ± 0.002 | 1.296 ± 0.007 | 4.01 | This work | |
| C.I (exp) | — | — | — | 4.383 ± 0.02 | This work | |
| Pr0.5Sr0.4Ag0.1MnO3 (Heisenberg) | MAP | 273.28 ± 0.416 | 0.351 ± 0.005 | 1.333 ± 0.0032 | 4.79 | This work |
| KF | 273.5 ± 0.099 | 0.363 ± 0.068 | 1.33 ± 0.0054 | 4.66 | This work | |
| C.I (exp) | — | — | — | 4.037 ± 0.02 | This work | |
| Pr0.5Sr0.3Ag0.2MnO3 (Ising) | MAP | 302.45 ± 0.28 | 0.327 ± 0.001 | 1.236 ± 0.012 | 4.77 | This work |
| KF | 300 ± 0.007 | 0.328 ± 0.012 | 1.236 ± 0.012 | 4.76 | This work | |
| C.I (exp) | — | — | — | 3.775 ± 0.03 | This work | |
| Pr0.55Sr0.45MnO3 | 290 | 0.462 | 1.033 | 4.749 | 46 | |
| Pr0.6Sr0.4MnO3 | 301 | 0.365 ± 0.004 | 1.309 ± 0.002 | 4.648 | 47 | |
| Pr0.5Sr0.5MnO3 | 261.36 | 0.443 ± 0.002 | 1.339 ± 0.006 | 4.022 ± 0.003 | 49 | |
| Pr0.52Sr0.48MnO3 | 273 | 0.462 ± 0.02 | 1.210 ± 0.03 | 3.563 ± 0.002 | 47 | |
| Pr0.8Na0.10K0.10MnO3 | MAP | 124.9(1) | 0.31(5) | 1.29(4) | 71 | |
| KF | 125.2(6) | 0.32(4) | ||||
| C.I (exp) | 4.88(2) | |||||
| Pr0.8Na0.05K0.15MnO3 | MAP | 134.9(4) | 0.32(3) | 71 | ||
| KF | 132.1(2) | 0.31(1) | ||||
| C.I (exp) | 4.52(1) | |||||
| La0.8Ca0.2MnO3 | 181 | 0.325 | 1.180 | 4.826 | 48 | |
| (Pr,Sm)0.5Sr0.5MnO3 | 217 | 0.378 | 1.2 | 4.291 | 20 |
The best fits of MS(T,0) and χ0−1(T,0) give:
To further support the correctness of the obtained exponents and TC, Kouvel–Fisher (KF) method40 is applied to deduce the critical exponents β, and γ along with TC:
| MS(T)[dMS(T)/dT]−1 = (T − TC)/β | (6) |
| χ0−1(T)[dχ0−1(T)/dT]−1 = (T − TC)/γ | (7) |
According to these equations, new plots of MS (dMS/dT)−1 and χ0−1(dχ0−1/dT)−1 versus temperature should yield straight lines with slopes 1/β and 1/γ, respectively and the intercepts on T axes are equal to Curie temperature (TC). These plots are shown in Fig. 6. The linear fitting to the plots following the KF method gives β, γ and TC which agree well with those that using the MAP of 3D-Heisenberg model for (x = 0.0 and 0.1) also 3D-Ising with x = 0.2. The critical exponents obtained from KF method are:
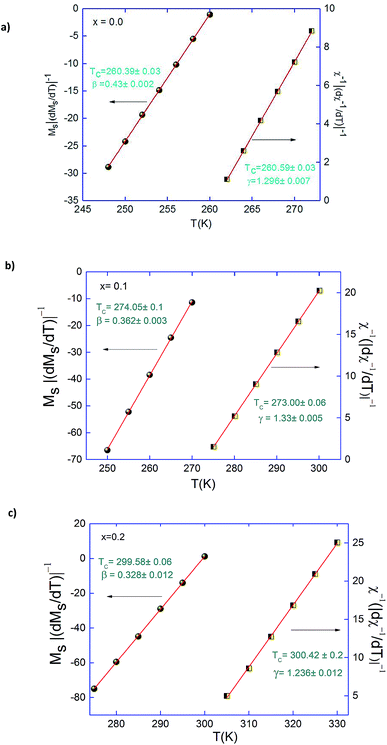 | ||
| Fig. 6 Kouvel–Fisher plots for the spontaneous magnetization and the inverse initial susceptibility for Pr0.5Sr0.5−xAgxMnO3 (x = 0.0, 0.1 and 0.2) compounds. | ||
Concerning the value of third exponent δ, it can be obtained directly by plotting the critical isotherm M(TC,H). Fig. 7 shows the critical isotherm M(μ0H) curves for x = 0.0, x = 0.1 and 0.2 measured from 0 to 5T at Curie temperatures with a ln(M) vs. ln(μ0H) scale in its insets. According to eqn (3), ln(M) vs. ln(μ0H) plot would give a straight line with a slope of 1/δ. From the linear fitting, we have got δ = 4.383 ± 0.02, 4.037 ± 0.02 and 3.775 ± 0.03 for x = 0.0, 0.1 and 0.2, respectively. The exponent δ has also been calculated from the Widom scaling relation according to the following equation:41,42
 | (8) |
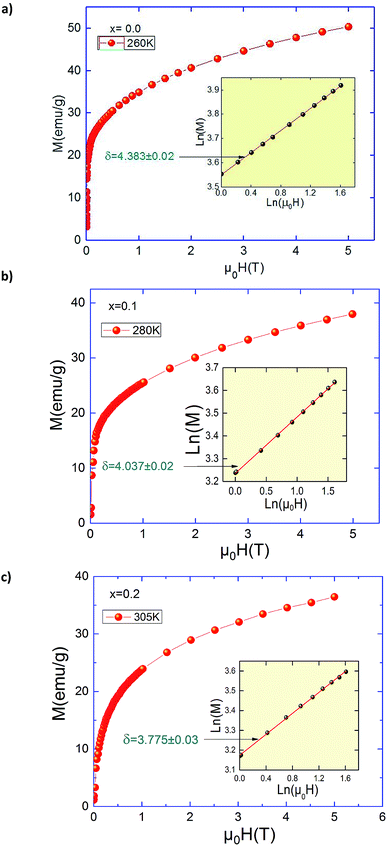 | ||
| Fig. 7 Critical isotherms of M vs. H corresponding to TC for Pr0.5Sr0.5−xAgxMnO3 (x = 0.0, 0.1 and 0.2) compounds. | ||
Using this scaling relation and the estimated values of β and γ obtained from the MAP we found: δ = 3.98, 4.79 and 4.77 for x = 0.0, 0.1 and 0.2, respectively. The values obtained from critical isotherms M(TC,H) are slightly larger than determined from the Widom scaling. This difference can be explained by the experiments errors. Therefore, it is important to check if these critical exponents can generate the scaling equation of state for our materials. In the critical region, the magnetization and internal field which should obey the magnetic equation of state is depicted in Fig. 8 for x = 0.1 and 0.2, according to eqn (4). The insets show the same plots in log–log scale. It can clearly see that all the points collapse into two different curves, one for T < TC and the other for temperatures for T > TC. This finding denotes the obtained critical exponents and TC are valid. It is found that the scaling is good at higher fields and confirms that the obtained critical exponents and TC values are unambiguous, self-consistent and should be intrinsic, whereas the scaling becomes poor, in particular toward low fields which is mainly related to the rearrangement of magnetic domains where magnetic moments are not completely aligned to the field.43
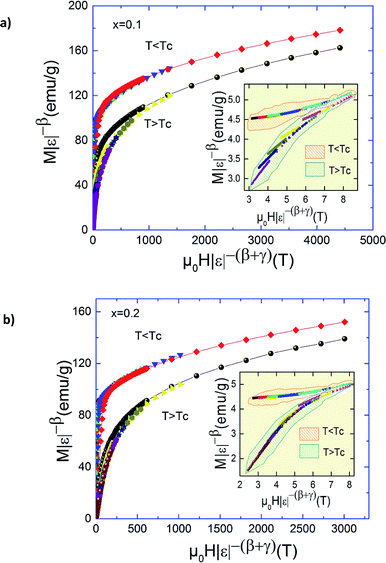 | ||
| Fig. 8 Scaling plots indicating two universal curves below and above TC for Pr0.5Sr0.5−xAgxMnO3 (x = 0.1 and 0.2) compounds. Inset shows the same plots on a log–log scale. | ||
Moreover, the critical exponents for the other three compositions with x = 0, 0.1 and 0.2 are obtained in the same way, as is summarized in Table 1. For comparison, the predicted values of three classic theoretical models16,44 and some of other manganites18,21,26,45–48 are also presented in Table 1. A comparison of the current results with the classical models shows that the pristine compound PSMO has the following properties: (i) it does not comply with the 3D-short-range interaction models; (ii) estimated exponents are in between the values for 3D-Heisenberg (β = 0.365, γ = 1.386) and mean-field model (β = 0.5, γ = 1) indicating interaction is of extended type; (iii) it is having of itinerant character.36 It can be mentioned that the exponents in Table 1 are not consistent with that for dipolar-FM,49 so we have attempted to explain the spin interaction in PSMO based on the 3D-Heisenberg model. On the other hand, the critical exponents obtained for Pr0.5Sr0.4Ag0.1MnO3 are belong to that expected for the 3D-Heisenberg model (β = 0.365, γ = 1.386), whereas the values obtained for Pr0.5Sr0.3Ag0.2MnO3 are belong to that expected for the 3D-Ising (β = 0.325, γ = 1.241) model. Generally, 3D-Heisenberg model is useful to describe a magnetic system with isotropic nearest–neighbor exchange interactions between localized spins, and we know that the short-range 3D-Ising model with strong anisotropic properties fully describes the magnetic phase transition. Then, both of which correspond to short range FM interaction.
Physically, β describes how the ordered moment grows T < TC while γ describes the divergence of magnetic susceptibility at TC and the decrease in γ yields a sharp divergence of χ(T) at Curie temperature. The β value decreases with increasing Ag content, reflecting a faster growth of the ordered moment with decreasing temperature in Ag-doped PSMO samples, and is between those expected for the 3D-Heisenberg (β = 0.365) and the 3D-Ising (β = 0.325) models. This reveals that the short-range FM interaction originates from phase inhomogeneity (due to grain boundaries and isotropic properties) and evolves with addition of disorder depending on Ag concentration. It comes to our attention that the β value tends to shift from 0.44 to 0.327 if Ag content increases in PSMO. The fact, that the β values are smaller than 0.5 indicates the existence of magnetic inhomogeneity.50–52 This microscopic inhomogeneity affects the FM interaction between Mn3+ ions to Mn4+ ions, and the FM clusters grow in size and number with increasing Ag content, which leads to enhanced PM to FM phase transition in mixed-valence manganites. The Mn3+/Mn4+ ratio plays a particularly important role in governing the properties of manganites. Indeed, the β value tends to shift towards the values of the 3-D Ising model (β = 0.325) if the amount of Ag will equal 0.2, indicating the existence of short-range FM order associated with the magnetic inhomogeneity and random distribution of Pr3+, Sr2+ and Ag+ cations with different sizes. Hence, the FM interaction exhibits strong anisotropy, following so the 3D-Ising model for Pr0.5Sr0.3Ag0.2MnO3 samples. These results can be explained by the fact that Ag1+ ions introduced in the perovskite phase substitutes Sr2+ ions resulting some of Mn3+ ions to become Mn4+ ions proportional the substituted Ag ion concentration. The co-existence of manganese in two valance states plays a critical role on the magnetic properties of these compounds. Mn3+/Mn4+ ratio changes rapidly by Ag1+ ions since one Ag1+ oxidizes two Mn3+ ions to two Mn4+ ions. It is well known that, Mn3+ and Mn4+ ions differ in their ionic radii. Sr2+ and Ag1+ ions also have different ionic radii. Because of these ionic radii differences, the lattice parameters of crystal structure of the resulting compound changes, in turn, effecting magnetic properties of the material. The reason for this can be understood considering Zener's double exchange mechanism,53 according to which the Mn3+/Mn4+ ratio and Mn–O–Mn bond length and angle affect the spin ordering of Mn3+ and Mn4+ ions, resulting a dramatic change in material's magnetic properties.
The obtained value of γ increases for x = 0.1 and then decreases for x = 0.2. This behaviour can be explained by the Ag-doping which has a strongly influence the structural and thermomagnetic properties of the system. The intrinsic Ag agent enhances the grain size, Mn4+/Mn3+ ratio, and causes a nonlinear variation in Mn–O–Mn bond angle and electronic bandwidth W. Therefore, the presence of a maximum in 〈Mn–O–Mn〉 and W for x = 0.1 has remarkable consequence on the γ exponent which exhibits a non-monotonic variation with Ag-doping.
In order to demonstrate the influence of critical exponent on a magnetocaloric effect for a material displaying a second order phase transition, the field dependence of entropy change is analyzed. The field dependence of the peak magnetic entropy change shows a power law
| ΔSM ∞ Hn | (9) |
 | (10) |
In the particular case of T = TC or at the temperature of the peak entropy change, the exponent n becomes field independent:54
 | (11) |
 | (12) |
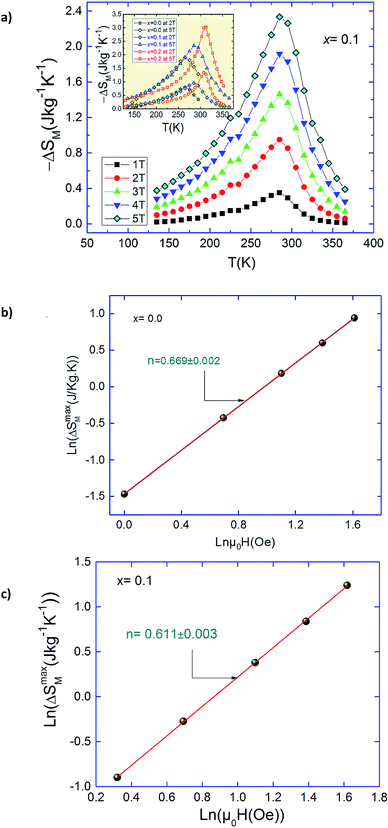
Fig. 9a presents the temperature dependence of magnetic entropy change ΔSM calculated using the integrated Maxwell relation for x = 0.1. The inset of Fig. 9a depicts ΔSM(T) for the three samples near its Curie temperatures under 2 and 5T. Fig. 9b and c shows the plot of ln(ΔSmaxM) vs. ln(H) at TC in relation with eqn (9). The values of n extracted from the linear fit of the above plot are n = 0.669, 0.611 and 0.572 for x = 0.0, 0.1 and 0.2 respectively. Let us recall that the value of n obtained from the KF method are about n = 0.66, 0.62 and 0.57 for x = 0, 0.1 and 0.2 respectively. The nearly equal values obtained from the two methods suggest unambiguously that the obtained coupled values of order parameters are reliable. The obtained values of the local exponent n give further insight into the critical behaviour in our samples and the obtained result confirms the presence of the local inhomogeneities in our investigated materials, causing a distribution of Curie temperatures. The mean field approach on the field dependence of the magnetic entropy change at TC yields a prediction of n = 2/3. One can see that the obtained n values presents a small deviation from 2/3 in the exponents. The little difference is ascribed to short-range order related to magnetic disorder and FM clusters existed in the vicinity of a transition temperature.55,56 Thus, there are two possible reasons for turning the magnetic interaction from the long-range to the short-range. One is the large spin fluctuation, and the other is the distinct disorder effect. The latter effects are very sensitive to doping element, sintering temperature and preparation method and their changes affect the critical behavior. Several works show that the reduction of grain size and elaborating method strongly influence the universality class.51,57 Consequently, the size reduction in system causes a transition phase from a long-range to a short-range order. This observation can be explained by creating some defects at the grain boundaries when the grain size is reduced and the larger surface effects observed in our nano-sized Ag-doped manganites prepared by sol–gel route. Moreover, according to the Harris criterion,58 in a second-order phase transition system, if the critical exponent a is positive, the disorder can affect the universality class of the system (as in our case).59
According to the renormalization group theory analyses, the universality class for a homogeneous magnet depends on the range of exchange interaction J(r). Fisher and co-workers42 suggest J(r) = 1/rd+σ where d is the dimension of the system and σ is the range of exchange interaction. For a three dimension, isotropic system (d = 3), the 3D-Heisenberg model (β = 0.365, γ = 1.386 and δ = 4.797) works only if σ ≥ 2, i.e., if J(r) decreases with “short-range” distance faster than r−5. Whereas if σ ≤ 3/2 it complies with the mean-field model (β = 0.5, γ = 1.0 and δ = 3.0), which indicates J(r) decreases with “long-range” distance slower than r−4.5. In the intermediate range 3/2 ≤ σ ≤ 2, J(r) decays as ∼r−(3+σ), the system belongs to different classes with exponents taking intermediate values depending on σ value which is the case taking place in our compound for x = 0.2.
In order to understand the variation of critical exponents with reduced temperature ε, we can determine the effective exponents βeff and γeff, as per the following relations:
 | (13) |
 | (14) |
Fig. 10a and b shows nonmonotonic changes of the effective exponents βeff and γeff as a function of ε are plotted for Pr0.5Sr0.3Ag0.2MnO3 sample. We conclude from this result that βeff(ε) and γeff(ε) do not match with any predicted universality class, even in the asymptotic region. Similar phenomenon was found in the pristine compound,36 which is considered as characteristic features of a disordered magnet. The magnetic disorder here may result from inhomogeneous magnetic state both below and above TC and random distribution of Pr3+, Sr2+ and Ag+ cations with different sizes. However, the critical exponents for a homogeneous ferromagnetic material should be independent of the microscopic details of the system due to the divergence of correlation length in the vicinity of the transition point.60 Hence, the critical exponents obtained in Pr0.5Sr0.5−xAgxMnO3 and the nonmonotonic changes are intrinsic to the system.
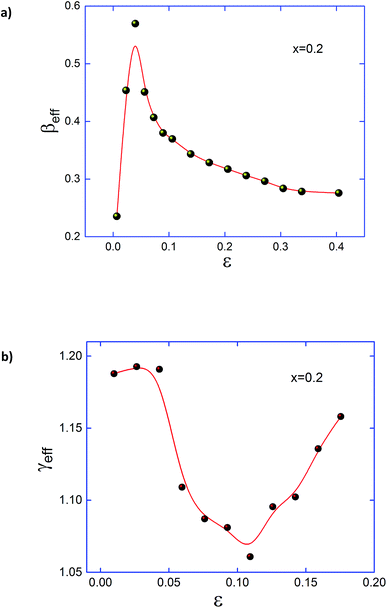 | ||
| Fig. 10 Effective exponents (a) βeff below TC and (b) γeff above TC are plotted as a function of reduced temperature ε = (T − TC)/TC for Pr0.5Sr0.3 Ag0.2MnO3. | ||
Based on the Harris criterion,58 if the critical exponent αpure > 0, the disorder changes the critical exponents and causes subsequently a crossover to critical behaviour governed by a new random fixed point. While, if the exponent αpure < 0, the disorder is irrelevant. Using the Rushbrooke scaling relation expressed as: α + 2β + γ = 2, the exponent αpure is found to be positive only for x = 0.2 (αpure ≈ 0.1), which implies that the disorder is pertinent. This fact explains the obtained values of critical exponents for Pr0.5Sr0.3Ag0.2MnO3.
This investigation shows that the Pr0.5Sr0.5−xAgxMnO3 systems does not belong to a single universality class and the critical behavior is sensitive to the Ag-substitution. Comparing with other Pr-based manganites, the obtained results support evidence of the competition between the short-and long-range ferromagnetic orders. Like results were also observed in Pr0.15Ca0.85Mn0.96Ru0.04O3 (β = 0.478 and γ = 1.252),61 Pr0.55Sr0.45MnO3 (β = 0.462 and γ = 1.033),46 Pr0.52Sr0.48MnO3 (β = 0.462 and γ = 1.210),47 and so forth (see Table 1). Earlier study62 found both narrow-band width Pr-based manganites having the critical exponents close to those expected for the 3D Heisenberg model. Their short-range ferromagnetic interactions are attributed to Ca2+ rich regions and established that the Pr0.7Ca0.3MnO3 sample cannot be fitted to the modified Arrott plots due to highly inhomogeneous ground state.63 These results show that the critical behavior of Pr1−xCaxMnO3 is very sensitive to the amount of calcium which converted the Mn3+ ion to the Mn4+ ions and modified the Mn–O–Mn networks in this family of materials. It was also suggested that A-site ionic size mismatch may cause a glass-like disorder state, leading to a highly magnetic inhomogeneity.62 Recently, Ulyanov and co-workers64 have used the electron-spin-resonance spectroscopy for studying praseodymium manganites and found FM and anti-FM interactions associated with both ion types (Pr3+ and Mn3+,4+) persist in it throughout the temperature range, even above critical temperature. For both wide- and narrow-bandwidth manganites, several investigations of resonant signals (related to the decrease of resonant intensity, the broadening of linewidth, and temperature dependences of the resonant field) in the paramagnetic region show the presence of FM clusters, spin–phonon and/or spin–orbit interactions.64,65 These factors may be present in our Pr0.5Sr0.5−xAgxMnO3, which lead to the magnetic inhomogeneity, and thus influence the critical parameters. It is necessary to emphasize that crystalline characteristics (such as the single crystal and poly-crystalline) also play a significant role affecting the critical behaviour.66 Polycrystalline samples with a lower degree of crystalline order normally have a higher magnetic inhomogeneity (due to grain boundaries and isotropic properties), which is absent in single crystals.62 Accordingly, magnetic interactions in polycrystalline samples do not completely obey any theoretical model. They are usually mixed by the long-range (corresponding to the MFT) and short-range FM interactions, (corresponding to 3D-Heisenberg and Ising models) and they not belong to a single universality class as in our case.
The scaling of ΔS(T) curves in the vicinity of a second-order phase transition has been theoretically grounded and experimentally confirmed in a variety of magnetic systems.13,15,23 In order to continue our investigation in the Pr0.5Sr0.5−xAgxMnO3 system13 and to check the validity of our obtained critical exponents we have using the relation between the critical exponents and the scaled equation of state67,68 defined as:  , the obtained ΔS(T) can be written69
 | (15) |
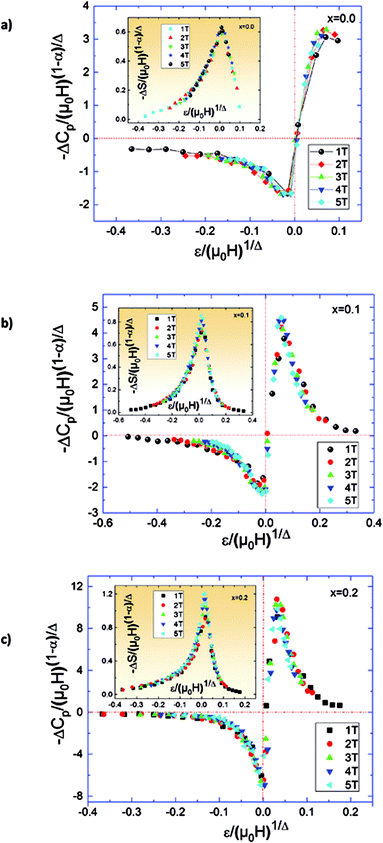 | ||
| Fig. 11 Scaled magnetic entropy changes and heat capacity changes versus scaled temperature using critical exponent. | ||
The specific heat changes ΔCP (not presented here) caused by the applied magnetic field can be calculated from the ΔSM entropy change by the following relation:
 | (16) |
The ΔCP for our materials also collapse onto a master curve using the obtained critical exponents. The scaling procedure is a result of the scaling hypothesis for magnetic systems in the critical region. The scaling of ΔCP(H,T) as depicted in Fig. 11 shows that  . The excellent overlap of the data points clearly indicates that the obtained values of Curie temperature TC, β and γ and for these compounds are in accordance with the scaling hypothesis at several μ0H. The investigation of scaling hypotheses of the thermomagnetic behaviours of Pr0.5Sr0.5−xAgxMnO3 (0.0 ≤ x ≤ 0.2) system gives the possibility of several practical functionality of the universal curve in the characterization of new compounds: as a simple screening process of the performance of samples, as a method for making extrapolations to magnetic fields or temperatures not accessible in the experimental machines, for correcting the influence of non-saturating conditions, for the decrease of the experimental noise, or as a method to eliminate the contribution of minority magnetic phases.
4. Conclusion
We studied the critical behaviour of Pr0.5Sr0.5−xAgxMnO3 (0.0 ≤ x ≤ 0.2) nanocrystalline samples around their TC values at the PM–FM phase transition. The transition is identified to be second order. The reliable critical exponents β, γ and δ estimated from various techniques such as modified Arrott plot, Kouvel–Fisher method and critical isotherm analysis fit with 3D-Heisenberg for samples (x = 0.00 and 0.1) and 3D-Ising for the sample with (x = 0.2). The validity of the calculated critical exponents was confirmed using the scaling equation of state. We demonstrate that the critical behaviour of Pr0.5Sr0.5−xAgxMnO3 is very sensitive to the Ag-doping concentration, which affects both the rate of Mn3+/Mn4+ conversion and average radius of the A-site cations.Conflicts of interest
There are no conflicts to declare.References
- A. Biswas, T. Samanta, S. Banerjee and I. Das, Influence of charge ordering on magnetocaloric properties of nanocrystalline Pr0.65(Ca0.7Sr0.3)0.35MnO3, Appl. Phys. Lett., 2008, 92, 212502 CrossRef.
- S. Gupta, R. Ranjit, C. Mitra, P. Raychaudhuri and R. Pinto, Enhanced room-temperature magnetoresistance in La0.7Sr0.3MnO3-glass composites, Appl. Phys. Lett., 2001, 78, 362 CrossRef.
- S. Choura Maatar, R. M'nassri, W. Cheikhrouhou Koubaa, M. Koubaa and A. Cheikhrouhou, Structural, magnetic and magnetocaloric properties of La0.8Ca0.2-xNaxMnO3 manganites (0 ≤ x ≤ 0.2), J. Solid State Chem., 2015, 225, 83 CrossRef.
- A. Selmi, R. M'nassri, W. Cheikhrouhou-Koubaa, N. Chniba Boudjada and A. Cheikhrouhou, Influence of transition metal doping (Fe, Co, Ni and Cr) on magnetic and magnetocaloric properties of Pr0.7Ca0.3MnO3 manganites, Ceram. Int., 2015, 41, 10177 CrossRef.
- R. M'nassri, W. Cheikhrouhou-Koubaa, N. Boudjada and A. Cheikhrouhou, Magnetocaloric Effects in Pr0.6−xErxSr0.4MnO3 (0.0≤x≤0.2) Manganese Oxides, J. Supercond. Novel Magn., 2013, 26, 1429 CrossRef.
- H. Mbarek, R. M'nasri, W. Cheikhrouhou-Koubaa and A. Cheikhrouhou, Magnetocaloric effect near room temperature in (1−y)La0.8Ca0.05K0.15MnO3/yLa0.8K0.2MnO3 composites, Phys. Status Solidi A, 2014, 211, 975 CrossRef.
- C. N. R. Rao and B. Raveau, Magnetoresistance, Charge Ordering and Related Properties of Manganese Oxide, World Scientific, Singapore, 1998 Search PubMed.
- C. Zener, Interaction between the d-Shells in the Transition Metals, Phys. Rev., 1951, 82, 403 CrossRef.
- C. N. R. Rao and G. V. Subba Rao, Electrical conduction in metal oxides, Phys. Status Solidi A, 1970, 1, 597 CrossRef.
- D. B. Meadowcroft, Low-cost Oxygen Electrode Material, Nature, 1970, 226, 847 CrossRef PubMed.
- L. P. Gor'kov and V. Z. Kresin, Mixed-valence manganites: fundamentals and main properties, Phys. Rep., 2004, 400, 149–208 CrossRef.
- R. H. Heffner, L. P. Le, M. F. Hundley, J. J. Neumeier, G. M. Luke, K. Kojima, B. Nachumi, Y. J. Uemura, D. E. MacLaughlin and S. W. Cheong, Phys. Rev. Lett., 1996, 77(9), 1869–1872 CrossRef PubMed.
- S. Tarhouni, A. Mleiki, I. Chaaba, H. Ben Khelifa, W. Cheikhrouhou-Koubaa, M. Koubaa, A. Cheikhrouhou and E. K. Hlil, Structural, magnetic and magnetocaloric properties of Ag-doped Pr0.5Sr0.5−xAgxMnO3 manganite (0.0 ≤ x ≤ 0.4), Ceram. Int., 2017, 34, 133–143 CrossRef.
- R. M'nassri, N. ChnibaBoudjada and A. Cheikhrouhou, Impact of sintering temperature on the magnetic and magnetocaloric properties in Pr0.5Eu0.1Sr0.4MnO3 manganites, J. Alloys Compd., 2015, 626, 20 CrossRef.
- R. M'nassri, N. Chniba Boudjada and A. Cheikhrouhou, 3D-Ising ferromagnetic characteristics and magnetocaloric study in Pr0.4Eu0.2Sr0.4MnO3 manganite, J. Alloys Compd., 2015, 640, 183 CrossRef.
- H. E. Stanley, Introduction to Phase Transitions and Critical Phenomena, Oxford University Press, London, 1971 Search PubMed.
- N. Khan, A. Midya, K. Mydeen, P. Mandal, A. Loidl and D. Prabhakaran, Critical behavior in single-crystalline La0.67Sr0.33CoO3, Phys. Rev. B: Condens. Matter Mater. Phys., 2010, 82, 064422 CrossRef.
- D. Kim, B. Revaz, B. L. Zink, F. Hellman, J. J. Rhyne and J. F. Mitchell, Tricritical Point and the Doping Dependence of the Order of the Ferromagnetic Phase Transition of La1−xCaxMnO3, Phys. Rev. Lett., 2002, 89, 227202 CrossRef PubMed.
- S. Mahjoub, M. Baazaoui, R. M'nassri, N. C. Boudjada and M. Oumezzine, Critical behavior and the universal curve for magnetocaloric effect in Pr0.6Ca0.1Sr0.3Mn1−xFexO3 (x= 0, 0.05 and 0.075) manganites, J. Alloys Compd., 2015, 633, 207–215 CrossRef.
- A. Mleiki, S. Othmani, W. Cheikhrouhou-Koubaa, M. Koubaa, A. Cheikhrouhou and E. K. Hlil, Critical behavior near the ferromagnetic-paramagnetic phase transition in Sm0.55-xPrxSr0.45MnO3 compounds (0.3 ≤ x ≤ 0.4), J. Alloys Compd., 2015, 648, 1043 CrossRef.
- N. Kaul, Static critical phenomena in ferromagnets with quenched disorder, J. Magn. Magn. Mater., 1985, 53, 5 CrossRef.
- V. Franco, A. Conde, D. Sidhaye, B. L. V. Prasad, P. Poddar, S. Srinath, M. H. Phan and H. Srikanth, J. Appl. Phys., 2010, 107, 09A902 CrossRef.
- V. Franco and A. Conde, Int. J. Refrig., 2010, 33, 465 CrossRef.
- R. M'nassri, J. Supercond. Novel Magn., 2014, 27, 1787 CrossRef.
- R. M'nassri, Magnetocaloric effect and its implementation in critical behaviour study of La0.67Ca0.33Mn0.9Fe0.1O3, Bull. Mater. Sci., 2016, 39, 551 CrossRef.
- A. Selmi, R. M'nassri, W. Cheikhrouhou-Koubaa and N. Chniba Boudjada, A.Cheikhrouhou, Effects of partial Mn-substitution on magnetic and magnetocaloric properties in Pr0.7Ca0.3Mn0.95X0.05O3 (Cr, Ni, Co and Fe) manganites, J. Alloys Compd., 2015, 619, 627 CrossRef.
- A. Bettaibi, R. M'nassri, A. Selmi, H. Rahmouni, N. Chniba-Boudjada, A. Chiekhrouhou and K. Khirouni, Effect of chromium concentration on the structural, magnetic and electrical properties of praseodymium-calcium manganite, J. Alloys Compd., 2015, 650, 268 CrossRef.
- A. Selmi, R. M'nassri, W. Cheikhrouhou-Koubaa, N. Chniba Boudjada and A. Cheikhrouhou, The effect of Co doping on the magnetic and magnetocaloric properties of Pr0.7Ca0.3Mn1−xCoxO3 manganites, Ceram. Int., 2015, 41, 7723 CrossRef.
- A. Sakka, R. M'nassri, N. Chniba-Boudjada, M. Ommezzine and A. Cheikhrouhou, Effect of trivalent rare earth doping on magnetic and magnetocaloric properties of Pr0.5(Ce, Eu, Y)0.1Sr0.4MnO3 manganites, Appl. Phys. A, 2016, 122, 603 CrossRef.
- H. Li, X. Liu and L. Huang, Synthesis of lutetium aluminum garnet powders by nitrate–citrate sol–gel combustion process, Ceram. Int., 2007, 33, 1141–1143 CrossRef.
- H. M. Rietveld, A profile refinement method for nuclear and magnetic structures, J. Appl. Crystallogr., 1969, 2, 65 CrossRef.
- S. K. Banerjee, On a generalised approach to first and second order magnetic transitions, Phys. Lett., 1964, 12, 16 CrossRef.
- T. L. Phan, P. Q. Thanh, N. H. Sinh, K. W. Lee and S. C. Yu, Critical behavior and magnetic entropy change in La0.7Ca0.3Mn0.9Zn0.1O3 perovskite manganite, Curr. Appl. Phys., 2011, 11, 830 CrossRef.
- A. Arrott and J. E. Noakes, Phys. Rev. Lett., 1967, 19, 786 CrossRef.
- M. E. Fisher, The theory of equilibrium critical phenomena, Rep. Prog. Phys., 1967, 30, 615 Search PubMed.
- A. K. Pramanik and A. Banerjee, Critical behavior at paramagnetic to ferromagnetic phase transition in Pr0.5Sr0.5MnO3: A bulk magnetization study, Phys. Rev. B: Condens. Matter Mater. Phys., 2009, 79, 214426 CrossRef.
- L. M. Rodriguez-Martinez and J. P. Attfield, Cation disorder and size effects in magnetoresistive manganese oxide perovskites, Phys. Rev. B: Condens. Matter Mater. Phys., 1996, 54(R1), 5622 Search PubMed.
- J. Fan, L. Ling, B. Hong, L. Zhang, L. Pi and Y. Zhang, Critical properties of the perovskite manganite La0.1Nd0.6Sr0.3MnO3, Phys. Rev. B: Condens. Matter Mater. Phys., 2010, 81, 144426 CrossRef.
- K. Huang, Statistical Mechanics, Wiley, New York, 1987, 2nd edn, ch. 17.6, p. 432 Search PubMed.
- J. S. Kouvel and M. E. Fisher, Detailed magnetic behavior of nickel near its Curie point, Phys. Rev., 1964, 136, A1626 CrossRef.
- B. Widom, Equation of state in the neighborhood of the critical point, J. Chem. Phys., 1965, 43, 3898 CrossRef.
- M. E. Fisher, S. K. Ma and B. G. Nickel, Critical exponents for long-range interactions, Phys. Rev. Lett., 1972, 29, 917 CrossRef.
- N. Khan, P. Mandal, K. Mydeen and D. Prabhakaran, Magnetoelectronic phase separation in La1−xSrxCoO3 single crystals: evidence from critical behavior, Phys. Rev. B: Condens. Matter Mater. Phys., 2012, 85, 214419 CrossRef.
- H. S. Shin, J. E. Lee, Y. S. Nam, H. L. Ju and C. W. Park, First-order-like magnetic transition in manganite oxide La0.7Ca0.3MnO3, Solid State Commun., 2001, 118, 377 CrossRef.
- J. Fan, L. Pi, L. Zhang, W. Tong and L. Ling, Investigation of critical behavior in Pr0.55Sr0.45MnO3 by using the field dependence of magnetic entropy change, Appl. Phys. Lett., 2011, 98, 072508 CrossRef.
- S. Roesler, H. S. Nair, U. K. Roesler, C. M. N. Kumar, S. Elizabeth and S. Wirth, Ferromagnetic transition and specific heat of Pr0.6Sr0.4MnO3, Phys. Rev. B: Condens. Matter Mater. Phys., 2011, 84, 184422 CrossRef.
- S. Sabyasachi, A. Bhattacharyya, S. Majumdar, S. Giri and T. Chatterji, Critical phenomena in Pr0.52Sr0.48MnO3 single crystal, J. Alloys Compd., 2013, 577, 165 CrossRef.
- M. Khlifi, A. Tozri, M. Bejar, E. Dhahri and E. K. Hlil, Effect of calcium deficiency on the critical behavior near the paramagnetic to ferromagnetic phase transition temperature in La0.8Ca0.2MnO3 oxides, J. Magn. Magn. Mater., 2012, 324, 2142 CrossRef.
- S. Srinath, S. N. Kaul and M.-K. Sostarich, Isotropic-Heisenberg to isotropic-dipolar crossover in amorphous ferromagnets with composition near the percolation threshold, Phys. Rev. B: Condens. Matter Mater. Phys., 2000, 62, 11649 CrossRef.
- J. Fan, L. Ling, B. Hong, L. Zhang, L. Pi and Y. Zhang, Critical properties of the perovskite manganite La0.1Nd0.6Sr0.3MnO3, Phys. Rev. B: Condens. Matter Mater. Phys., 2010, 81, 144426 CrossRef.
- T. D. Thanh, Y. YiKyung, T. A. Ho, T. V. Manh, T. L. Phan, D. M. Tartakovsky and S. C. Yu, Critical behavior in double-exchange ferromagnets of Pr0.6Sr0.4MnO3 nanoparticles, IEEE Trans. Magn., 2015, 51, 1–4 Search PubMed.
- K. Dhahri, N. Dhahri, J. Dhahri, K. Taibi and E. K. Hlil, Critical phenomena and estimation of the spontaneous magnetization from a mean field analysis of the magnetic entropy change in La0.7Ca0.1Pb0.2Mn0.95Al0.025Sn0.025O3, RSC Adv., 2018, 8(6), 3099–3107 RSC.
- C. Zener, Interaction between the d-shells in the transition metals. II. Ferromagnetic compounds of manganese with perovskite structure, Phys. Rev., 1951, 82, 403 CrossRef.
- V. Franco, A. Conde, M. D. Kuz'min and J. M. Romero Enrique, The magnetocaloric effect in materials with a second order phase transition: are TC and Tpeak necessarily coincident, J. Appl. Phys., 2009, 105, 07A91 CrossRef.
- V. Franco, J. S. Blazquez and A. Conde, The influence of Co addition on the magnetocaloric effect of Nanoperm-type amorphous alloys, Appl. Phys. Lett., 2006, 100, 064307 Search PubMed.
- F. Saadaoui, R. M'nassri, H. Omrani, M. Koubaa, N. Chniba Boudjada and A. Cheikhrouhou, Critical behavior and magnetocaloric study in La0.6Sr0.4CoO3 cobaltite prepared by a sol–gel process, RSC Adv., 2016, 6, 50968 RSC.
- A. Ezaami, I. Sfifir, W. Cheikhrouhou-Koubaa, M. Koubaa and A. Cheikhrouhou, “Critical properties in La0.7Ca0.2Sr0.1MnO3 manganite: a comparison between sol-gel and solid state process”, J. Alloys Compd., 2017, 693, 658–666 CrossRef.
- A. B. Harris, Effect of random defects on the critical behaviour of Ising models, J. Phys. C: Solid State Phys., 1974, 7, 1671 CrossRef.
- A. Mleiki, R. M'nassri, W. Cheikhrouhou-Koubaa, A. Cheikhrouhou and E. K. Hlil, Structural characterization, magnetic, magnetocaloric properties and critical behavior in lacunar La0. 5Eu0.2Ba0. 2□0.1MnO3 nanoparticles, J. Alloys Compd., 2017, 727, 1203–1212 CrossRef.
- J. Mira, J. Rivas, M. Vazquez, J. M. Garcia-Beneytez, J. Arcas, R. D. Sanchez and M. A. Senaris-Rodriguez, Critical exponents of the ferromagnetic-paramagnetic phase transition of La1−xSrxCoO3 (0.20 ≤ x ≤ 0.30), Phys. Rev. B: Condens. Matter Mater. Phys., 1999, 59, 123 CrossRef.
- T. L. Phan, Y. D. Zhang, S. C. Yu, P. Q. Y. Thanh and P. D. H. Yen, J. Korean Phys. Soc., 2012, 61, 1568 CrossRef.
- W. J. Jiang, X. Z. Zhou, G. Williams, Y. Mukovskii and K. Glazyrin, Phys. Rev. B: Condens. Matter Mater. Phys., 2008, 78, 144409 CrossRef.
- S. Taran, B. K. Chaudhuri, S. Chatterjee, H. D. Yang, S. Neeleshwar and Y. Y. Chen, J. Appl. Phys., 2005, 98, 103903 CrossRef.
- A. N. Ulyanov, H. D. Quang, N. E. Pismenova, S. C. Yu and G. G. Levchenko, Solid State Commun., 2012, 152, 1556 CrossRef.
- A. N. Ulyanov, H. D. Quang, N. E. Pismenova and S. C. Yu, IEEE Trans. Magn., 2005, 41, 2745 CrossRef.
- T. L. Phan, Y. D. Zhang, P. Zhang, T. D. Thanh and S. C. Yu, J. Appl. Phys., 2012, 112, 093906 CrossRef.
- B. Widom, J. Chem. Phys., 1965, 43, 3898 CrossRef.
- R. B. Griffiths, Phys. Rev., 1967, 158, 176 CrossRef.
- V. Franco, J. S. Blázquez and A. Conde, J. Appl. Phys., 2008, 103, 07B316 CrossRef.
- A. Hankey and H. E. Stanley, Phys. Rev. B: Condens. Matter, 1972, 6, 3515 CrossRef.
- H. Ben Khlifa, R. M'nassri, S. Tarhouni, Y. Regaieg, W. Cheikhrouhou-Koubaa, N. Chniba-Boudjada and A. Cheikhrouhou, Critical behaviour and filed dependence of magnetic entropy change in K-doped manganites Pr0.8Na0.2−xKxMnO3 (x= 0.10 and 0.15), J. Solid State Chem., 2018, 257, 9–18 CrossRef.
| This journal is © The Royal Society of Chemistry 2018 |

