 Open Access Article
Creative Commons Attribution 3.0 Unported Licence
Investigation of water transport in fuel cells using water transport plates and solid plates
Zhiqiang Wangab,
Lijuan Quab,
Yachao Zengab,
Xiaoqian Guoa,
Zhigang Shao *a and
Baolian Yia
aFuel Cell System and Engineering Group, Dalian Institute of Chemical Physics, Chinese Academy of Sciences, 457 Zhongshan Road, 116023 Dalian, PR China. E-mail: zhgshao@dicp.ac.cn; Fax: +86 411 84379185; Tel: +86 411 84379153
bUniversity of Chinese Academy of Sciences, 19A Yuquan Road, 100049 Beijing, PR China
First published on 4th January 2018
Abstract
Water management of proton exchange membrane fuel cells (PEMFCs) is of vital importance to achieve better performance and durability. In this study, porous hydrophilic water transport plates (WTPs) with different pore structures were prepared and employed to improve water management in PEMFCs. Polarization curves, electrochemical impedance spectroscopy (EIS) and water balance were tested to investigate the effect of pore structure on cell performance and water transport process. The results show that pore structure has little effect on drainage function due to excess liquid water flux of WTPs, while the membrane hydration is improved with increased surface evaporation rate of WTPs, resulting in better cell performance. The favorable cell performance shows that WTP is a promising technique to improve water management in PEMFCs.
1. Introduction
Proton exchange membrane fuel cells (PEMFCs) have attracted much interest due to their potential applications in portable power, vehicle power supplies and power stations.1–3 One of the critical issues associated with performance and durability is water management.4,5 Perfluorosulfonic acid (PFSA) membranes (e.g., Nafion membrane) have been widely used in a commercial PEMFC, the water content of the PFSA membrane has a significant influence on cell performance and durability. Sufficient water is necessary for the membrane to obtain enough ionic conductivity. Meanwhile, excess liquid water should be timely removed in case of flooding in porous media such as the gas diffusion layer (GDL) and catalyst layer (CL).6–8 The balance between membrane dehydration and electrode flooding must be guaranteed in PEMFCs.Various approaches have been proposed to improve water management in PEMFCs, including external humidifier,9,10 internal humidifier,11,12 self-humidification,13–15 dynamic drainage16,17 and so on. Another promising technique is water transport plate (WTP), which is firstly proposed by AT 389020 (ref. 18). The WTP in the patent is a porous plate serving as bipolar plate and WTP can humidify inlet gas without external humidifier. Afterwards, United Technologies Corporation Power (UTC Power) improved WTP technology, which can not only humidify inlet gas streams to ensure enough ionic conductivity of membrane but also remove liquid water to avoid electrode flooding.19–22 Compared to other water management strategies, WTPs can simultaneously balance membrane dehydration and water flooding. The Puremotion Model 120 Fuel Cell Power System with WTPs has been applied in vehicles and achieved over 25![[thin space (1/6-em)]](https://www.rsc.org/images/entities/char_2009.gif) 000 h of operation without a fuel cell failure, which enlightens the great potential of WTP technology to improve performance and durability of PEMFCs.23,24
000 h of operation without a fuel cell failure, which enlightens the great potential of WTP technology to improve performance and durability of PEMFCs.23,24
Shawn et al.25 compared cell performance of traditional solid plate (SP) and porous carbon plate under dry feeds condition. The performance and stability of fuel cell were significantly improved after applying porous plate, especially under lower stoichiometry. Wang et al.26,27 studied water and heat transfer through WTP, which aimed at improving water and heat management in fuel cell stacks. Guo et al.28,29 investigated the effects of the WTPs properties on the cell performance and stability. Weber et al.22 developed a one dimensional model to simulate the fuel cells with WTPs and SPs, the differences of water distribution were discussed. Previous research showed the great advantages of WTPs, but water transport in fuel cell with WTP was not fully understood.
In this study, WTPs with different pore structure were prepared and employed in PEMFCs. Water transport process was investigated by water balance tests. Furthermore, the effects of WTPs' pore structure on cell performance and water transport were discussed in detail.
2. Experimental
2.1. Preparation of WTPs and SP
In order to investigate effects of pore structure on water transport in the fuel cell, WTPs with three different pore structure, which were marked as WTP-1, WTP-2 and WTP-3, were prepared while the SP served as baseline. First, the WTPs and SP (Bought from Shanghai Hongfeng Co, Ltd.) were machined into required shape by computer numerical control (CNC) machine. To improve the hydrophilicity of porous plates, WTPs were treated by impregnation method.30 The WTPs were vacuum impregnated in the titanium dioxide (TiO2) sol solution prepared by sol–gel method until no bubble was observed in solution. Then the samples were taken out and heated in the air at 400 °C for 2 h.2.2. Characterization of WTPs and SP
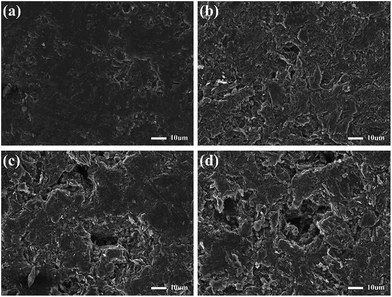
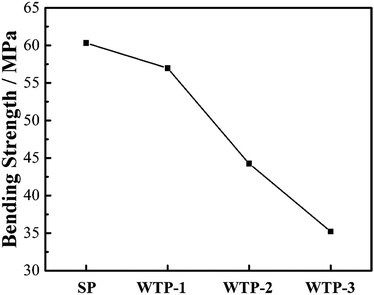
To investigate the effect of pore structure on physical properties, various physical characterizations of WTPs and SP were tested. Scanning electron microscopy (SEM, JSM-IT300) was conducted to investigate the pore structure of the samples. The pore size, porosity and tortuosity of the WTPs were measured by mercury intrusion porosimetry (PoreMasterGT 60). The in-plane electronic conductivity was measured by a four-point probe detector (Suzhou Jingge Electronic Co, Ltd. ST-2258A). The interfacial contact resistance (ICR) was tested by a universal testing machine (Changchun Kexin Test Instrument Co, Ltd. WDW-1010) at a clamping pressure of 1.5 MPa. To characterize the wettability between samples and water, the contact angle test was conducted on a drop shape analyzer (KRUSS, DSA 100) by a sessile drop method. The three-point bending test was carried out by the same universal testing machine according to GB/T 13465.2-2014.31 The flexure strength can be calculated by equation eqn (1).
 | (1) |
In addition, WTPs should separate hydrogen and oxygen while transfer water at the same time. Bubble pressure measurement was carried out on a home-made apparatus29 to investigate gas-blocking property of WTPs. To ex-situ characterize the humidification and drainage capability of WTPs, liquid water flux and vapor water surface evaporation rate were measured by a test apparatus similar to a fuel cell, as shown in Fig. 1. The test parameters simulate the operating conditions of PEMFC. The WTPs were machined with flow field and sealed into the apparatus with an efficient area of 50 cm2. The temperature of the system was kept at 60 °C by circulating water. When liquid water flux was evaluated, the water chamber was given a certain pressure while the gas chamber was exposed to the ambient air. The water can permeate through WTP. The liquid level change of pipette connecting with water chamber could be recorded and the liquid water flux could be calculated. When surface evaporation rate was measured, the absolute pressure of water chamber was 0.13 MPa while the gas chamber was 0.15 MPa. The flow rate of dry air in gas chamber was fixed. The water can evaporate on the surface of WTP to humidify unsaturated gas. The calculation method of surface evaporation rate was similar to the one of liquid water flux.
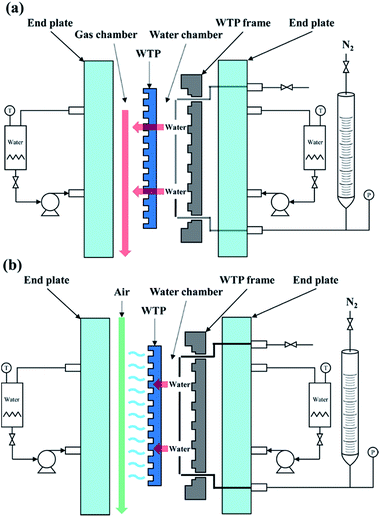 | ||
| Fig. 1 Schematic diagram of (a) liquid water flux test apparatus and (b) surface evaporation rate test apparatus. | ||
2.3. Single cell test
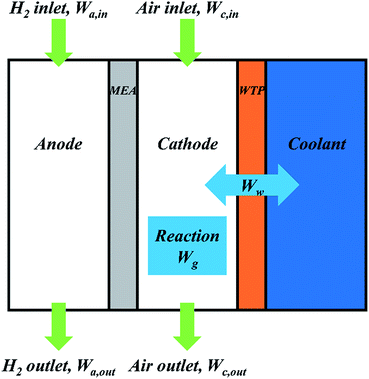
Single fuel cell test with SP and WTPs were conducted to investigate the effects of pore structure on cell performance and water transport process. Catalyst coated membrane (CCM) was prepared by spraying Pt/C (70 wt%, Johnson Matthey) onto Nafion® 211 membrane (Dupont) with Pt loading of 0.2 mg cm−2 at anode and 0.4 mg cm−2 at cathode. Afterwards, membrane electrode assembly (MEA) with 50 cm2 active area was prepared by sandwiching the CCM between two gas diffusion layers (GDLs). A special single cell was designed to evaluate the humidification and drainage function of WTPs.32 Parallel gas flow field was machined on both anode and cathode side with the following dimensions: channel width of 1 mm, rib width of 1 mm and channel depth of 0.4 mm. The gas flow rates were switched with fixed stoichiometry, which is 2.0 for hydrogen and 3.0 for air. The absolute pressure of the gas chamber was 0.15 MPa while that of coolant chamber was 0.13 MPa. Cell temperature was 60 °C. The operating conditions were outlined if there is no special description.Fuel Cell Test System (Scribner, 850E) was used for evaluating single fuel cell performance. All the polarization curves were recorded after 8 h's activation at 1000 mA cm−2. The data was recorded every 50 mA cm−2 and each point was remained for 30 seconds. The fuel cell was conditioned at 1000 mA cm−2 for at least 30 minutes to reach a steady state before the measurement of electrochemical impedance spectroscopy (EIS). Then EIS was measured with a frequency range of 10 kHz to 0.1 Hz and 10% amplitude of current. Cyclic voltammogram was taken to obtain the electrochemical surface areas (ECSAs) of cathode catalyst layer. The hydrogen and nitrogen were provided at flow rates of 0.3 L min−1. The potential was swept from 0.08 V to 1.20 V (vs. RHE) at a scan rate of 50 mV s−1. Afterwards, ECSAs were calculated from the areas of hydrogen desorption peak. In order to in situ study water transport inside fuel cell, water balance was tested. The fuel cell was conditioned at 1000 mA cm−2 to reach a steady state before the test. Desiccator was added respectively at anode outlet and cathode outlet to collect water in gas chamber. A pipette was used to display water change in water chamber. Fig. 2 shows schematic diagram of water transport process in a PEMFC. According to the conservation of mass, the following equation should be established.
| Wa,in + Wc,in + Wg = Wa,out + Wc,out + Ww | (2) |
 | (3) |
In addition, the water input amount, Win, the water output amount, Wout and experimental error can be defined by the following equations.
| Win = Wa,in + Wc,in | (4) |
| Wout = Wa,out + Wc,out + Ww | (5) |
 | (6) |
3. Results and discussion
3.1. Characterization of SP and WTPs
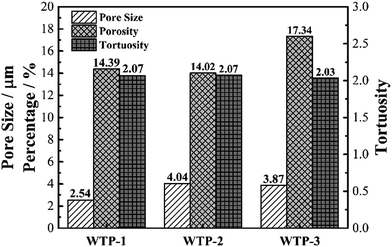 | ||
| Fig. 3 Mean pore size, porosity and tortuosity of water transport plates with different pore structure. | ||
| Samples | Bubble pressure/MPa |
|---|---|
| SP | — |
| WTP-1 | 0.17 |
| WTP-2 | 0.11 |
| WTP-3 | 0.08 |
According to Young's equation, the capillary pressure of WTP is inversely proportional to the characteristic pore size, which means bubble pressure decreased with an increase in maximum pore size. However, the actual bubble pressure of WTPs in fuel cell is lower than the measured value. This is mainly due to flow fields and higher temperature. In single cell tests, WTP-3 could lead to gas crossover when the pressure differential between cathode chamber and coolant chamber is 0.04 MPa. The poor gas-blocking capability of WTP-3 will lower the reliability and stability of fuel cell, which is not recommended in real application.
The water permeability process is determined by Darcy's law:
 | (7) |
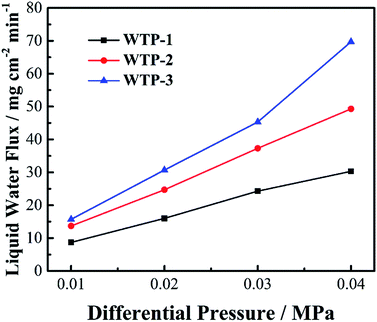
According to eqn (7), the liquid water flux is proportional to k and ΔP. The water permeability, k, is determined by pore structure of the samples. Generally, the water permeability increases with bigger pore size and porosity.28 Thus, the pore structure has a great influence on water permeability, resulting in different liquid water flux.
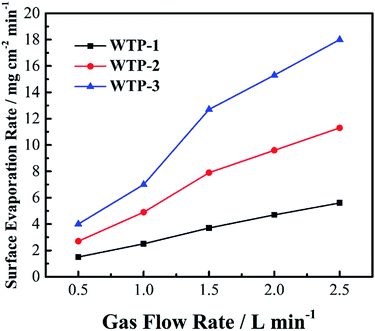
As for the evaporation process, the following equation can be used to describe the water evaporation rate:22
 | (8) |
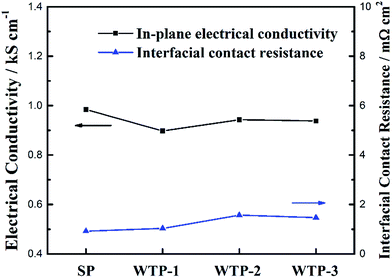
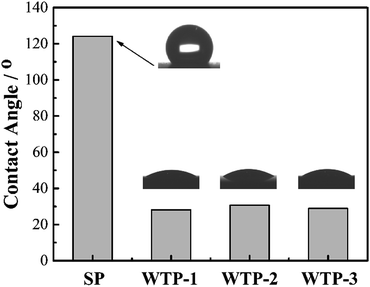
In summary, pore structure has little effect on electronic conductivity and wettability but has a great influence on flexure strength, bubble pressure and water flux. Since the water flux is a key parameter for the humidification and drainage process of WTP,29 the following discussion takes the liquid water flux and surface evaporation rate as the independent variable.
3.2. Effect of liquid water flux on drainage function of WTPs
To investigate the influence of liquid water flux on drainage function of WTPs, cell performance of SP and WTPs with different water flux were evaluated respectively. The inlet gas streams were saturated humidified to eliminate the effect of humidification process. WTP was placed at cathode side. The polarization curves are shown in Fig. 10(a). The cell performance is significantly improved after replacing SP with WTP. The enhanced performance is due to drainage function of WTPs. However, WTPs with different pore structure show similar cell performance.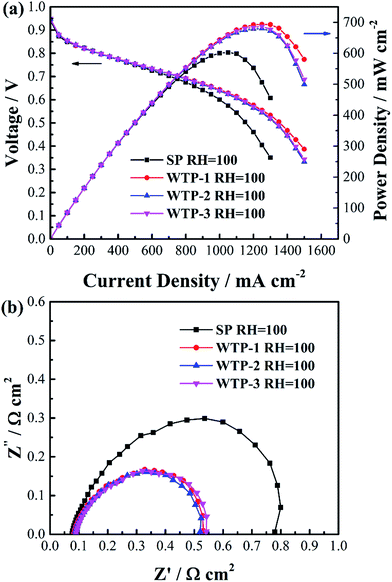 | ||
| Fig. 10 (a) Polarization curves and (b) electrochemical impedance spectroscopy at 1000 mA cm−2 of SP and WTP under saturated humidified condition. | ||
To further study the reason, EIS was tested, as seen in Fig. 10(b). The main difference between SP and WTP is the radius of low frequency arc. This can be attributed to a weakened flooding issue due to WTP's drainage function, resulting in reduced mass transport loss. Meanwhile, the water balance test in Table 2 can obtain the same inference. Water content of cathode chamber is reduced sharply after applying WTP, which can mitigate flooding phenomenon in cathode GDL and CL. Moreover, the water content in the anode chamber increased after employing WTP, which is probably due to temperature-driven water transport. Meanwhile, the EIS and water balance test with different liquid water flux show relatively constant results. Theoretically, increased liquid water flux of WTPs means better drainage function. The main reason is the surplus liquid water flux. The generated water flux is 5.60 mg cm−2 min−1 at 1000 mA cm−2. While the minimum liquid water flux is 16.0 mg cm−2 min−1, which is still higher than the generated water. In saturated humidified condition, the quantity of excess water is basically equal to the generated water, which should be removed. As seen in Table 2, almost all of the generated water can be removed by WTPs and the remaining water is blown out by exhaust. Both of the three WTPs are capable of mitigating electrode flooding due to the surplus drainage function. As a result, the WTPs show similar drainage function in fuel cell operation.
| Samples | Water flux/mg cm−2 min−1 | Error% | |||||||
|---|---|---|---|---|---|---|---|---|---|
| Wa,in | Wa,out | Wc,in | Wg | Wc,out | Ww | Win + Wg | Wout | ||
| SP | 2.00 | 1.98 | 4.20 | 5.60 | 9.89 | — | 11.80 | 11.87 | 0.56 |
| WTP-1 | 2.00 | 2.31 | 4.20 | 5.60 | 4.79 | 5.07 | 11.80 | 12.16 | 3.05 |
| WTP-2 | 2.00 | 2.15 | 4.20 | 5.60 | 4.61 | 5.20 | 11.80 | 11.96 | 1.36 |
| WTP-3 | 2.00 | 2.20 | 4.20 | 5.60 | 4.32 | 5.20 | 11.80 | 11.72 | −0.68 |
3.3. Effect of surface evaporation rate on humidification function of WTPs
In order to investigate effect of surface evaporation rate on humidification function of WTPs, cell performance of SP and WTPs with different surface evaporation rate were evaluated respectively. The inlet gas humidity was zero and WTP was placed at cathode side. The polarization curves are shown in Fig. 11(a). Compared with traditional SP, cells with WTP installed show better performance. And cell performance increased with larger surface evaporation rate. Moreover, benefiting from humidification and drainage function, WTP type fuel cell without external humidification showed comparable performance to SP type fuel cell with saturated humidity feeds, which can lighten and simplify the whole system.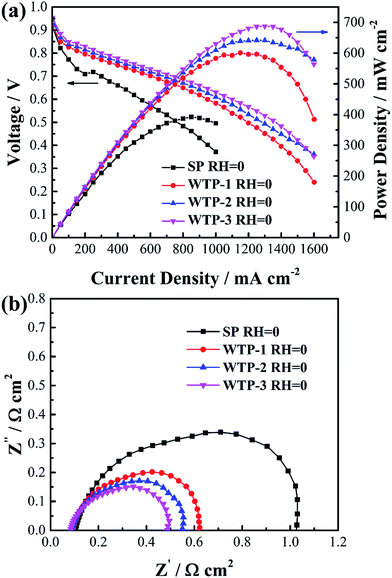 | ||
| Fig. 11 (a) Polarization curves and (b) electrochemical impedance spectroscopy at 1000 mA cm−2 of SP and WTP fuel cell under zero inlet humidity. | ||
To explain enhanced cell performance, EIS was measured at 1000 mA cm−2, as shown in Fig. 11(b). It can be seen high frequency resistance (HFR) of cell with WTP is smaller than the one with SP, and HFR decrease with increased surface evaporation rate. The main reason is reduced membrane resistance due to better membrane hydration. The water can transfer from water chamber to gas chamber through WTP. The larger the surface evaporation rate, the smaller the HFR. Another difference is the radius of low-frequency arc, which is composed of electrochemical polarization and mass transfer polarization. To explain this, ECSAs were measured as shown in Table 3. The increased ECSA reveals higher catalyst utilization due to a better membrane hydration, which can lower electrochemical polarization. Resulting from more electrochemical active sites, the diffusion length of oxygen is shorter, which reduces the mass transport polarization.34
| Samples | RH | ECSA/m2 gPt−1 |
|---|---|---|
| SP | 0 | 20.10 |
| WTP-1 | 0 | 53.49 |
| WTP-2 | 0 | 53.74 |
| WTP-3 | 0 | 56.34 |
| SP | 100% | 66.33 |
For further study water transport process inside fuel cell, water transport was tested as shown in Table 4. The smallest anode water content is mainly due to lack of back diffusion at inlet of fuel cell resulting from lowest gas humidity. And the reason for high cathode water content is that water in cathode is all blown out by dynamic drainage. The addition of WTP at cathode side will humidify the air in cathode and enhance back diffusion. Thus, an increase in anode water content is observed. With increased water flux, water content in cathode increases and water content in water chamber decreases. Moreover, the net water transport direction changes. As we mentioned above, the static drainage capacity of different WTP is basically same under fuel cell operation. Thus, the main reason should be their different humidification capacity, which is consistent with the above analysis.
| Samples | Water flux/mg cm−2 min−1 | Error% | |||||||
|---|---|---|---|---|---|---|---|---|---|
| Wa,in | Wa,out | Wc,in | Wg | Wc,out | Ww | Win + Wg | Wout | ||
| SP | 0 | 0.91 | 0 | 5.60 | 4.79 | — | 5.60 | 5.70 | 1.79 |
| WTP-1 | 0 | 1.51 | 0 | 5.60 | 4.09 | 0.13 | 5.60 | 5.73 | 2.26 |
| WTP-2 | 0 | 1.41 | 0 | 5.60 | 4.37 | 0.07 | 5.60 | 5.85 | 4.40 |
| WTP-3 | 0 | 1.36 | 0 | 5.60 | 5.01 | −0.80 | 5.60 | 5.57 | −0.60 |
4. Conclusion
Porous graphite plates, serving as water transport plates, were employed in fuel cell to improve water management. WTPs with different pore structure have similar electronic conductivity and wettability. Whereas the flexure strength and bubble pressure decrease, while the liquid water flux and surface evaporation rate increase. Beneficial from the humidification and drainage function of WTPs, cell performance was successfully improved under saturated or zero humidified feeds conditions. The WTPs with different liquid water flux have similar drainage capability due to excess liquid water flux. Moreover, the cell performance can be promoted with an increase in surface evaporation rate. Taking into account of mechanical property, gas-blocking property and cell performance, WTP-2 is a favorable choice to improve water management in fuel cells. The enhanced performance indicates that water transport plate is a promising technique in PEMFCs.Conflicts of interest
There are no conflicts to declare.Acknowledgements
This work was financially supported by the National Key Research and Development Program of China (Grant No. 2016YFB0101208), NSFC-Liaoning Joint Funding (Grant No. U1508202) and National Natural Science Foundation of China (Grant No. 21576257 and 21676268).References
- Y.-J. Wang, N. Zhao, B. Fang, H. Li, X. T. Bi and H. Wang, Chem. Rev., 2015, 115, 3433–3467 CrossRef CAS PubMed.
- B. Fang, J. H. Kim, M.-S. Kim and J.-S. Yu, Acc. Chem. Res., 2013, 46, 1397–1406 CrossRef CAS PubMed.
- B. Fang, N. K. Chaudhari, M.-S. Kim, J. H. Kim and J.-S. Yu, J. Am. Chem. Soc., 2009, 131, 15330–15338 CrossRef CAS PubMed.
- W. Dai, H. Wang, X.-Z. Yuan, J. J. Martin, D. Yang, J. Qiao and J. Ma, Int. J. Hydrogen Energy, 2009, 34, 9461–9478 CrossRef CAS.
- M. Ji and Z. Wei, Energies, 2009, 2, 1057–1106 CrossRef CAS.
- K. Jiao and X. Li, Prog. Energy Combust. Sci., 2011, 37, 221–291 CrossRef CAS.
- H. Li, Y. Tang, Z. Wang, Z. Shi, S. Wu, D. Song, J. Zhang, K. Fatih, J. Zhang, H. Wang, Z. Liu, R. Abouatallah and A. Mazza, J. Power Sources, 2008, 178, 103–117 CrossRef CAS.
- J. S. Yi, J. D. Yang and C. King, AIChE J., 2004, 50, 2594–2603 CrossRef CAS.
- L. C. Hoagland, WO0195418 (A1), 2001.
- S. Hiroshi, US4007601 (A), US4146597 (A), US4666469 (A), US4707267 (A), US5525143 (A), US6210464 (B1), US6394084 (B1), US2001015501 (A1), 2001.
- B. M. Wozniczka, C. Y. Chow and H. H. Voss, US5382478-A, WO9525357-A1, AU9518028-A, 1995.
- T. Yang and P. Shi, J. Electrochem. Soc., 2006, 153, A1518 CrossRef CAS.
- X. Guo, Z. Shao, Y. Xiao, Y. Zeng, S. Liu, X. Wang and B. Yi, Electrochem. Commun., 2014, 44, 16–18 CrossRef CAS.
- C.-L. Lin, C.-W. Liu, G.-H. Yen and W.-Y. Ho, Nanosci. Nanotechnol. Lett., 2015, 7, 906–910 CrossRef.
- V. Senthil Velan, G. Velayutham, N. Hebalkar and K. S. Dhathathreyan, Int. J. Hydrogen Energy, 2011, 36, 14815–14822 CrossRef CAS.
- M. W. Knobbe, W. He, P. Y. Chong and T. V. Nguyen, J. Power Sources, 2004, 138, 94–100 CrossRef CAS.
- T. Van Nguyen and M. W. Knobbe, J. Power Sources, 2003, 114, 70–79 CrossRef CAS.
- P. Schuetz and D. Dipling, ATA215286 (A), AT389020 (B), 1989.
- J. A. S. Bett, D. J. Wheeler and C. Bushnell, US 5840414, 1998.
- B. F. Dufner, M. L. Perry, J. C. Trocciola, D. Yang and J. S. Yi, US2003039877-A1, WO2003019701-A1, US6617068-B2, DE10297156-T0, AU2002332688-A1, JP2005501386-W, JP4339684-B2, 2003.
- M. Edgar, US6197442 (B1), 2001.
- A. Z. Weber and R. M. Darling, J. Power Sources, 2007, 168, 191–199 CrossRef CAS.
- L. Tyler, AC Transit Breaks Fuel Cell Electric Bus Record, https://ngtnews.com/ac-transit-breaks-25000-hour-record-fuel-cell-electric-bus.
- J. van Dokkum and A. Dasinger, J. Power Sources, 2008, 181, 378–381 CrossRef CAS.
- S. Litster and J. G. Santiago, J. Power Sources, 2009, 188, 82–88 CrossRef CAS.
- S. Wang, Y. Utaka and Y. Tasaki, Heat Tran. Asian Res., 2006, 35, 137–151 CrossRef.
- S. Wang, Y. Utaka and Y. Tasaki, Int. J. Heat Mass Transfer, 2009, 52, 4386–4389 CrossRef.
- X. Guo, Y. Zeng, Z. Wang, L. Qu, Z. Shao, Z. Yuan and B. Yi, Electrochim. Acta, 2016, 191, 116–123 CrossRef CAS.
- X. Guo, Y. Zeng, Z. Wang, Z. Shao and B. Yi, J. Power Sources, 2016, 302, 84–91 CrossRef CAS.
- T. Sugimoto and X. P. Zhou, J. Colloid Interface Sci., 2002, 252, 347–353 CrossRef CAS PubMed.
- Standardization Administration of the People's Republic of China, GB/T 13465.2–2014.
- Z. Wang, Y. Zeng, S. Sun, Z. Shao and B. Yi, Int. J. Hydrogen Energy, 2017, 42, 21922–21929 CrossRef CAS.
- F. P. Incropera and D. Dewitt, Fundamentals of Heat and Mass Transfer, John Wiley & Sons, New York, Katson, 1990 Search PubMed.
- S. Nakamura, H. Nishikawa, T. Aoki and Y. Ogami, J. Power Sources, 2009, 186, 278–285 CrossRef CAS.
| This journal is © The Royal Society of Chemistry 2018 |

