DOI:
10.1039/C7RA11872D
(Paper)
RSC Adv., 2018,
8, 7818-7831
2-Aryl-3-(arylideneamino)-1,2-dihydroquinazoline-4(3H)-ones as inhibitors of cholinesterases and self-induced β-amyloid (Aβ) aggregation: biological evaluations and mechanistic insights from molecular dynamics simulations†
Received
24th November 2017
, Accepted 19th January 2018
First published on 19th February 2018
Abstract
A series of 2-aryl-3-(arylideneamino)-1,2-dihydroquinazoline-4(3H)-ones were evaluated as inhibitors of acetylcholinesterase (AChE), butyrylcholinesterase (BuChE) and self-induced β-amyloid (Aβ) aggregation. All the compounds were found to inhibit both forms of cholinesterase (IC50 in the range 4–32 μM) with some selectivity for BuChE. Most of the compounds also showed self-induced Aβ aggregation inhibitory activities, which were comparable or higher than those obtained for reference compounds, curcumin and myricetin. Docking and molecular dynamics (MD) simulation experiments suggested that the compounds are able to disrupt the dimer form of Aβ.
1. Introduction
Alzheimer's disease (AD) is the most common cause of dementia among the elderly affecting cognitive features including intelligence, memory, judgment, problem-solving, abstract thinking ability, language and speech.1 According to the World Alzheimer Report 2016, about 47 million people live with dementia worldwide and this number is estimated to increase to more than 131 million by 2050.2 The majority of the current therapeutic agents used in the treatment of AD are acetylcholinesterase (AChE) inhibitors (e.g., donepezil, galantamine, rivastigmine and tacrine) (Fig. 1), which increase the amount of acetylcholine (ACh) in the cholinergic synapses, elevating cholinergic transmission. However, these medications have shown side effects such as nausea, vomiting, headaches, diarrhea, dizziness, and the symptoms of AD generally return when the patients discontinue use of the drug.3 Apart from AChE, butyrylcholinesterase (BuChE) is also considered as a potential target because it plays an important role in regulating ACh levels.4 It has been reported that there is increased BuChE activity (40–90%) in the most affected areas of the AD patient's brain, whereas the activity of AChE remains constant or highly reduced.5 Hence there is a need for the development of dual or selective inhibitors of AChE and BuChE with greater efficacy and fewer side effects than the compounds that are currently in clinical use.
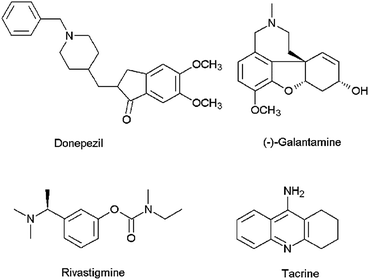 |
| | Fig. 1 Chemical structures of AChE inhibitors. | |
A complementary, disease-modifying approach to the treatment of AD is the inhibition of β-amyloid (Aβ) peptide aggregation. The Aβ peptides are proteolytic byproducts of the amyloid precursor protein and typically consist of 40 (Aβ1–40) and 42 (Aβ1–42) amino acids which aggregate to form oligomers and fibrils. Studies have indicated that soluble oligomers are the most neurotoxic, while mature fibrils may be non-toxic.6,7
Although there have been a few previous reports of quinazoline derivatives exhibiting good inhibitory activity towards cholinesterases,8–16 and self-induced Aβ aggregation,17–19 compounds bearing aryl groups at positions 2 and 3 of the quinazoline ring have not been previously investigated. Such derivatives might be expected to inhibit not only cholinesterases but also Aβ peptide aggregation due to their similarity to known Aβ peptide aggregation inhibitors, such as chrysamine G, congo red and curcumin (Fig. 2), which contain two aromatic groups separated by a backbone of the appropriate length.20 The current study describes the AChE, BuChE and the self-induced Aβ peptide aggregation inhibitory activities of a series of previously-synthesised 2-aryl-3-(arylideneamino)-1,2-dihydroquinazoline-4(3H)-one derivatives (Fig. 3).21–23 Furthermore, molecular modelling studies were conducted to study the possible binding interactions of the active compounds towards the target proteins.
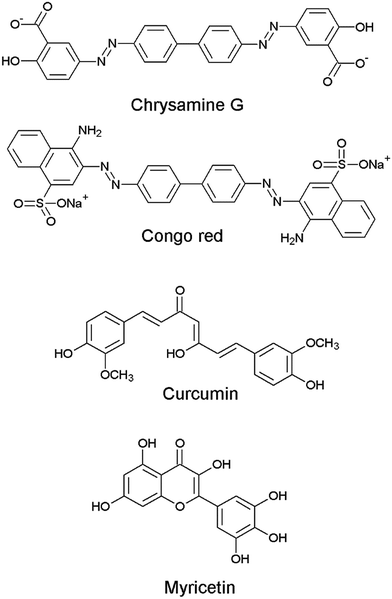 |
| | Fig. 2 Chemical structures of Aβ aggregation inhibitors. | |
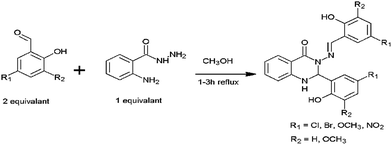 |
| | Fig. 3 General structure of the compounds 1–5. | |
2. Results and discussion
2.1 Lipinski rule of five parameters
The predicted Lipinski rule of five parameters of the quinazolinone derivatives, which are summarised in Table 1, suggest that the compounds should have acceptable oral bioavailability. Previous studies have also shown that they are non-cytotoxic towards normal cells at 50 μM concentration.21–23
Table 1 Lipinski rule of five parameters for compounds 1–5a
| Compound |
MW |
HBD |
HBA |
A![[thin space (1/6-em)]](https://www.rsc.org/images/entities/char_2009.gif) log log![[thin space (1/6-em)]](https://www.rsc.org/images/entities/char_2009.gif) P P |
PSA/Å2 |
MW: molecular weight; A![[thin space (1/6-em)]](https://www.rsc.org/images/entities/char_2009.gif) log log![[thin space (1/6-em)]](https://www.rsc.org/images/entities/char_2009.gif) P: logarithm of octanol–water partition coefficient; HBD: number of hydrogen bond donors; HBA: number of hydrogen bond acceptors; PSA: topological polar surface area. P: logarithm of octanol–water partition coefficient; HBD: number of hydrogen bond donors; HBA: number of hydrogen bond acceptors; PSA: topological polar surface area. |
| 1 |
517.17 |
3 |
6 |
5.31 |
86.42 |
| 2 |
428.27 |
3 |
6 |
5.14 |
86.42 |
| 3 |
577.22 |
3 |
8 |
5.28 |
104.28 |
| 4 |
419.43 |
3 |
8 |
3.78 |
104.28 |
| 5 |
449.37 |
3 |
12 |
3.60 |
172.06 |
| Donepezil |
379.49 |
0 |
4 |
4.57 |
38.51 |
| Propidium |
414.59 |
2 |
2 |
3.40 |
58.43 |
| Tacrine |
198.26 |
1 |
2 |
2.79 |
37.80 |
2.2 Cholinesterase inhibitory activity
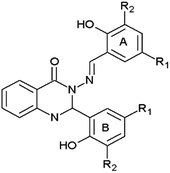
The quinazolinone derivatives were evaluated for their in vitro inhibitory activities against human AChE and equine BuChE according to Ellman's method.24 Donepezil, propidium and tacrine were used as reference compounds. The results are summarised in Table 2 and demonstrate that all the test compounds show good inhibition against both AChE and BuChE. Compound 1 was the most active towards AChE with (IC50 = 10.5 μM) whereas compounds 2 (IC50 = 4.6 μM) and 4 (IC50 = 4.0 μM) exhibited the highest anti-BuChE activity. Compounds 1–4 showed 2- to 8-fold selectivity for BuChE compared to AChE, whereas compound 5 was slightly selective for AChE.
Table 2 Structural data and inhibitory activities of compounds 1–5 against human AChE and equine BuChE
|
| Compound |
R1 |
R2 |
Human AChE IC50/μMa |
equine BuChE IC50/μMa |
Selectivity for BuChEc |
| Values are expressed as mean ± SEM. Standard inhibitors. Selectivity is determined as IC50 (AChE)/IC50 (BuChE). |
| 1 |
Br |
H |
10.5 ± 2.9 |
5.7 ± 1.0 |
1.8 |
| 2 |
Cl |
H |
14.5 ± 5.8 |
4.6 ± 1.0 |
3.2 |
| 3 |
Br |
OCH3 |
19.5 ± 6.0 |
11.9 ± 2.0 |
1.6 |
| 4 |
OCH3 |
H |
32.3 ± 5.3 |
4.0 ± 0.8 |
8.1 |
| 5 |
NO2 |
H |
14.2 ± 2.3 |
17.8 ± 2.0 |
0.8 |
| Donepezilb |
|
|
0.09 ± 0.01 |
1.9 ± 0.2 |
0.05 |
| Propidiumb |
|
|
11 ± 3 |
20.8 ± 2.1 |
0.5 |
| Tacrineb |
|
|
0.19 ± 0.04 |
0.011 ± 0.001 |
17.3 |
2.3 Molecular docking at cholinesterases
AChE and BuChE share 65% amino acid sequence homology and have similar molecular forms and active center structure.25 They contain 20 Å deep and narrow gorge, in which five regions can be identified. In AChE, (1) peripheral anionic site (PAS) residues: Tyr72, Asp74, Tyr124, Trp286 and Tyr341, (2) the acyl pocket residues: Phe295, Phe297, and Phe338, (3) the catalytic triad residues: Ser203, Glu334 and His447, (4) the oxyanion hole (OH) residues: Gly121, Gly122 and Ala204 and the (5) choline binding site residues: Trp86 and Glu 202.26 In BuChE, (1) peripheral anionic site (PAS) residues: Asp70 and Tyr332 (2) the acyl pocket residues: Leu286 and Val288 (3) the catalytic triad residues: Ser198, Glu325 and His438 (4) the oxyanion hole (OH) residues: Gly116, Gly117, Ala199 and the (5) choline binding site residues: Trp82.25 It has been reported that the volume of BuChE active site gorge is larger (∼200 Å3) than that of AChE active site gorge due to six of 14 aromatic amino acid residues lining in the active site gorge of AChE are substituted by aliphatic amino acid residues in BuChE. This determines the selectivity of these enzymes towards different inhibitor.25,27,28
Molecular modelling studies were performed in order to predict the interaction modes of compound 2 towards the cholinesterases. This compound was selected from compounds 1–5, based on its Lipinski rule of five parameters (Table 1) and cholinesterase activities (Table 2). Compound 2 and reference compound, tacrine, were docked into models derived from the X-ray crystal structures of human AChE in complex with donepezil (PDB ID: 4EY7),29 and human BuChE in complex with tacrine (PDB ID: 4BDS),30 and the best-docked pose was extracted for further study. The results indicated that compound 2 mainly interacts with the catalytic anionic site (CAS) regions of both proteins (Fig. 4 & 5).
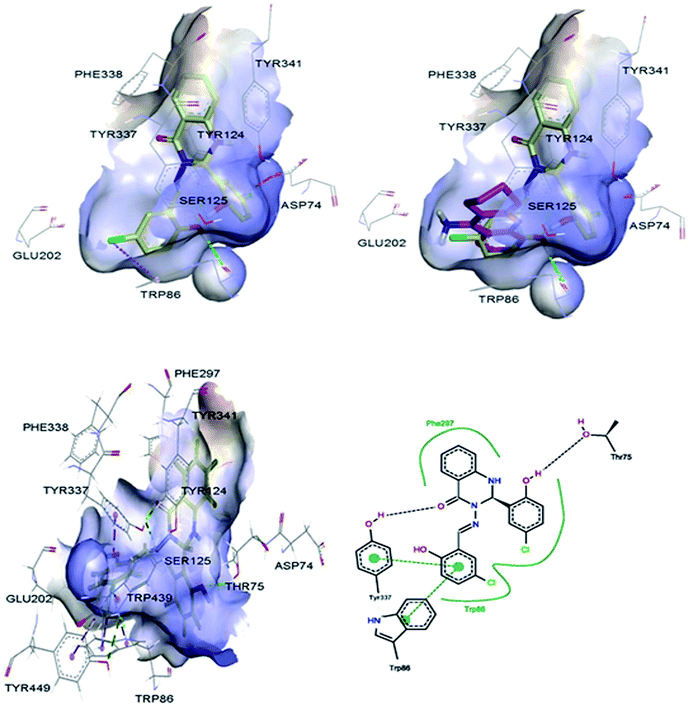 |
| | Fig. 4 3D representations of the binding pose of compound 2 (yellow) and tacrine (pink) in complex with human AChE (PDB ID: 4EY7) from docking (up) and final MD (bottom). The hydrophobic surfaces of the interacting residues are shown in blue. Ligand–protein interactions are depicted with dotted lines: hydrogen bonds (green), π–anion interactions (orange), π–halogen interactions (purple). Schematic representation of the binding interaction of compound 2 at final MD with PoseView is in bottom, right. Hydrogen bonds and π–π stacking interactions are depicted with black and green dotted lines, respectively. The green curve represents other non-polar interactions. | |
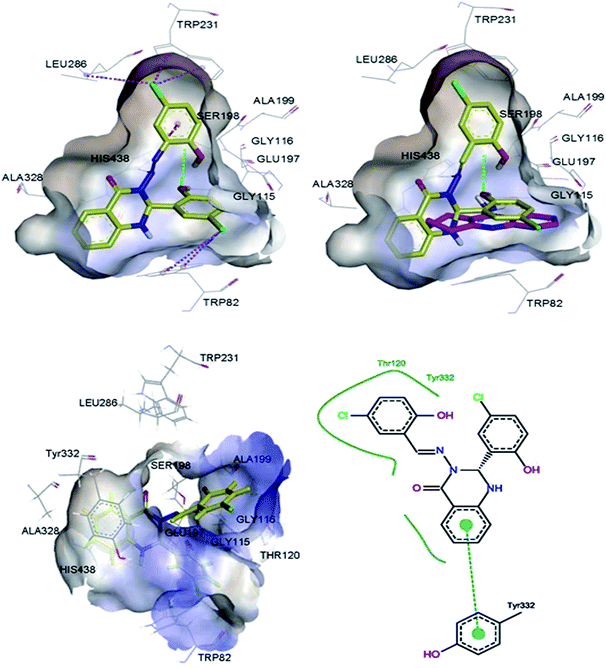 |
| | Fig. 5 3D representations of the binding pose of compound 2 (yellow) and tacrine (pink) in complex with human BuChE (PDB ID: 4BDS) from docking (up) and final MD (bottom). The hydrophobic surfaces of the interacting residues are shown in blue. Ligand–protein interactions are depicted with dotted lines: hydrogen bonds (green), π–cation interactions (orange), π–halogen interactions (purple). Schematic representation of the binding interaction of compound 2 at final MD with PoseView is in bottom, right. Hydrogen bonds and π–π stacking interactions are depicted with black and green dotted lines, respectively. The green curve represents other non-polar interactions. | |
2.4 Molecular dynamics (MD) simulation on cholinesterases
In order to optimise the interaction between the protein and its inhibitor, a 30 ns MD simulation was performed by using the Amber 14 package.31 Fig. S1† shows the root-mean-square deviation (RMSD) versus MD simulation time of AChE–compound 2 and AChE–tacrine complexes. The complexes maintain a constant RMSD values after 6 ns. Snapshots were extracted from the trajectory every 0.2 ps during the MD simulation in order to calculate the mean binding energy. Tables S1 and S2† list the contributions of various energy components to the binding free energy. The AChE–compound 2 complex contributed to more van der Waals interaction while AChE–tacrine complex has shown more electrostatic interaction. The estimated binding free energies for the AChE–compound 2 and AChE–tacrine complexes based on the MM-PBSA method are −13.21 ± 5.09 and −27.11 ± 4.67 kcal mol−1, respectively (Table 3). The total binding energies of AChE–compound 2 and AChE–tacrine complexes were distributed across all residues using the MM-PBSA energy decomposition method (Tables 4 & 5).
Table 3 Binding free energy (MM-PBSA) for AChE/BuChE–ligand complexes
| Compound |
Binding free energy (kcal mol−1) |
| AChE |
BuChE |
| Compound 2 |
−13.21 ± 5.09 |
−20.17 ± 3.97 |
| Tacrine |
−27.11 ± 4.67 |
−26.52 ± 5.32 |
Table 4 MM-PBSA energy decomposition of AChE/BuChE–compound 2 complexesa
| Residue |
Interaction energy (kcal mol−1) AChE–compound 2 |
Residue |
Interaction energy (kcal mol−1) BuChE–compound 2 |
| Residues within 3 Å of protein–ligand interactions are highlighted in bold. PAS residues. Acyl pocket residues. Catalytic triad residues. Oxyanion hole (OH) residues. Choline binding site residues; the residue interaction energy <−1.00 kcal mol−1 are underlined. |
| Tyr72a |
0.20 |
Asn68 |
0.08 |
| Asp74a |
−0.17 |
Ile69 |
−0.54 |
| Thr75 |
1.23 |
Asp70a |
1.15 |
| Thr83 |
0.04 |
Ser79 |
−0.49 |
| Trp86e |
−0.68 |
Trp82e |
−![[1 with combining low line]](https://www.rsc.org/images/entities/char_0031_0332.gif) ![[. with combining low line]](https://www.rsc.org/images/entities/char_002e_0332.gif) ![[0 with combining low line]](https://www.rsc.org/images/entities/char_0030_0332.gif) ![[2 with combining low line]](https://www.rsc.org/images/entities/char_0032_0332.gif) |
| Asn87 |
−0.41 |
Gly116d |
−![[1 with combining low line]](https://www.rsc.org/images/entities/char_0031_0332.gif) ![[. with combining low line]](https://www.rsc.org/images/entities/char_002e_0332.gif) ![[3 with combining low line]](https://www.rsc.org/images/entities/char_0033_0332.gif) ![[0 with combining low line]](https://www.rsc.org/images/entities/char_0030_0332.gif) |
| Pro88 |
−0.48 |
Gly117d |
−0.78 |
| Gly121d |
−0.27 |
Gln119 |
−0.19 |
| Gly122d |
−0.30 |
Thr120 |
−![[1 with combining low line]](https://www.rsc.org/images/entities/char_0031_0332.gif) ![[. with combining low line]](https://www.rsc.org/images/entities/char_002e_0332.gif) ![[8 with combining low line]](https://www.rsc.org/images/entities/char_0038_0332.gif) ![[1 with combining low line]](https://www.rsc.org/images/entities/char_0031_0332.gif) |
| Tyr124a |
−0.61 |
Ser198c |
−0.39 |
| Ser125 |
0.02 |
Ala199d |
−0.10 |
| Glu202e |
10.7 |
Leu286b |
−0.16 |
| Ser203c |
−0.96 |
Ser287 |
0.86 |
| Ala204d |
−0.29 |
Val288b |
−0.21 |
| Leu289 |
−0.56 |
Glu325c |
1.41 |
| Phe295b |
0.14 |
Ala328 |
0.22 |
| Phe297b |
−![[1 with combining low line]](https://www.rsc.org/images/entities/char_0031_0332.gif) ![[. with combining low line]](https://www.rsc.org/images/entities/char_002e_0332.gif) ![[5 with combining low line]](https://www.rsc.org/images/entities/char_0035_0332.gif) ![[5 with combining low line]](https://www.rsc.org/images/entities/char_0035_0332.gif) |
Phe329 |
−0.79 |
| Glu334c |
4.44 |
Tyr332a |
−![[1 with combining low line]](https://www.rsc.org/images/entities/char_0031_0332.gif) ![[. with combining low line]](https://www.rsc.org/images/entities/char_002e_0332.gif) ![[5 with combining low line]](https://www.rsc.org/images/entities/char_0035_0332.gif) ![[5 with combining low line]](https://www.rsc.org/images/entities/char_0035_0332.gif) |
| Tyr337 |
0.83 |
Trp430 |
−0.53 |
| Phe338b |
−0.73 |
His438c |
3.10 |
| Tyr341a |
−![[1 with combining low line]](https://www.rsc.org/images/entities/char_0031_0332.gif) ![[. with combining low line]](https://www.rsc.org/images/entities/char_002e_0332.gif) ![[0 with combining low line]](https://www.rsc.org/images/entities/char_0030_0332.gif) ![[3 with combining low line]](https://www.rsc.org/images/entities/char_0033_0332.gif) |
|
|
| His447c |
1.59 |
|
|
| Gly448 |
−0.85 |
|
|
| Trp286a |
0.07 |
|
|
| Gly126 |
−0.65 |
|
|
| Tyr449 |
−0.45 |
|
|
| Trp439 |
−0.50 |
|
|
| Interaction energy <−1.00 kcal mol−1 within 3 Å |
−2.58 |
Interaction energy <−1.00 kcal mol−1 within 3 Å |
−5.68 |
Table 5 MM-PBSA energy decomposition of AChE/BuChE–tacrine complexesa
| Residue |
Interaction energy (kcal mol−1) AChE–tacrine |
Residue |
Interaction energy (kcal mol−1) BuChE–tacrine |
| Residues within 3 Å of protein–ligand binding interactions are highlighted in bold. PAS residues. Acyl pocket residues. Catalytic triad residues. Oxyanion hole (OH) residues. Choline binding site residues; the residue interaction energy <−1.00 kcal mol−1 are underlined. |
| Tyr72a |
−0.31 |
Trp82e |
−![[3 with combining low line]](https://www.rsc.org/images/entities/char_0033_0332.gif) ![[. with combining low line]](https://www.rsc.org/images/entities/char_002e_0332.gif) ![[4 with combining low line]](https://www.rsc.org/images/entities/char_0034_0332.gif) ![[1 with combining low line]](https://www.rsc.org/images/entities/char_0031_0332.gif) |
| Asp74a |
−1.78 |
Asp70a |
−1.29 |
| Thr83 |
−0.29 |
Tyr114 |
−0.03 |
| Gly82 |
−0.01 |
Gly116d |
−0.89 |
| Trp86e |
−![[4 with combining low line]](https://www.rsc.org/images/entities/char_0034_0332.gif) ![[. with combining low line]](https://www.rsc.org/images/entities/char_002e_0332.gif) ![[6 with combining low line]](https://www.rsc.org/images/entities/char_0036_0332.gif) ![[6 with combining low line]](https://www.rsc.org/images/entities/char_0036_0332.gif) |
Gly117d |
0.06 |
| Tyr119 |
0.70 |
Thr120 |
0.94 |
| Gly121d |
−0.55 |
Gly121 |
0.70 |
| Gly122d |
0.20 |
Tyr128 |
1.40 |
| Tyr124a |
0.10 |
Glu197 |
−![[4 with combining low line]](https://www.rsc.org/images/entities/char_0034_0332.gif) ![[. with combining low line]](https://www.rsc.org/images/entities/char_002e_0332.gif) ![[6 with combining low line]](https://www.rsc.org/images/entities/char_0036_0332.gif) ![[5 with combining low line]](https://www.rsc.org/images/entities/char_0035_0332.gif) |
| Ser125 |
0.20 |
Ser198c |
0.18 |
| Gly126 |
0.57 |
Ala199d |
0.21 |
| Gly120 |
0.63 |
Leu286b |
0.25 |
| Gly202e |
−![[3 with combining low line]](https://www.rsc.org/images/entities/char_0033_0332.gif) ![[. with combining low line]](https://www.rsc.org/images/entities/char_002e_0332.gif) ![[8 with combining low line]](https://www.rsc.org/images/entities/char_0038_0332.gif) ![[4 with combining low line]](https://www.rsc.org/images/entities/char_0034_0332.gif) |
Val288b |
0.11 |
| Ser203c |
−0.01 |
Glu325c |
−2.12 |
| Ala204d |
0.29 |
Phe329 |
−0.21 |
| Trp286a |
0.08 |
Tyr332a |
0.84 |
| Phe295b |
0.10 |
Gly439 |
0.01 |
| Phe297b |
0.05 |
Tyr440 |
−0.86 |
| Glu334c |
−2.19 |
Met437 |
0.21 |
| Tyr337 |
−0.11 |
His438c |
0.50 |
| Phe338b |
−0.04 |
Trp430 |
0.11 |
| Tyr341a |
−0.08 |
|
|
| His447c |
0.69 |
|
|
| Gly448 |
−0.38 |
|
|
| Trp439 |
0.49 |
|
|
| Interaction energy <−1.00 kcal mol−1 within 3 Å |
−8.50 |
Interaction energy <−1.00 kcal mol−1 within 3 Å |
−8.06 |
Fig. S1† shows the RMSD versus MD simulation time of BuChE–compound 2 and BuChE–tacrine complexes. The complexes maintain a constant RMSD values along 30 ns of MD simulations. Tables S3 and S4† list the contributions of various energy components to the binding free energy. The BuChE–compound 2 complex has shown more van der Waals interaction compared to the BuChE–tacrine complex, which showed more electrostatic interaction. The estimated binding free energies for BuChE–compound 2 and BuChE–tacrine complexes based on the MM-PBSA method are −20.17 ± 3.97 and −26.52 ± 5.32 kcal mol−1, respectively (Table 3), which correlate well with the experimental results (Table 2). The total binding energies of BuChE–compound 2 and BuChE–tacrine complexes were distributed across all residues using the MM-PBSA energy decomposition method (Tables 4 & 5). The final MD structures of AChE–compound 2 complex are shown in Fig. 4. Hydrogen bond was observed between the carbonyl group of the compound 2 with the residue Tyr337. Other hydrogen bond was also formed between the hydrogen atom of the hydroxyl group at the ortho position of ring B with the residue Thr75. Apart from these, π–π stacking interactions were observed between the ligand and the residues Trp86 and Tyr337. Fig. 5 shows the final MD structures of BuChE–compound 2 complex. A π–π stacking interaction was observed between the compound 2 and the residue Tyr332. Residues such as Thr120 and Tyr332 were also involved in other non-polar interactions. The precise interaction formed between the compounds and the binding residues of AChE/BuChE could be estimated by calculating 3 Å interaction energy.32,33 In comparison with AChE binding interaction, compound 2 bound better towards the BuChE from molecular dynamics simulations due to its interaction with Trp82, Gly116, Thr120 and Tyr332 with the total interaction energy of −5.68 kcal mol−1.
2.5 Aβ peptide aggregation inhibition assay
To determine the ability of the test compounds to inhibit the self-induced Aβ1–40 and Aβ1–42 aggregation, the method of LeVine et al.34 was followed. Curcumin and myricetin (Fig. 2) were used as standard inhibitors. The results showed that all the compounds except compound 4 exhibited more than 40% inhibition towards Aβ1–40 and Aβ1–42 at a final concentration of 10 μM which is comparable or higher than the inhibition produced by standard inhibitors curcumin and myricetin (Fig. 6).
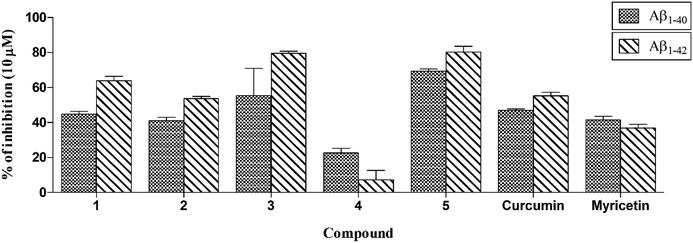 |
| | Fig. 6 Inhibition of Aβ1–40 and Aβ1–42 peptides aggregation by compounds 1–5 at 10 μM in comparison with curcumin and myricetin. Values are shown as the mean ± SEM (n = 3). | |
2.6 Docking study on Aβ1–40 peptide dimer
The interaction of tested compound with Aβ1–40 peptide was studied by choosing Aβ dimer consisting of chains A and B from the NMR structure of an Aβ fibril (Aβ1–40) (PDB ID: 2LMN, Tycko model).35 The initial step in the Aβ oligomerisation and fibrillisation processes is the formation of dimers,36 thus the Aβ dimer was selected. The missing N-terminal octapeptide region consisting of amino acid residues 1–8 (Aβ1–8) was excluded for modelling since those residues are not involved in Aβ aggregation.37–39 The amyloidogenic region of the protein was predicted using the web server FoldAmyloid, which predicts the aggregation prone regions on a polypeptide chain based on the physicochemical properties of the amino acid residues.40,41 The amyloidogenic region of the peptide was identified as the 16–21 and 32–36 amino acid sequences (Fig. 7 in pink region).
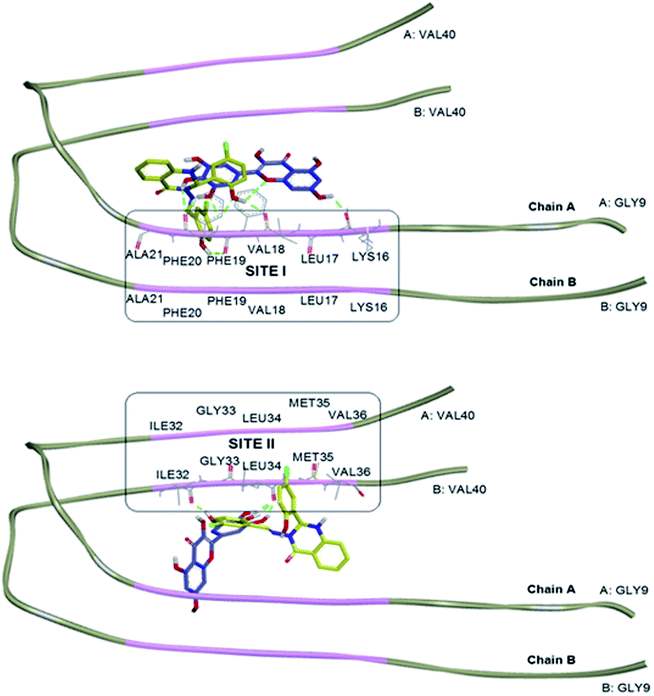 |
| | Fig. 7 The Aβ dimer consisting of chains A and B from the NMR structure of an Aβ1–40 (PDB ID: 2LMN). The amyloidogenic residues as predicted by the FoldAmyloid server are highlighted in pink. Overlapping docked structures of myricetin (blue) and compound 2 (yellow) at amyloidogenic region I (site I, top) and amyloidogenic region II (site II, bottom). Hydrogen bonds interaction is depicted with green dotted lines. | |
Compound 2 and standard drug, myricetin were docked into the Aβ1–40 peptide dimer to study the possible protein–ligand binding interactions (Tables S5 and S6†). The overlapping 3D structures of myricetin and compound 2 at sites I & II are shown in Fig. 7. Compound 2 was found to exhibit more similar binding site to that of myricetin in occupying site I, as compared to site II. Docking investigation showed that hydrogen bonds were formed between the myricetin and residues Lys16, Val18 and Phe20 at chain A of Aβ peptide dimer whereas compound 2 found to interact with the same site as myricetin via hydrogen bondings with residues Val18, Phe19, and Phe20.
2.7 MD simulation on Aβ1–40 peptide dimer
The best poses of compound 2 and myricetin with the Aβ1–40 peptide dimer for two binding sites (sites I & site II) obtained from the docking studies, were submitted to additional MD simulation steps as described in the method section. A 30 ns MD simulation was performed by using the Amber 14 package in order to optimise the interaction between the protein and its inhibitor. RMSD versus MD simulation time (Fig. S2†) has shown that Aβ–compound 2 at site I, Aβ–compound 2 at site II, Aβ–myricetin at site I and Aβ–myricetin at site II complexes were stable during 20–25 ns, 15–20 ns, 26–30 ns and 26–30 ns, respectively. Therefore, these time frames of the different simulation trajectories were selected in order to find the binding free energy and interaction energy using MM-PBSA calculations.
Fig. S2† shows the RMSD versus MD simulation time of Aβ–compound 2 and Aβ–myricetin complexes at site I. The complexes maintained a constant RMSD values after 20 ns. Snapshots were extracted from the trajectory every 0.2 ps during the MD simulation in order to calculate the mean binding energy. Tables S7 and S8† list the contributions of various energy components to the binding free energy.
The Aβ–compound 2 complex has shown more van der Waals interaction compared to the Aβ–myricetin complex, which showed more electrostatic interaction. The estimated binding free energies for Aβ–compound 2 and Aβ–myricetin complexes at site I based on the MM-PBSA method are −24.56 ± 2.73 and −26.07 ± 3.67 kcal mol−1, respectively (Table 6 & Fig. 8). The total binding energy of Aβ–compound 2 was distributed across all residues using the MM-PBSA energy decomposition method (Table 7).
Table 6 Binding free energy (MM-PBSA) for Aβ1–40 peptide dimer–ligand complexes
| Compound |
Binding free energy (kcal mol−1) |
| Site I |
Site II |
| Compound 2 |
−24.56 ± 2.73 |
−18.12 ± 2.21 |
| Myricetin |
−26.07 ± 3.67 |
−19.67 ± 2.55 |
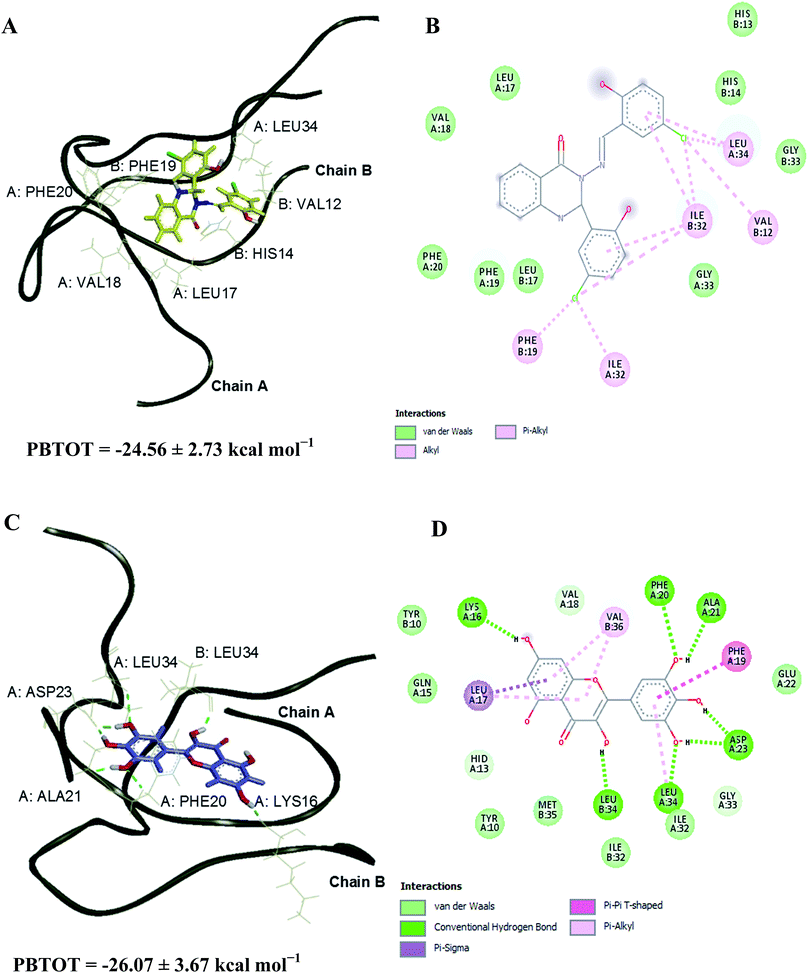 |
| | Fig. 8 3D representations of the binding poses of (A) compound 2 and (C) myricetin in complex with Aβ1–40 peptide dimer at 25 and 30 ns of MD simulations, respectively (site I). Hydrogen bonds interaction is depicted with green dotted lines. 2D representations of the binding interaction of (B) compound 2 and (D) myricetin. | |
Table 7 MM-PBSA energy decomposition of Aβ1–40 peptide dimer–ligand complexes using PBTOT method. The strong interaction residues <−1.00 (kcal mol−1) are highlighted in bold
| Interaction energy (kcal mol−1) |
| Residue |
Site I |
Site II |
| Dimer–compound 2 (20–25 ns) |
Dimer–myricetin (26–30 ns) |
Dimer–compound 2 (15–20 ns) |
Dimer–myricetin (26–30 ns) |
| A:LYS 16 |
−0.11 |
0.02 |
−0.01 |
−0.01 |
| A:LEU 17 |
−0.86 |
−1.55 |
−0.05 |
−0.72 |
| A:VAL 18 |
0.04 |
−0.45 |
−0.03 |
−0.12 |
| A:PHE 19 |
−1.67 |
−2.14 |
−1.50 |
−0.11 |
| A:PHE 20 |
−0.06 |
−1.45 |
−0.06 |
−2.82 |
| A:ALA 21 |
−0.05 |
−0.79 |
−0.47 |
−0.25 |
| A:ILE 32 |
−0.55 |
−1.01 |
−0.01 |
0.00 |
| A:GLY 33 |
−0.35 |
0.00 |
−0.04 |
−0.01 |
| A:LEU 34 |
−2.08 |
−0.01 |
−0.76 |
−0.02 |
| A:MET35 |
−0.08 |
−0.01 |
−0.01 |
−0.07 |
| A:VAL 36 |
−0.02 |
−0.02 |
−0.60 |
−0.92 |
| B:LYS 16 |
−0.41 |
−0.06 |
−0.07 |
−0.05 |
| B:LEU 17 |
−1.72 |
−0.13 |
−1.05 |
−1.09 |
| B:VAL 18 |
−0.06 |
0.00 |
−0.06 |
−0.04 |
| B:PHE 19 |
−0.10 |
−0.14 |
−0.54 |
−0.01 |
| B:PHE 20 |
−0.03 |
−0.07 |
−0.07 |
−0.02 |
| B:ALA 21 |
0.00 |
−0.03 |
−0.03 |
0.00 |
| B:ILE 32 |
−2.12 |
−0.90 |
−0.34 |
−0.01 |
| B:GLY 33 |
0.02 |
−0.28 |
−0.05 |
0.00 |
| B:LEU 34 |
−0.22 |
−1.44 |
−2.59 |
−0.55 |
| B:MET 35 |
−0.10 |
−0.41 |
−0.06 |
−0.07 |
| B:VAL 36 |
−0.01 |
−1.62 |
−0.03 |
−1.74 |
Fig. S2† shows the RMSD versus MD simulation time of Aβ–compound 2 and Aβ–myricetin complexes at site II. The complexes maintain a constant RMSD values after 15 ns. Snapshots were extracted from the trajectory every 0.2 ps during the MD simulation in order to calculate the mean binding energy. Tables S9 and S10† list the contributions of various energy components to the binding free energy. The Aβ–compound 2 and Aβ–myricetin complexes have shown more van der Waals interaction compared to the electrostatic interaction. The estimated binding free energies for Aβ–compound 2 and Aβ–myricetin complexes at site II based on MM-PBSA method are −18.12 ± 2.21 and −19.67 ± 2.55 kcal mol−1, respectively (Table 6 & Fig. 9). The total binding energy was distributed across all residues using the MM-PBSA energy decomposition method (Table 7).
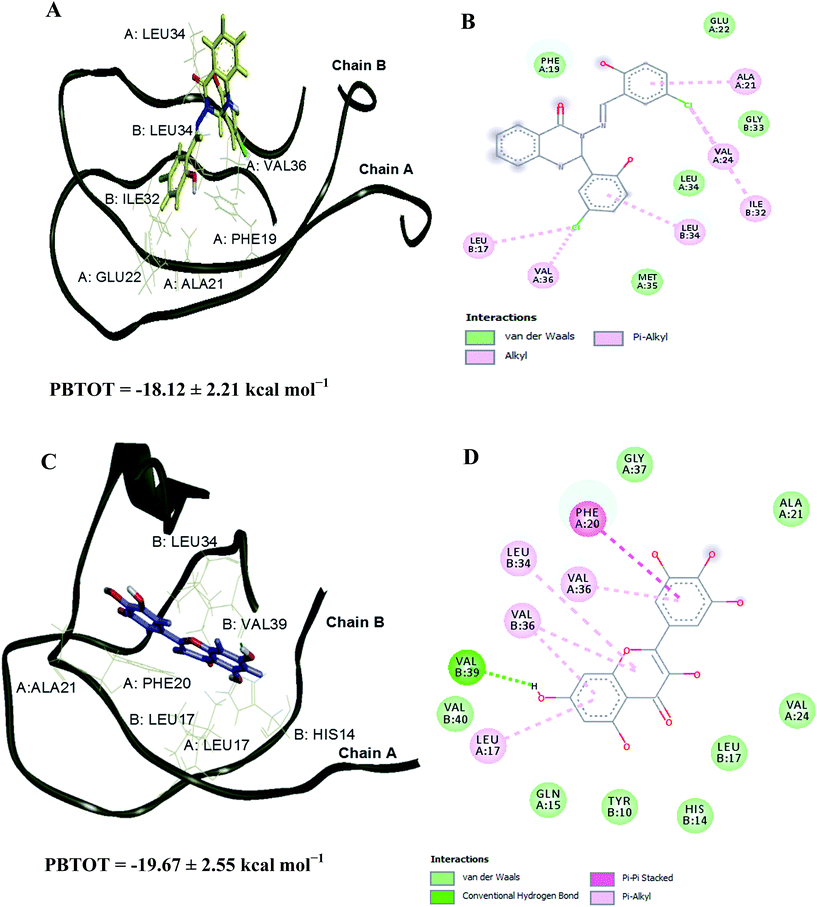 |
| | Fig. 9 3D representations of the binding poses of (A) compound 2 and (C) myricetin in complex with Aβ1–40 peptide dimer at 20 and 30 ns of MD simulations, respectively (site II). Hydrogen bonds interaction is depicted with green dotted lines. 2D representations of the binding interaction of (B) compound 2 and (D) myricetin. | |
A 30 ns MD simulation was conducted for free dimer system following the simulation steps as explained in method section. The simulation trajectory at 26–30 ns of free dimer system was observed to be stable and this time frame was selected in order to find the binding free energy using MM-PBSA method (Fig. S2†). The binding free energy between chains A and B was calculated for free dimer system and all other complexes to investigate the influence of the compound 2 and myricetin on the structural stability of the dimer.42 Investigation of the MD simulation has shown the disruption of the dimer binding interaction in dimer–ligand complexes compared to the free dimer system (Fig. S3†). The interchain (chains A and B) binding free energy between the dimer of free system (26–30 ns), dimer of dimer–compound 2 complex at site I (20–25 ns), dimer of dimer–myricetin complex at site I (26–30 ns), dimer of dimer–compound 2 complex at site II (15–20 ns) and dimer of dimer–myricetin complex at site II (26–30 ns) were estimated as −113.86 ± 7.60, −91.57 ± 6.30, −81.22 ± 7.81, −93.68 ± 8.38, and −97.62 ± 9.09 kcal mol−1, respectively (Table 8 and the detailed calculation in Tables S11–S15†).
Table 8 The interchain (chains A and B) binding free energy (kcal mol−1) and destabilisation energy evaluated by MM-PBSA method
| System |
The interchain (chains A and B) binding free energy (kcal mol−1) |
Destabilisation energy (kcal mol−1) |
| Free dimer |
−113.86 ± 7.60 |
— |
| Dimer–compound 2 at site I |
−91.57 ± 6.30 |
22.29 ± 1.30 |
| Dimer–myricetin at site I |
−81.22 ± 7.81 |
32.64 ± 0.21 |
| Dimer–compound 2 at site II |
−93.68 ± 8.38 |
20.18 ± 0.78 |
| Dimer–myricetin at site II |
−97.62 ± 9.09 |
16.24 ± 1.49 |
The destabilisation energies were calculated by deducting the interchain binding free energy of the dimer–ligand complexes from the interchain binding free energy of the free dimer. Based on the structure and energy analyses, it has been found that both compounds bound stronger to site II than site I and have shown the destabilisation energy about 16–33 kcal mol−1 (Table 8) in comparison to free dimer. These analyses revealed that the destabilisation of the dimer structure in the presence of compound 2 and myricetin is due to the decrease in the binding affinity between chains A and B of the dimer structure. It was observed that the end chain of the free dimer had more mobility, which is common with unconstraint MD simulation. During the MD simulations, both compounds interacted with the residues in the amyloidogenic regions of sites I and II. The key interactions (<−1.00 kcal mol−1 in Table 7) for compound 2 are Phe19 (chain A), Leu34 (chain A), Leu17 (chain B), Ile32 (chain B) and Leu34 (chain B) whereas the key interactions for the myricetin are Leu17 (chain A), Phe19 (chain A), Phe20 (chain A), Ile32 (chain A), Leu17 (chain B), Leu34 (chain B) and Val36 (chain B). These residues were also observed on previous simulations on other Aβ–ligand complexes which greatly contribute to the binding energy.42–44
3. Conclusions
In conclusion, a series of quinazolinone derivatives were evaluated as inhibitors of cholinesterases and self-induced Aβ aggregation. All the compounds showed good activity against both forms of cholinesterase with some selectivity for BuChE. Most of the compounds were also found to give levels of inhibition of Aβ aggregation, which were comparable or higher than those obtained for reference compounds, curcumin and myricetin. Docking and MD simulation experiments suggested that the compounds cause destabilisation of the dimer form of Aβ, thereby preventing further oligomerisation and aggregation. These investigations demonstrate the usefulness of a quinazoline-based ring scaffold in the design of multi-targeting agents to treat AD.
4. Experimental
4.1 Chemistry
The test compounds were synthesised as previously described,21–23 and their purity was checked by TLC, CHN analysis, and 1H and 13C-NMR spectroscopy. The Lipinski's rule of five parameters of the synthesised compounds were determined using Discovery Studio v3.1 (Accelrys Inc., San Diego, CA, USA).
4.2 Biological studies
Recombinant human AChE (2419 U mg−1), expressed in human embryonic kidney (HEK) 293 cells, lyophilised powder (E.C. No. 3.1.1.7), equine BuChE (≥500 U mg−1), acetylthiocholine (ATC) iodide, butyrylthiocholine (BTC) iodide, 5,5′-dithiobis(2-nitrobenzoic acid) (DTNB), donepezil, tacrine hydrochloride (A79922), propidium iodide (P4170), dimethyl sulfoxide (DMSO), methanol (MeOH) and ethanol (EtOH), di-sodium hydrogen orthophosphate dodecahydrate (Na2HPO4·12H2O), sodium dihydrogen orthophosphate (NaH2PO4·2H2O), sodium hydroxide (NaOH), thioflavin T, glycine, and hydrochloric acid (HCl) 37% were purchased from Sigma-Aldrich (St. Louis, MO, USA). β-Amyloid (Aβ) peptide (1–40) and Aβ peptide (1–42), lyophilised from HFIP solution were purchased from Anaspec (Fremont, CA, USA). The chemicals were of analytical grade. Instruments used included a UV/fluorescence spectrophotometer and multiplate reader, Infinite® M200 PRO multimode reader (Tecan Group Ltd., Männedorf, Switzerland), workstation and molecular modelling software.
4.2.1 In vitro inhibition of AChE and BuChE. To assess the inhibitory activity of the target compounds towards cholinesterases, the AChE and BuChE inhibition assays were performed in 96 well plates by the method of Ellman,24 with minor modifications. Sodium phosphate buffer (110 μL; pH 8.0) was added to each well followed by 20 μL of each test compound, 50 μL of 5,5′-dithiobis-(2-nitrobenzoic acid) (DTNB) (0.126 mM) and 20 μL of AChE or BuChE (0.15 units per mL). After 20 minutes of incubation at 37 °C, the reaction was then initiated by the addition of 50 μL (0.120 mM) of the substrate, acetylthiocholine (ATC) iodide or butyrylthiocholine (BTC) iodide (depending on the enzyme). The hydrolysis of ATC or BTC was monitored using an Infinite® M200 PRO multimode reader (Tecan Group Ltd., Männedorf, Switzerland) by measuring the absorbance due to the yellow 5-thio-2-nitrobenzoate anion at 412 nm, every 30 s for 25 min. Each condition was measured in triplicate. Donepezil, propidium iodide and tacrine were used as standard inhibitors. The percentage of inhibition was calculated from the equation:| | |
% inhibition = (E − S)/E × 100
| (1) |
where E is the activity of the enzyme without the test compound, and S is the activity of the enzyme with the test compound. IC50 values were obtained from concentration-inhibition experiments by nonlinear regression analysis using PRISM® v5.0 (GraphPad Inc., San Diego, CA, USA).
4.2.2 In vitro Inhibition of Aβ peptide aggregation. The Aβ peptide aggregation assays were performed by the method of LeVine et al.34 with minor modifications. Aβ peptide lyophilised from HFIP solution was dissolved in ammonium hydroxide [NH4OH, 1% (vol/vol) aqueous] followed by lyophilisation to yield a salt free fluffy white peptide and were stored over desiccant in glass jars at −80 °C. The Aβ peptide, was dissolved in 100 mM of NaOH to prepare a stock solution. Aliquots of Aβ were then incubated for 24 hours at 37 °C in 10 mM HEPES, 100 mM NaCl, 0.02% NaN3 (pH 7.4) buffer at a final Aβ concentration of 6 μM in the presence or absence of compounds or standard inhibitors curcumin and myricetin. To quantify amyloid fibril formation, the thioflavin T fluorescence method was used. Fluorescence was measured at 440 nm (λexcitation) and 485 nm (λemission) on Infinite® M200 PRO multimode reader (Tecan Group Ltd.). To determine amyloid fibril formation, after incubation, the solution containing Aβ or Aβ plus inhibitors were added to 50 mM gycine–NaOH buffer, pH 8.5, containing 5 μM thioflavin T in a final volume of 150 μL. Each assay was performed in triplicate. The percentage of inhibition was calculated by the following expression:| | |
% inhibition = 100 − (IFi/IFo × 100)
| (2) |
where, IFi and IFo are the fluorescence intensities obtained in the presence and in the absence of inhibitor, respectively, after subtracting the fluorescence of the respective blanks.
4.3 Molecular docking
Three-dimensional ligand structures were built using Chem Bio-3D v13 (CambridgeSoft, Cambridge, MA, USA) and saved in MOL2 format. These compounds were prepared in suitable protonation state according to physiological pH. Tacrine as the standard is protonated, whereas compound 2 is in the neutral form. The built structures were minimised using the HyperChem Pro 6.0 software (geometry optimisation − MM+) towards the lowest energy conformation. The crystal structures of human AChE (PDB ID: 4EY7) and BuChE (PDB ID: 4BDS), and NMR structure of an Aβ1–40 (PDB ID: 2LMN) were used for molecular docking using AutoDock v4.0. The original crystal structure of AChE contains donepezil, while BuChE is in complex with tacrine. The targets were prepared as follows: the heteroatoms and water molecules were removed using Discovery Studio Visualizer v3.1 (Accelrys Inc., San Diego, CA, USA). Hydrogens were added and double coordinates were corrected using HyperChem Pro v6.0 (Hypercube Inc., Gainesville, FL, USA). Then, again hydrogens were added, non-polar hydrogens were merged and the missing atoms were repaired using AutoDock Tools v1.5.6. The protonation states of the proteins were predicted using Propka,45 at neutral pH. Finally, gasteiger charges were added and AutoDock v4.0 type atoms were assigned to the protein. Docking was carried out using the hybrid Lamarckian genetic algorithm, with an initial population of 150 randomly placed individuals and a maximum number of 2![[thin space (1/6-em)]](https://www.rsc.org/images/entities/char_2009.gif) 500
500![[thin space (1/6-em)]](https://www.rsc.org/images/entities/char_2009.gif) 000 energy evaluations. Grid spacing was set to 0.375 Å and the root mean square deviation (RMSD) tolerance was set to 2.0 Å. The grid box was created by adjusting the default value to cover the entire protein. The docked pose of each ligand was selected on the basis of free energy of binding and cluster analysis. Ligand–protein interactions were analysed using Discovery Studio Visualizer v3.1, LigPlot v4.4.2,46 and PoseView.47
000 energy evaluations. Grid spacing was set to 0.375 Å and the root mean square deviation (RMSD) tolerance was set to 2.0 Å. The grid box was created by adjusting the default value to cover the entire protein. The docked pose of each ligand was selected on the basis of free energy of binding and cluster analysis. Ligand–protein interactions were analysed using Discovery Studio Visualizer v3.1, LigPlot v4.4.2,46 and PoseView.47
4.4 MD simulations
MD simulation was utilised to explore the interactions between protein–ligand complexes. The best poses of test compound 2 and standard inhibitors (tacrine and myricetin) with cholinesterases and Aβ1–40 peptide dimer (two binding sites: site I & site II) obtained from the docking studies, were submitted to additional MD simulation steps using the PMEMD.CUDA in Amber 14 package,31 with the Amber force field. The PDB2PQR server along with Propka software,45 was used to assign protonation states of proteins at physiological pH. The force field libraries for ligands were obtained from RESP server.48 To obtain the parameters and topologies for protein–ligand complexes, the antechamber and tleap modules were used and Ff12SB force field was assigned to the complexes. The AChE complexes were neutralised by adding sodium counterions whereas the BuChE complexes were neutralised by adding chloride counterions. The Aβ free dimer and complexes were neutralised by adding sodium counterions. The systems were then solvated with the TIP3P water molecules, 12 Å from the protein surface. The simulation systems of AChE–compound 2, AChE–tacrine, BuChE–compound 2 and BuChE–tacrine had a total of 69![[thin space (1/6-em)]](https://www.rsc.org/images/entities/char_2009.gif) 707, 68
707, 68![[thin space (1/6-em)]](https://www.rsc.org/images/entities/char_2009.gif) 819, 68
819, 68![[thin space (1/6-em)]](https://www.rsc.org/images/entities/char_2009.gif) 485 and 68
485 and 68![[thin space (1/6-em)]](https://www.rsc.org/images/entities/char_2009.gif) 640 atoms, respectively. The systems of Aβ–compound 2 and Aβ–myricetin at possible sites I, II were simulated. Total number of atoms are 30
640 atoms, respectively. The systems of Aβ–compound 2 and Aβ–myricetin at possible sites I, II were simulated. Total number of atoms are 30![[thin space (1/6-em)]](https://www.rsc.org/images/entities/char_2009.gif) 305 (free dimer), 30
305 (free dimer), 30![[thin space (1/6-em)]](https://www.rsc.org/images/entities/char_2009.gif) 298 (site I: Aβ–compound 2), 30
298 (site I: Aβ–compound 2), 30![[thin space (1/6-em)]](https://www.rsc.org/images/entities/char_2009.gif) 289 (site II: Aβ–compound 2), 30
289 (site II: Aβ–compound 2), 30![[thin space (1/6-em)]](https://www.rsc.org/images/entities/char_2009.gif) 302 (site I: Aβ–myricetin) and 30
302 (site I: Aβ–myricetin) and 30![[thin space (1/6-em)]](https://www.rsc.org/images/entities/char_2009.gif) 299 (site II: Aβ–myricetin). Before performing the MD simulations, relaxation, minimisation, heating and equilibration stages were carried out for the initial structures. At first, the complexes were subjected for relaxation and minimisation until the convergence criterion of 0.001 kcal mol−1 Å−1 was achieved using steepest descent and conjugate gradient to remove possible steric stress. The system was then slowly heated from 0 to 300 K within 60 ps. After the heating process, a further 200 ps of equilibration at 300 K was carried out to obtain a stable density. Production phase was then initiated and continued for 30 ns in an NVT ensemble. The time step used for the MD simulations was set to 2.0 fs, and one snapshot was sampled every 100 steps (i.e., every 0.2 ps). 500 conformations were extracted from the last 5 ns of MD simulations for MM-PBSA/GBSA analysis. All trajectory analysis was done with the Ptraj module,49 in Amber14 and examined visually using the Visual Molecular Dynamics (VMD),50 and Discovery Studio v4.0 programs. Plots of total energy variation and RMSD were generated using the Grace program.51
299 (site II: Aβ–myricetin). Before performing the MD simulations, relaxation, minimisation, heating and equilibration stages were carried out for the initial structures. At first, the complexes were subjected for relaxation and minimisation until the convergence criterion of 0.001 kcal mol−1 Å−1 was achieved using steepest descent and conjugate gradient to remove possible steric stress. The system was then slowly heated from 0 to 300 K within 60 ps. After the heating process, a further 200 ps of equilibration at 300 K was carried out to obtain a stable density. Production phase was then initiated and continued for 30 ns in an NVT ensemble. The time step used for the MD simulations was set to 2.0 fs, and one snapshot was sampled every 100 steps (i.e., every 0.2 ps). 500 conformations were extracted from the last 5 ns of MD simulations for MM-PBSA/GBSA analysis. All trajectory analysis was done with the Ptraj module,49 in Amber14 and examined visually using the Visual Molecular Dynamics (VMD),50 and Discovery Studio v4.0 programs. Plots of total energy variation and RMSD were generated using the Grace program.51
Author contributions
S. D. S.: biological evaluation, molecular modelling and manuscript preparation. F. L. F.: chemical synthesis. V. S. L., R. O. and M. J. C. B.: project design and co-ordination and manuscript preparation.
Conflicts of interest
There are no conflicts to declare.
Acknowledgements
The authors thank the University of Malaya for providing grants (PG034-2014A, RP037D-17AFR) to conduct this study; Prof. Dr Hapipah Mohd Ali and Dr Nura Suleiman Gwaram from the Department of Chemistry, Faculty of Science, University of Malaya for synthesis of compounds; Prof. Dr Chung Lip Yong from the Department of Pharmacy, Faculty of Medicine, University of Malaya for guidance in biological assays, Dr Ayesha Fatima and Vertika Gautam from the Department of Chemistry, Faculty of Science, University of Malaya for technical guidance in molecular dynamics simulation studies.
References
- Alzheimer's Association, Alzheimer's Dementia, 2017, vol. 13, pp. 325–373 Search PubMed.
- A. Comas Herrera, M. Prince, M. Knapp, M. Karagiannidou and M. Guerchet, World Alzheimer Report 2016: Improving healthcare for people with dementia. Coverage, quality and costs now and in the future, 2016 Search PubMed.
- D. Sheeja Malar, R. Beema Shafreen, S. Karutha Pandian and K. Pandima Devi, Pharm. Biol., 2017, 55, 381–393 CrossRef CAS PubMed.
- M. M. Mesulam, A. Guillozet, P. Shaw, A. Levey, E. G. Duysen and O. Lockridge, Neuroscience, 2002, 110, 627–639 CrossRef CAS PubMed.
- E. Giacobini, Pharmacol. Res., 2004, 50, 433–440 CrossRef CAS PubMed.
- J. Hardy and D. J. Selkoe, Science, 2002, 297, 353–356 CrossRef CAS PubMed.
- D. M. Walsh and D. J. Selkoe, J. Neurochem., 2007, 101, 1172–1184 CrossRef CAS PubMed.
- M. Decker, F. Krauth and J. Lehmann, Bioorg. Med. Chem., 2006, 14, 1966–1977 CrossRef CAS PubMed.
- F. H. Darras, S. Pockes, G. Huang, S. Wehle, A. Strasser, H. J. Wittmann, M. Nimczick, C. A. Sotriffer and M. Decker, ACS Chem. Neurosci., 2014, 5, 225–242 CrossRef CAS PubMed.
- Z. Li, B. Wang, J. Q. Hou, S. L. Huang, T. M. Ou, J. H. Tan, L. K. An, D. Li, L. Q. Gu and Z. S. Huang, J. Enzyme Inhib. Med. Chem., 2013, 28, 583–592 CrossRef CAS PubMed.
- G. Brunhofer, A. Fallarero, D. Karlsson, A. Batista-Gonzalez, P. Shinde, C. Gopi Mohan and P. Vuorela, Bioorg. Med. Chem., 2012, 20, 6669–6679 CrossRef CAS PubMed.
- M. Decker, Eur. J. Med. Chem., 2005, 40, 305–313 CrossRef CAS PubMed.
- F. H. Darras, S. Wehle, G. Huang, C. A. Sotriffer and M. Decker, Bioorg. Med. Chem., 2014, 22, 4867–4881 CrossRef CAS PubMed.
- L. Pan, J. H. Tan, J. Q. Hou, S. L. Huang, L. Q. Gu and Z. S. Huang, Bioorg. Med. Chem. Lett., 2008, 18, 3790–3793 CrossRef CAS PubMed.
- J. W. Yan, Y. P. Li, W. J. Ye, S. B. Chen, J. Q. Hou, J. H. Tan, T. M. Ou, D. Li, L. Q. Gu and Z. S. Huang, Bioorg. Med. Chem., 2012, 20, 2527–2534 CrossRef CAS PubMed.
- G. Huang, B. Kling, F. H. Darras, J. Heilmann and M. Decker, Eur. J. Med. Chem., 2014, 81, 15–21 CrossRef CAS PubMed.
- T. Mohamed and P. P. Rao, Eur. J. Med. Chem., 2017, 126, 823–843 CrossRef CAS PubMed.
- T. Mohamed, M. K. Mann and P. P. N. Rao, RSC Adv., 2017, 7, 22360–22368 RSC.
- T. Mohamed, A. Shakeri, G. Tin and P. P. Rao, ACS Med. Chem. Lett., 2016, 7, 502–507 CrossRef CAS PubMed.
- A. A. Reinke and J. E. Gestwicki, Chem. Biol. Drug Des., 2007, 70, 206–215 CAS.
- F. L. Faraj, M. Zahedifard, M. Paydar, C. Y. Looi, N. Abdul Majid, H. M. Ali, N. Ahmad, N. S. Gwaram and M. A. Abdulla, Sci. World J., 2014, 2014, 212096 Search PubMed.
- M. Zahedifard, F. L. Faraj, M. Paydar, C. Yeng Looi, M. Hajrezaei, M. Hasanpourghadi, B. Kamalidehghan, N. Abdul Majid, H. Mohd Ali and M. Ameen Abdulla, Sci. Rep., 2015, 5, 11544 CrossRef PubMed.
- M. Zahedifard, F. L. Faraj, M. Paydar, C. Y. Looi, P. Hasandarvish, M. Hajrezaie, B. Kamalidehghan, N. A. Majid, S. A. Khalifa, H. M. Ali, M. A. Abdulla and H. R. El-Seedi, Curr. Pharm. Des., 2015, 21, 3417–3426 CrossRef CAS PubMed.
- G. L. Ellman, K. D. Courtney, V. Andres Jr and R. M. Feather-Stone, Biochem. Pharmacol., 1961, 7, 88–95 CrossRef CAS PubMed.
- A. N. Cokugras, Butyrylcholinesterase: Structure and physiological importance, 2003 Search PubMed.
- S. M. Salga, H. M. Ali, M. A. Abdullah, S. I. Abdelwahab, L. K. Wai, M. J. Buckle, S. D. Sukumaran and A. H. Hadi, Molecules, 2011, 16, 9316–9330 CrossRef CAS PubMed.
- Z. Chen, A. J. Xu, R. Li and E. Q. Wei, Acta Pharmacol. Sin., 2002, 23, 355–360 CAS.
- A. Saxena, A. M. Redman, X. Jiang, O. Lockridge and B. P. Doctor, Biochemistry, 1997, 36, 14642–14651 CrossRef CAS PubMed.
- J. Cheung, M. J. Rudolph, F. Burshteyn, M. S. Cassidy, E. N. Gary, J. Love, M. C. Franklin and J. J. Height, J. Med. Chem., 2012, 55, 10282–10286 CrossRef CAS PubMed.
- F. Nachon, E. Carletti, C. Ronco, M. Trovaslet, Y. Nicolet, L. Jean and P. Y. Renard, Biochem. J., 2013, 453, 393–399 CrossRef CAS PubMed.
- D. A. Case, V. Babin, J. T. Berryman, R. M. Betz, Q. Cai, D. S. Cerutti, T. E. Cheatham III, T. A. Darden, R. E. Duke, H. Gohlke, A. W. Goetz, S. Gusarov, N. Homeyer, P. Janowski, J. Kaus, I. Kolossváry, A. Kovalenko, T. S. Lee, S. LeGrand, T. Luchko, R. Luo, B. Madej, K. M. Merz, F. Paesani, D. R. Roe, A. Roitberg, C. Sagui, R. Salomon-Ferrer, G. Seabra, C. L. Simmerling, W. Smith, J. Swails, R. C. Walker, J. Wang, R. M. Wolf, X. Wu and P. A. Kollman, AMBER 14, University of California, San Francisco, 2014 Search PubMed.
- W. Petrat, C. Wattanapiromsakul, T. Nualnoi, N. H. Sabri, V. S. Lee and L. Lomlim, Walailak J. Sci. Technol., 2017, 14, 687–701 Search PubMed.
- A. Hematpoor, S. Y. Liew, W. L. Chong, M. S. Azirun, V. S. Lee and K. Awang, PLoS One, 2016, 11, e0155265 Search PubMed.
- H. LeVine 3rd, Protein Sci., 1993, 2, 404–410 CrossRef CAS PubMed.
- A. T. Petkova, W. M. Yau and R. Tycko, Biochemistry, 2006, 45, 498–512 CrossRef CAS PubMed.
- B. Tarus, J. E. Straub and D. Thirumalai, J. Mol. Biol., 2005, 345, 1141–1156 CrossRef CAS PubMed.
- G. G. Tartaglia, A.
P. Pawar, S. Campioni, C. M. Dobson, F. Chiti and M. Vendruscolo, J. Mol. Biol., 2008, 380, 425–436 CrossRef CAS PubMed.
- R. Liu, C. McAllister, Y. Lyubchenko and M. R. Sierks, J. Neurosci. Res., 2004, 75, 162–171 CrossRef CAS PubMed.
- P. P. Rao, T. Mohamed and W. Osman, Bioorg. Med. Chem. Lett., 2013, 23, 239–243 CrossRef CAS PubMed.
- S. O. Garbuzynskiy, M. Y. Lobanov and O. V. Galzitskaya, Bioinformatics, 2010, 26, 326–332 CrossRef CAS PubMed.
- K. Gaurav, R. Srivastava and S. Virdi, World J. Pharmaceut. Res., 2014, 3, 2987–2999 Search PubMed.
- R. K. Saini, S. Shuaib and B. Goyal, J. Mol. Recognit., 2017, 30, e2656 CrossRef PubMed.
- Y. Qiao, M. Zhang, Y. n. Liang, J. Zheng and G. Liang, Phys. Chem. Chem. Phys., 2017, 19, 155–166 RSC.
- S. Shuaib and B. Goyal, J. Biomol. Struct. Dyn., 2017, 1–16 Search PubMed.
- T. J. Dolinsky, P. Czodrowski, H. Li, J. E. Nielsen, J. H. Jensen, G. Klebe and N. A. Baker, Nucleic Acids Res., 2007, 35, W522–W525 CrossRef PubMed.
- A. C. Wallace, R. A. Laskowski and J. M. Thornton, Protein Eng., 1995, 8, 127–134 CrossRef CAS PubMed.
- K. Stierand, P. C. Maass and M. Rarey, Bioinformatics, 2006, 22, 1710–1716 CrossRef CAS PubMed.
- E. Vanquelef, S. Simon, G. Marquant, E. Garcia, G. Klimerak, J. C. Delepine, P. Cieplak and F. Y. Dupradeau, Nucleic Acids Res., 2011, 39, W511–W517 CrossRef CAS PubMed.
- D. R. Roe and T. E. Cheatham 3rd, J. Chem. Theory Comput., 2013, 9, 3084–3095 CrossRef CAS PubMed.
- W. Humphrey, A. Dalke and K. Schulten, J. Mol. Graph., 1996, 14, 33–38 CrossRef CAS PubMed.
- Grace, http://plasma-gate.weizmann.ac.il/Grace/.
Footnote |
| † Electronic supplementary information (ESI) available. See DOI: 10.1039/c7ra11872d |
|
| This journal is © The Royal Society of Chemistry 2018 |
Click here to see how this site uses Cookies. View our privacy policy here.  Open Access Article
 *bd,
Rozana Othmanab and
Michael J. C. Buckle
 *ab
*ab
![[thin space (1/6-em)]](https://www.rsc.org/images/entities/char_2009.gif) log
log![[thin space (1/6-em)]](https://www.rsc.org/images/entities/char_2009.gif) P
P![[thin space (1/6-em)]](https://www.rsc.org/images/entities/char_2009.gif) log
log![[thin space (1/6-em)]](https://www.rsc.org/images/entities/char_2009.gif) P: logarithm of octanol–water partition coefficient; HBD: number of hydrogen bond donors; HBA: number of hydrogen bond acceptors; PSA: topological polar surface area.
P: logarithm of octanol–water partition coefficient; HBD: number of hydrogen bond donors; HBA: number of hydrogen bond acceptors; PSA: topological polar surface area.

![[1 with combining low line]](https://www.rsc.org/images/entities/char_0031_0332.gif)
![[. with combining low line]](https://www.rsc.org/images/entities/char_002e_0332.gif)
![[0 with combining low line]](https://www.rsc.org/images/entities/char_0030_0332.gif)
![[2 with combining low line]](https://www.rsc.org/images/entities/char_0032_0332.gif)
![[1 with combining low line]](https://www.rsc.org/images/entities/char_0031_0332.gif)
![[. with combining low line]](https://www.rsc.org/images/entities/char_002e_0332.gif)
![[3 with combining low line]](https://www.rsc.org/images/entities/char_0033_0332.gif)
![[0 with combining low line]](https://www.rsc.org/images/entities/char_0030_0332.gif)
![[1 with combining low line]](https://www.rsc.org/images/entities/char_0031_0332.gif)
![[. with combining low line]](https://www.rsc.org/images/entities/char_002e_0332.gif)
![[8 with combining low line]](https://www.rsc.org/images/entities/char_0038_0332.gif)
![[1 with combining low line]](https://www.rsc.org/images/entities/char_0031_0332.gif)
![[1 with combining low line]](https://www.rsc.org/images/entities/char_0031_0332.gif)
![[. with combining low line]](https://www.rsc.org/images/entities/char_002e_0332.gif)
![[5 with combining low line]](https://www.rsc.org/images/entities/char_0035_0332.gif)
![[5 with combining low line]](https://www.rsc.org/images/entities/char_0035_0332.gif)
![[1 with combining low line]](https://www.rsc.org/images/entities/char_0031_0332.gif)
![[. with combining low line]](https://www.rsc.org/images/entities/char_002e_0332.gif)
![[0 with combining low line]](https://www.rsc.org/images/entities/char_0030_0332.gif)
![[3 with combining low line]](https://www.rsc.org/images/entities/char_0033_0332.gif)
![[3 with combining low line]](https://www.rsc.org/images/entities/char_0033_0332.gif)
![[. with combining low line]](https://www.rsc.org/images/entities/char_002e_0332.gif)
![[4 with combining low line]](https://www.rsc.org/images/entities/char_0034_0332.gif)
![[1 with combining low line]](https://www.rsc.org/images/entities/char_0031_0332.gif)
![[4 with combining low line]](https://www.rsc.org/images/entities/char_0034_0332.gif)
![[. with combining low line]](https://www.rsc.org/images/entities/char_002e_0332.gif)
![[6 with combining low line]](https://www.rsc.org/images/entities/char_0036_0332.gif)
![[6 with combining low line]](https://www.rsc.org/images/entities/char_0036_0332.gif)
![[4 with combining low line]](https://www.rsc.org/images/entities/char_0034_0332.gif)
![[. with combining low line]](https://www.rsc.org/images/entities/char_002e_0332.gif)
![[6 with combining low line]](https://www.rsc.org/images/entities/char_0036_0332.gif)
![[5 with combining low line]](https://www.rsc.org/images/entities/char_0035_0332.gif)
![[3 with combining low line]](https://www.rsc.org/images/entities/char_0033_0332.gif)
![[. with combining low line]](https://www.rsc.org/images/entities/char_002e_0332.gif)
![[8 with combining low line]](https://www.rsc.org/images/entities/char_0038_0332.gif)
![[4 with combining low line]](https://www.rsc.org/images/entities/char_0034_0332.gif)


![[thin space (1/6-em)]](https://www.rsc.org/images/entities/char_2009.gif) 500
500![[thin space (1/6-em)]](https://www.rsc.org/images/entities/char_2009.gif) 000 energy evaluations. Grid spacing was set to 0.375 Å and the root mean square deviation (RMSD) tolerance was set to 2.0 Å. The grid box was created by adjusting the default value to cover the entire protein. The docked pose of each ligand was selected on the basis of free energy of binding and cluster analysis. Ligand–protein interactions were analysed using Discovery Studio Visualizer v3.1, LigPlot v4.4.2,46 and PoseView.47
000 energy evaluations. Grid spacing was set to 0.375 Å and the root mean square deviation (RMSD) tolerance was set to 2.0 Å. The grid box was created by adjusting the default value to cover the entire protein. The docked pose of each ligand was selected on the basis of free energy of binding and cluster analysis. Ligand–protein interactions were analysed using Discovery Studio Visualizer v3.1, LigPlot v4.4.2,46 and PoseView.47
![[thin space (1/6-em)]](https://www.rsc.org/images/entities/char_2009.gif) 707, 68
707, 68![[thin space (1/6-em)]](https://www.rsc.org/images/entities/char_2009.gif) 819, 68
819, 68![[thin space (1/6-em)]](https://www.rsc.org/images/entities/char_2009.gif) 485 and 68
485 and 68![[thin space (1/6-em)]](https://www.rsc.org/images/entities/char_2009.gif) 640 atoms, respectively. The systems of Aβ–compound 2 and Aβ–myricetin at possible sites I, II were simulated. Total number of atoms are 30
640 atoms, respectively. The systems of Aβ–compound 2 and Aβ–myricetin at possible sites I, II were simulated. Total number of atoms are 30![[thin space (1/6-em)]](https://www.rsc.org/images/entities/char_2009.gif) 305 (free dimer), 30
305 (free dimer), 30![[thin space (1/6-em)]](https://www.rsc.org/images/entities/char_2009.gif) 298 (site I: Aβ–compound 2), 30
298 (site I: Aβ–compound 2), 30![[thin space (1/6-em)]](https://www.rsc.org/images/entities/char_2009.gif) 289 (site II: Aβ–compound 2), 30
289 (site II: Aβ–compound 2), 30![[thin space (1/6-em)]](https://www.rsc.org/images/entities/char_2009.gif) 302 (site I: Aβ–myricetin) and 30
302 (site I: Aβ–myricetin) and 30![[thin space (1/6-em)]](https://www.rsc.org/images/entities/char_2009.gif) 299 (site II: Aβ–myricetin). Before performing the MD simulations, relaxation, minimisation, heating and equilibration stages were carried out for the initial structures. At first, the complexes were subjected for relaxation and minimisation until the convergence criterion of 0.001 kcal mol−1 Å−1 was achieved using steepest descent and conjugate gradient to remove possible steric stress. The system was then slowly heated from 0 to 300 K within 60 ps. After the heating process, a further 200 ps of equilibration at 300 K was carried out to obtain a stable density. Production phase was then initiated and continued for 30 ns in an NVT ensemble. The time step used for the MD simulations was set to 2.0 fs, and one snapshot was sampled every 100 steps (i.e., every 0.2 ps). 500 conformations were extracted from the last 5 ns of MD simulations for MM-PBSA/GBSA analysis. All trajectory analysis was done with the Ptraj module,49 in Amber14 and examined visually using the Visual Molecular Dynamics (VMD),50 and Discovery Studio v4.0 programs. Plots of total energy variation and RMSD were generated using the Grace program.51
299 (site II: Aβ–myricetin). Before performing the MD simulations, relaxation, minimisation, heating and equilibration stages were carried out for the initial structures. At first, the complexes were subjected for relaxation and minimisation until the convergence criterion of 0.001 kcal mol−1 Å−1 was achieved using steepest descent and conjugate gradient to remove possible steric stress. The system was then slowly heated from 0 to 300 K within 60 ps. After the heating process, a further 200 ps of equilibration at 300 K was carried out to obtain a stable density. Production phase was then initiated and continued for 30 ns in an NVT ensemble. The time step used for the MD simulations was set to 2.0 fs, and one snapshot was sampled every 100 steps (i.e., every 0.2 ps). 500 conformations were extracted from the last 5 ns of MD simulations for MM-PBSA/GBSA analysis. All trajectory analysis was done with the Ptraj module,49 in Amber14 and examined visually using the Visual Molecular Dynamics (VMD),50 and Discovery Studio v4.0 programs. Plots of total energy variation and RMSD were generated using the Grace program.51


