 Open Access Article
Performance evaluation of zero-valent iron nanoparticles (NZVI) for high-concentration H2S removal from biogas at different temperatures
Lianghu Su a,
Chenwei Liua,
Kangkang Lianga,
Yudong Chena,
Longjiang Zhang*a,
Xiaolin Lia,
Zhihua Hana,
Guangyin Zhenb,
Xiaoli Chaic and
Xu Sun*a
aNanjing Institute of Environmental Sciences of the Ministry of Environmental Protection, 210042, Nanjing, PR China. E-mail: zlj@nies.org; sunxu98418@163.com
bShanghai Key Lab for Urban Ecological Processes and Eco-Restoration, School of Ecological and Environmental Sciences, East China Normal University, Shanghai 200241, PR China
cThe State Key Laboratory of Pollution Control and Resource Reuse, School of Environmental Science and Engineering, Tongji University, 200092, Shanghai, PR China
First published on 12th April 2018
Abstract
The removal performance of high-concentration H2S (ca. 10![[thin space (1/6-em)]](https://www.rsc.org/images/entities/char_2009.gif) 000 ppm) from simulated biogas by zero-valent iron nanoparticles (NZVI), with the majority of the particles in the size range of 60–150 nm, at different reaction temperatures (room temperature, 100 °C, 200 °C and 250 °C) were evaluated using a custom-designed quartz fixed-bed reactor. The results showed that the H2S removal capacities of NZVI were quite limited at room temperature and 100 °C, being 12.56 and 14.77 mg H2S gNZVI−1, respectively. However, these values increased significantly to 391.02 (200 °C) and 488.95 (250 °C) mg H2S gNZVI−1. Scanning electron microscopy analysis showed that the products of the NZVI–H2S reaction aggregated to form irregular polygonal-shaped structures. The main X-ray diffraction pattern peaks of the product matched well with troilite, and no pyrite was observed. The deconvolution of the X-ray photoelectron spectrometry peaks showed the presence of monosulphide (S2−) and disulphide (S22−) in the product, in which 36% of the sulphur existed as monosulphide and 64% as disulphide. It is proposed that the effective removal of hydrogen sulphide by NZVI at elevated temperatures can be attributed to the combination of nano-constituents, oxide shell and underlying Fe core to produce FeS similar to troilite and amorphous FeS2.
000 ppm) from simulated biogas by zero-valent iron nanoparticles (NZVI), with the majority of the particles in the size range of 60–150 nm, at different reaction temperatures (room temperature, 100 °C, 200 °C and 250 °C) were evaluated using a custom-designed quartz fixed-bed reactor. The results showed that the H2S removal capacities of NZVI were quite limited at room temperature and 100 °C, being 12.56 and 14.77 mg H2S gNZVI−1, respectively. However, these values increased significantly to 391.02 (200 °C) and 488.95 (250 °C) mg H2S gNZVI−1. Scanning electron microscopy analysis showed that the products of the NZVI–H2S reaction aggregated to form irregular polygonal-shaped structures. The main X-ray diffraction pattern peaks of the product matched well with troilite, and no pyrite was observed. The deconvolution of the X-ray photoelectron spectrometry peaks showed the presence of monosulphide (S2−) and disulphide (S22−) in the product, in which 36% of the sulphur existed as monosulphide and 64% as disulphide. It is proposed that the effective removal of hydrogen sulphide by NZVI at elevated temperatures can be attributed to the combination of nano-constituents, oxide shell and underlying Fe core to produce FeS similar to troilite and amorphous FeS2.
1. Introduction
Biogas is produced from the anaerobic treatment of sewage sludge, the organic fraction of municipal solid wastes (OFMSW), animal manures or organic agro-industrial wastes.1 The biogas produced by all these activities is rich in CH4 (typically 35–75%), and its higher heating value is between 15 and 30 MJ Nm−3.2 Biogas is a versatile renewable energy source and can be employed for combined heat and power (CHP), to produce compressed natural gas (CNG), as a drop-in replacement for gasoline, diesel, and jet fuel hydrocarbons or in advanced oxygenated fuels such as methanol and dimethyl ether (DME).3,4Sulphur compounds are common contaminants in biogas. Typical H2S concentrations from manures and sewage sludge are 200–1500 ppm, with some reports of concentrations as high as 10![[thin space (1/6-em)]](https://www.rsc.org/images/entities/char_2009.gif) 000 ppm.5 H2S is generated both from the anaerobic degradation of sulphur-bearing organic molecules (mainly proteins) and through sulphate reduction by sulphate-reducing bacteria (SRB). With respect to landfills, construction and demolition debris, especially wallboard, which is largely composed of gypsum, degrade with relatively large releases of H2S.3 The H2S in biogas must be removed according to its downstream usage, as it can reduce the lifetime of metal pipework, combustion engines and compressors by corrosion and cause the release of harmful sulphur oxides (SOx) as an air pollutant.3,6 The maximum acceptable H2S content is ca. 100–500 mg Nm−3 when biogas is used for combined heat and power, depending on the specific manufacturer, and the concentration should be further reduced to less than 5 mg Nm−3 when used as fuel for vehicles.7 In China, when biogas is to be upgraded to pipeline-quality natural gas, the H2S concentration should be less than 6 mg Nm−3 to meet the requirement of standard natural gas (GB 17820-2012).8
000 ppm.5 H2S is generated both from the anaerobic degradation of sulphur-bearing organic molecules (mainly proteins) and through sulphate reduction by sulphate-reducing bacteria (SRB). With respect to landfills, construction and demolition debris, especially wallboard, which is largely composed of gypsum, degrade with relatively large releases of H2S.3 The H2S in biogas must be removed according to its downstream usage, as it can reduce the lifetime of metal pipework, combustion engines and compressors by corrosion and cause the release of harmful sulphur oxides (SOx) as an air pollutant.3,6 The maximum acceptable H2S content is ca. 100–500 mg Nm−3 when biogas is used for combined heat and power, depending on the specific manufacturer, and the concentration should be further reduced to less than 5 mg Nm−3 when used as fuel for vehicles.7 In China, when biogas is to be upgraded to pipeline-quality natural gas, the H2S concentration should be less than 6 mg Nm−3 to meet the requirement of standard natural gas (GB 17820-2012).8
Nanoscale zero-valent iron (NZVI) has been used widely for treating hazardous and toxic wastes9,10 due to its diminutive size, large specific surface area and elevated reactivity for rapid contaminant transformation. It is well known that NZVI has an ability for the sequestration of sulphide compounds effectively in an aqueous environment. When situated in an aqueous environment, NZVI will undergo surface hydroxylation to form a thin oxide layer with a thickness of ca. 2–4 nm on the surface and between the individual particles. The amorphous oxide layer consists of a mixed phase of Fe(II)/Fe(III) in proximity to the metallic core and a phase of predominantly Fe(III) oxide near the water interface,11,12 with a stoichiometry close to FeOOH.13,14 The amorphous oxide layer possesses the ability to sequester sulphide. Li et al. showed that H2S can be immobilized on the NZVI surface effectively as disulphide and monosulphide species when the NZVI is present in an H2S solution.15 The use of NZVI for sulphide removal from digested piggery wastewater was conducted by Chaung et al.16 The reported results showed that the complexity of the digested wastewater constituents limited the effectiveness of NZVI. We also reported in previous studies the long-term effectiveness of the in situ removal of H2S by NZVI in an anaerobic sewage sludge digester,4,17,18 revealing that elimination of H2S occurred via the reaction with the oxide shell of NZVI to mainly form FeS and some FeS2 and S0.
Few previous studies have focused on the elimination of H2S by zero-valent iron nanoparticles (NZVI) in a dry process. The objectives of this study were (1) to evaluate the potential of NZVI for sulphide removal at different temperatures in a dry process; (2) to clarify the products and mechanism of the NZVI–sulphide reaction by different analysis technologies, such as X-ray diffraction, thermal gravimetric and differential thermal gravimetric, scanning electron microscopy-energy dispersive spectroscopy and X-ray photoelectron spectrometry.
2. Materials and methods
2.1. Test materials
Zero-valent iron nanoparticles (NZVI, on a 99.9% metal basis) were obtained from Shanghai Macklin Biochemical Co., Ltd. (Shanghai, China) without further treatment. Quartz wool (5–9 μm) was purchased from Aladdin Co. Ltd. in China. Quartz sand (100-mesh) was purchased from Qingdao Usolf Chemical Technology Co., Ltd.2.2. H2S removal experiments
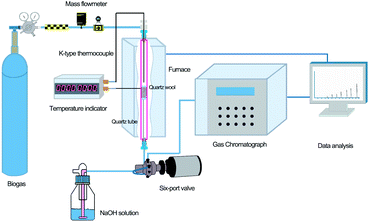
The H2S removal tests were carried out in a custom-designed quartz fixed-bed reactor, as shown in Fig. 1. A furnace (HF-500, Hunan Huashi equipment Co., Ltd) was used to provide uniform heating to the sample in the quartz column. Two K-type thermocouples were used to monitor the temperature of the furnace and reaction column, respectively. A mass flowmeter (S48 32/HMT, Horiba Meteron, China) was used to control the biogas flow into the quartz column.The reactor exit was connected to a six-port Valco GC valve (VICI, Valco, Houston, TX, USA) and the H2S concentration was monitored on-line (every 6.2 min) using a gas chromatograph (Sp-3420A, Beijing BFRL Analytical Instrument Co., Ltd., China) equipped with a flame ionization detector (FID) and a Hayesep R column (4′ × 1/8′). The breakthrough capacity was determined at an exit H2S concentration equal to the 30% of inlet concentration. All reactions were carried out under a fume hood due to the high toxicity of H2S.
Exactly 50 mg of NZVI and 0.95 g of 100-mesh quartz sand were mixed adequately to avoid possible channelling, and then were packed in a quartz column (8 mm i.d., at a fixed height of 270 mm). Quartz wool was packed at both the bottom and top of the NZVI/quartz sand mixture to facilitate the diffusion of gas.19 A synthetic mix of CH4 (60%), CO2 (39%) and H2S (1%) was provided by Nanjing Tianze Gas Co. Ltd. Removal capacities of H2S, expressed as x/M (mg H2S g−1 of material), were calculated according to Ros et al.20 by integrating the corresponding breakthrough curves and applying eqn (1).
 | (1) |
2.3. Analytical methods
For the X-ray diffraction analysis, a D8 Advance X-ray diffractometer (Bruker AXS Inc., Germany) was employed with an accelerating voltage of 40 kV and a current of 40 mA. The samples were examined at room temperature over the 2θ range of 10–90° using graphite-monochromated Cu Kα radiation. The step scan was 0.02°, and the measuring time increments were 0.1 s step−1. The diffractograms were obtained with Diff-plus and analysed using MDI Jade 6.0 software.For the scanning electron microscopy and energy dispersive spectroscopy analyses, both the NZVI and the NZVI–H2S reaction product were prepared using double-sided carbon tape coated with platinum and were performed on a Hitachi S-4800 SEM equipped with a Bruker energy dispersive spectroscopy detector. Thermal gravimetric analysis and differential thermal gravimetric analysis were performed using a Mettler Toledo TGA2. The samples were heated from room temperature to 1000 °C at a heating rate of 10 °C min−1 under air atmosphere.
X-ray photoelectron spectrometry experiments were carried out on an RBD upgraded PHI-5000C ESCA system (Perkin Elmer) with Mg Kα radiation (hν = 1253.6 eV) or Al Kα radiation (hν = 1486.6 eV), according to Shen et al.21 In general, the X-ray anode was run at 250 W and the high voltage was kept at 14.0 kV with a detection angle at 54°. The pass energy was fixed at 23.5, 46.95 or 93.90 eV to ensure sufficient resolution and sensitivity. The base pressure of the analyser chamber was approximately 5 × 10⁻⁸ Pa. The sample was directly pressed into a self-supported disk (10 × 10 mm), mounted on a sample holder and then transferred into the analyser chamber. The complete spectra (0–1100 (1200) eV) and the narrow spectra of all the elements with much higher resolution were both recorded by using a RBD 147 interface (RBD Enterprises, USA) through the AugerScan 3.21 software. Binding energies were calibrated by using the containment carbon (C 1s = 284.6 eV). The data analysis was carried out by using the XPSPeak 4.1, while the Lorentzian–Gaussian (%) was fixed to 20% for the sulphur component.
3. Results and discussion
3.1. Effect of temperature on H2S removal
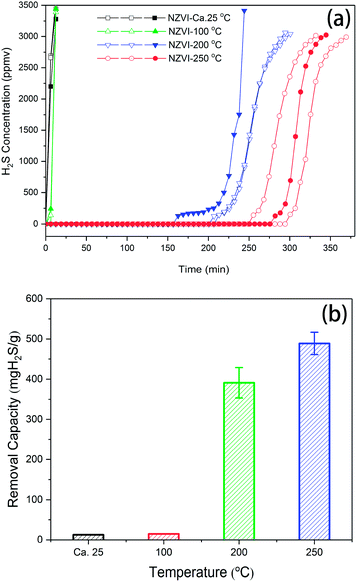
The performance of NZVI for H2S removal as a function of time was tested at different temperatures, as shown in Fig. 2a. At room temperature (ca. 25 °C) and 100 °C, the breakthrough time measured for NZVI was quite short, indicating its low capacity for H2S removal. The H2S concentrations of the effluent of biogas were 2518 ± 225.1 and 126.9 ± 98.96 ppm after 6.2 minutes at 25 °C and 100 °C, respectively. When the reaction temperature was elevated to 200 °C and 250 °C, the breakthrough times were prolonged dramatically, no H2S was detected within 256 min and 388 min, respectively. After that, the curves of H2S concentration of the effluent were sigmoidal or S-shape at 200 °C and 250 °C. The removal capacities were derived from the curves, in which the breakthrough point was defined by 30% of the inlet concentration (3000 ppm). These are also shown in Fig. 2b. The H2S removal capacities are 12.56 ± 0.43 and 14.77 ± 0.10 mg H2S gNZVI−1, respectively, at 25 °C and 100 °C. However, when NZVI was exposed to H2S (ca. 10![[thin space (1/6-em)]](https://www.rsc.org/images/entities/char_2009.gif) 000 ppm) at 200 and 250 °C, it presents breakthrough capacities as high as 391.03 ± 37.73 and 488.95 ± 27.72 mg H2S gNZVI−1, respectively. When biogas is used for combined heat and power, assumed that the maximum acceptable H2S content is 500 mg Nm−3, then the capacity of this setup for H2S removal is 333.33 ± 9.44 and 423.10 ± 23.70 mg H2S gNZVI−1.
000 ppm) at 200 and 250 °C, it presents breakthrough capacities as high as 391.03 ± 37.73 and 488.95 ± 27.72 mg H2S gNZVI−1, respectively. When biogas is used for combined heat and power, assumed that the maximum acceptable H2S content is 500 mg Nm−3, then the capacity of this setup for H2S removal is 333.33 ± 9.44 and 423.10 ± 23.70 mg H2S gNZVI−1.
3.2. Scanning electron microscopy and energy dispersive spectroscopy analysis
Scanning electron microscopy analysis indicates that the pure NZVI particles were generally spherical in shape with the majority in the size range of 60–150 nm, and the iron nanoparticles are connected into chain-like structures possibly due to chemical aggregation, as shown in Fig. 3a. The energy dispersive spectroscopy for pure NZVI particles showed the presence of Fe and O (Fe: 95.17%, O: 4.83% (wt)) in this structure, the relatively high content of O can be explained by the presence of an oxide shell at the surface of the iron nanoparticles as they age,4,22 which was further confirmed by X-ray diffraction analysis.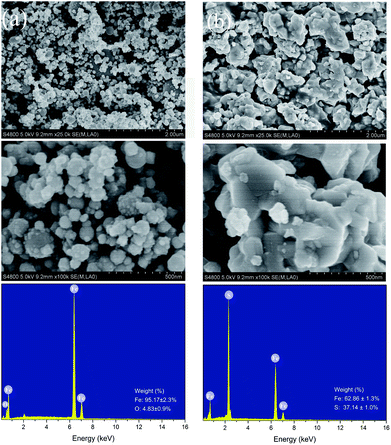 | ||
| Fig. 3 Scanning electron microscopy and energy dispersive spectra of NZVI (a) and NZVI–H2S reaction product (b) at 250 °C. | ||
To avoid the disturbance of quartz sand on the morphology analysis of the reaction product, the NZVI–H2S reaction product at 250 °C without quartz sand was further characterized by scanning electron microscopy and energy dispersive spectroscopy, as shown in Fig. 3b. The structure of NZVI changed significantly after reaction. Compared with the unreacted NZVI, the space between the nanoparticles decreased remarkably, while the products of the NZVI–H2S reaction were piled up to form irregular polygonal-shaped structures. The subsequent energy dispersive spectroscopy analysis showed that the presence of Fe and S (Fe: 62.86%, S: 37.14% (wt)). No elemental O was identified in the new structure, implying the depletion of O element to produce H2O (g) in this process. Based on energy dispersive spectroscopy analysis, the atom and weigh ratios of Fe![[thin space (1/6-em)]](https://www.rsc.org/images/entities/char_2009.gif) :
:![[thin space (1/6-em)]](https://www.rsc.org/images/entities/char_2009.gif) S are approximately 0.97 and 1.7, respectively.
S are approximately 0.97 and 1.7, respectively.
Additional experiment was conducted to analysis the difference of materials on bottom/top/inside after H2S removal. After reaction at 250 °C, the materials at different layers were separated carefully and further characterized by scanning electron microscopy-energy dispersive spectroscopy, as showed in Fig. 4. According to the scanning electron microscopy analysis, the products of the NZVI–H2S reaction from different layers were all aggregated to form irregular polygonal-shaped structures, while the spacing between particles of the inside and bottom layer decreased obviously compared to the top layer. Energy dispersive spectroscopy showed that the contents of S were 33.96 ± 0.65%, 34.80 ± 0.53%, 32.32 ± 0.62%, respectively, from the materials on top, inside and bottom layer (Fig. 4). With respect to content of elemental S and Fe, no significant different was found at different layers.
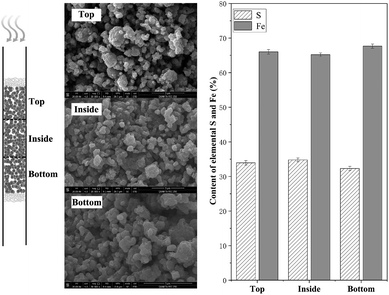 | ||
| Fig. 4 Scanning electron microscopy and energy dispersive spectroscopy of NZVI–H2S reaction product on bottom/top/inside at 250 °C. | ||
3.3. X-ray diffraction analysis
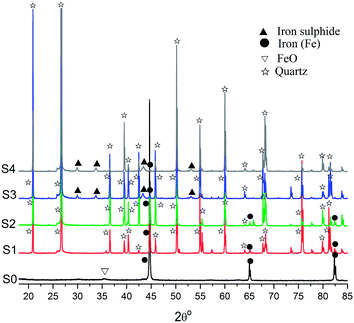
Fig. 5 compared the X-ray diffraction patterns of untreated NZVI and NZVI–H2S reaction products at different temperatures in the presence of quartz sand. With respect to untreated NZVI, the main peaks at the 2θ of 44.7°, 65.0° and 82.3° indicate the presence of metallic Fe (Fe0), while the weak peak at the 2θ of 35.8° showed the presence of iron oxide crystalline phases. After treated with H2S at room temperature and 100 °C, the peaks represent zero-valent iron were also identified, although the intensity is lower due to the dilution of quartz sand (Fig. 5). No S-containing crystalline phase were characterized in the X-ray diffraction spectra at room temperature and 100 °C. At elevated temperature, weak peaks of iron sulphide at the 2θ of 29.9°, 33.7°, 43.2° and 53.1° appeared, and the peak intensities of zero-valent iron decreased significantly. The phenomenon indicated that H2S is immobilized by NZVI at the temperature above 200 °C effectively and that most of the nanoscale iron particles were depleted to form iron sulphide during this process. An increase in the intensity of iron sulphide was also recorded when the reaction temperature increased from 200 to 250 °C.The NZVI–H2S reaction product at 250 °C without quartz sand was further characterized by X-ray diffraction, as shown in Fig. 6. The X-ray diffraction study shows that the reaction product is crystalline and composed primarily of Fe sulphides with a small amount of metallic Fe. The presence of metallic Fe can be partly explained by the unreacted metallic Fe due to channelling. The main peaks of iron sulphide are at the 2θ of 18.7°, 29.9°, 33.7°, 43.2°, 47.1°, 52.2°, 53.1° and 70.8°. The pattern of the sample displayed sharp peaks that matched well with the PDF card for troilite (89-3030), and no pyrite was observed.
 | ||
| Fig. 6 X-ray diffraction spectra of the crystalline phase of NZVI–H2S reaction product at 250 °C without quartz sand. | ||
3.4. Thermal gravimetric and differential thermal gravimetric analysis
Fig. 7 shows the thermal gravimetric and differential thermal gravimetric data of the NZVI–H2S reaction product at 250 °C without quartz sand. The iron-to-sulphur ratio was determined by TGA. Assuming an initial stoichiometry of FexS of sample after sulphidation, values of x = 1.02 were determined. The data collected in air showed a gain in mass during room temperature to 400 °C, and this simply might be attributed to the oxidation of unreacted metallic Fe. After that, significant weight losses were detected at 400–450 °C and 540–670 °C can be due to the final oxidation to Fe2O3. The TG curve under air is similar with troilite prepared via the nonhydrolytic sol–gel reaction.23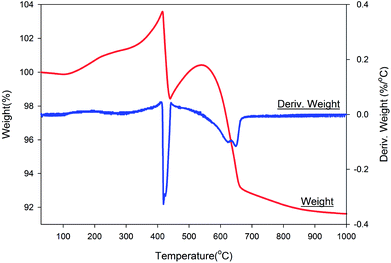 | ||
| Fig. 7 Thermal gravimetric and differential thermal gravimetric analyses data of NZVI–H2S reaction product upon heating under air. | ||
3.5. X-ray photoelectron spectrometry analysis
To investigate the composition and chemical state, the X-ray photoelectron spectrometry survey of the iron nanoparticles of untreated NZVI and NZVI–H2S reaction (without quartz sand) at 250 °C were carried out. The full-range X-ray photoelectron spectrometry survey spectra showed that the major elements of NZVI–H2S product were iron (Fe), sulphur (S), oxygen (O) and carbon (C), while the S 2p spectra indicated the presence of sulphur species (Fig. 8).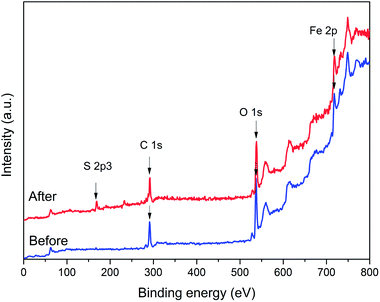 | ||
| Fig. 8 Full-range X-ray photoelectron spectrometry survey spectra of NZVI before and after reaction with H2S. | ||
The S 2p narrow scans showed that no signal corresponding to the presence of sulphur was detected with respect to untreated NZVI (Fig. 9a). After reaction with H2S, due to the S 2p peak having closely spaced spin–orbit components with Δ = 1.16 eV and intensity ratio = 0.511,24,25 the spectrum can be deconvoluted into four overlapped peaks, with the S 2p 3/2 peak binding energies at 160.8 and 161.5 eV. According to the literature data, these two peaks should correspond to disulphide (S22−) and monosulphide (S2−),15 respectively. The areas of the fitting curves were further calculated, and the results showed that approximately 36% of the sulphur on the surface existed as monosulphide and 64% as disulphide after the NZVI–H2S reaction at 250 °C.
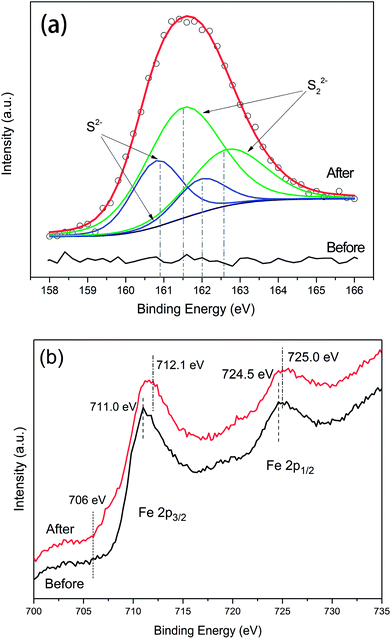 | ||
| Fig. 9 X-ray photoelectron spectrometry responses for S 2p levels (a) and Fe 2p levels (b) of untreated NZVI and the NZVI–H2S reaction product at 250 °C. | ||
The X-ray photoelectron spectrometry survey of the Fe 2p of NZVI is shown in Fig. 9b. The binding energies of Fe 2p 3/2 and Fe 2p 1/2 for untreated NZVI were 711.0 eV and 724.5 eV, respectively. No distinct peak at approximately 706–707 eV was observed for untreated NZVI, in contrast to the results reported by Wen et al.,26 confirming the presence of an oxide shell at the surface of the iron nanoparticles. A small peak at 707.0 eV was recorded with fresh NZVI by Wen et al.,26 suggesting the presence of zero-valent iron (Fe0).27 This difference can be explained by the ageing of the NZVI used in this study. After reacting with H2S, the binding energies at 712.1 eV and 725 eV were assigned to Fe 2p 3/2 and Fe 2p 1/2. The separation of the Fe 2p 3/2 and Fe 2p 1/2 spin–orbit levels was 12.90 eV. The shift of the binding energies of Fe to the higher binding energy after reaction probably indicated the formation of iron sulphide.
3.6. Discussion
The mechanism of H2S removal in the presence of NZVI at elevated temperature is quite different from that in an aqueous environment. Yan et al.12 reported the inevitable reactions of NZVI with water to produce a thin amorphous oxide layer (thickness of ca. 2–4 nm), with an approximate stoichiometry of FeOOH, at the agglomerate surface and between the individual particles, as shown in eqn (2).| Fe0 + 2H2O = FeOOH + 1.5H2 (g) | (2) |
The sulphide can effectively react with the hydrous Fe(II)/Fe(III) oxide layers of the nanoparticles via eqn (3) and (4) in an aqueous environment, in which S2− was immobilized as FeS or FeS2 or oxidized to elemental sulphur:
| 2FeOOH + 3H2S = 2FeS + 1/8S8 + 4H2O | (3) |
| 2FeOOH + 3H2S = FeS2 + FeS + 4H2O | (4) |
It is well addressed that metal particles are oxidized when exposed to air or O, regardless of the synthesis method or particle morphology.28 Wang et al. further observed that iron nanoparticles will be instantly covered by an oxide shell that is typically ∼3 nm thick when exposed to air at room temperature.22 This was consistent with our X-ray diffraction, energy dispersive spectroscopy and X-ray photoelectron spectrometry results. Research efforts have been conducted to clarify whether the oxide shell is FeO, α-Fe2O3, γ-Fe2O3, Fe3O4, an unknown phase, or a combination of several phases, using X-ray diffraction spectroscopy, electron diffraction, transmission electron microscopic imaging, and electron energy loss spectroscopy (EELS). Signorini et al. speculated that the structure of the oxide shell on the Fe nanoparticle varies as a function of the distance from the underlying Fe core; i.e., the outer surface of the oxide shell is expected to be γ-Fe2O3 and the inner region that is adjacent to the Fe core is expected to be Fe3O4.29 Wang et al. reported that the fine structural features are similar to those exhibited by Fe3O4, but with differences in the peak intensities and position, while no phase transition in the oxide shell was characterized.22 Moreover, Wang et al. showed that the oxide shell in the core–shell structured Fe nanoparticle is highly defective compared to the bulk form.22
Though present at the surface of the iron nanoparticles exposed to air, the thick layer of Fe oxide cannot fully account for the high sulphide removal capacity. According to the scanning electron microscopy and energy dispersive spectroscopy analysis, the content of elemental O in the NZVI used is only 4.83%, indicating that the iron nanoparticles were far from being fully oxidized. Due to the absence of oxygen in simulated biogas, any increase in the formation of the oxide shell layer will be negligible during the reaction process even at elevated temperatures. Regardless of the formation of the oxide shell, electrons are still allowed to pass into the metal core,12 and the underlying Fe core also contributes significantly to sulphide removal. Additional experiments on zero-valent iron (100-mesh, 400-mesh and 800-mesh) were conducted, and the results are shown in Fig. 10. Generally, the sulphide removal capacities increase with increased reaction temperatures, but do not depend on the particle diameter of ZVI. Even though the sulphide removal increases with temperature, only 19.66, 23.12 and 15.15 mg H2S gZVI−1 were achieved, respectively, for 100-mesh, 400-mesh and 800-mesh ZVI at a reaction temperature of 250 °C. This phenomenon suggested that the decrease in the ZVI particle diameter, from microscale to nanoscale, significantly enhanced the reaction activity of Fe0–sulphide. The inevitable production of H2 from the Fe0–sulphide reaction, rather than the H2O formed during the iron oxides–sulphide reaction, would benefit the further utilization of biogas due to its high calorific value.
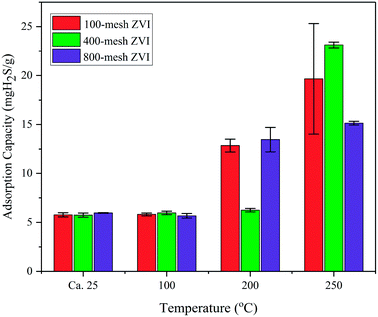 | ||
| Fig. 10 H2S removal capacities of NZVI (100-mesh, 400-mesh and 800-mesh) at different temperatures (room temperature, 100 °C, 200 °C, and 250 °C). | ||
The iron-to-sulphur ratio of the NZVI–sulphide reaction products at 250 °C were 0.97 and 1.02, respectively, according to previous energy dispersive spectroscopy and TGA analysis. Due to the presence of unreacted metallic Fe which is confirmed by X-ray diffraction, the total iron-to-sulphur ratio of the NZVI–H2S reaction products should less than 1. The X-ray photoelectron spectrometry analysis showed the presence of monosulphide (S2−) and disulphide (S22−) in the products, but no pyrite was observed by X-ray diffraction analysis. According to the above discussion, it is proposed that the effective removal of H2S by NZVI at elevated temperatures can be attributed to the combination of two nano-constituents, the oxide shell and the underlying Fe core, to produce FeS similar to troilite and amorphous FeS2.
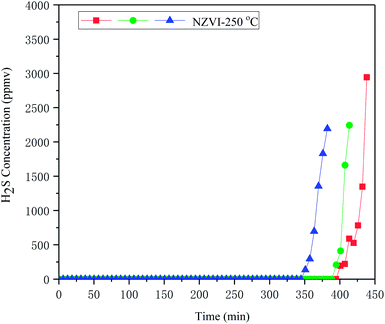
Additional experiment was conducted to assess the disturbance of impurities, such as hydrocarbons, on the removal of H2S from biogas. Simulated biogas including impurities (CO, dimethyl sulphide, dichloroethene, tetrachloroethene, methylene chloride, toluene, ethylbenzene, o-xylene, isobutane, isopentane, n-pentane, hexanes) was prepared according to Spiegel et al.30 and adopted for disturbance assessment, as showed in Table 1. The result showed that, the presence of hydrocarbons has little influence on H2S removal; the H2S removal capacity of NZVI was 494.0 ± 27.99 mg H2S gNZVI−1 at 250 °C in the presence of impurities, as showed in Fig. 11.
| Compound | Concentration (ppmv) |
|---|---|
| Methane | 45% |
| Carbon dioxide | 39% |
| Nitrogen | 14.9% |
| Hydrogen sulphide | 0.8% |
| CO | 0.3% |
| Dimethyl sulphide | 8.0 |
| Dichloroethene | 33 |
| Tetrachloroethene | 6.3 |
| Methylene chloride | 12 |
| Toluene | 35 |
| Ethylbenzene | 13 |
| O-Xylene | 22 |
| Isobutane | 100 |
| Isopentane | 970 |
| N-Pentane | 180 |
| Hexanes | 390 |
Implications for use of NZVI to eliminate H2S from real biogas were further discussed. Firstly, oxygen and vapor in biogas should be removed before the use of NZVI for H2S removal, due to the forming of oxide shell and amorphous oxide layer, respectively, in the presence of oxygen and water. Secondly, the high cost of synthesized NZVI, using sodium borohydride as a traditional reducing agent, might hinder its application to H2S removal for biogas. However, the new synthesis of iron nanoparticles utilizing tea leaf and sorghum bran extracts reported might provide an alternative and low-cost method of producing NZVI,31,32 further decreasing the cost of desulphurization with NZVI for biogas. The H2S removal performance of iron nanoparticles produced by green synthesis should be further studied due to the difference in the diameter and shape of the particles, surface functional groups, etc. Thirdly, additional heating system is needed to provide elevated temperature (e.g. 250 °C) for NZVI–H2S reaction with careful design to avoid the risk of explosion. Finally, the H2S removal unit should be redesigned to meet the requirements of nano-sized desulfurizer, which is different from traditional commercial desulfurizer. Considerable efforts are still needed before the method can be accepted for commercial use.
4. Conclusions
The H2S removal capacities of NZVI were quite limited at room temperature and 100 °C, being 12.56 and 14.77 mg H2S gNZVI−1, respectively. However, these values increased significantly to 391.02 (200 °C) and 488.95 (250 °C) mg H2S gNZVI−1. The reaction products at 250 °C were further characterized to elucidate the reaction mechanism. Scanning electron microscopy analysis revealed that the products of NZVI–H2S aggregated to form irregular polygonal-shaped structures. The main X-ray diffraction pattern peaks of the product (2θ of 43.2°, 29.9°, 33.7°, 53.1° and 70.8°) matched well with troilite, while no pyrite was observed. The X-ray photoelectron spectrometry peak deconvolution of sulphur showed the presence of monosulphide (S2−) and disulphide (S22−) in the product, in which 36% of sulphur existed as monosulphide and 64% as disulphide. It is proposed that the effective removal of H2S by NZVI at elevated temperatures can be attributed to the combination of the nano-constituents consisting of the oxide shell and the underlying Fe core to produce FeS similar to troilite and amorphous FeS2.Conflicts of interest
There are no conflicts to declare.Acknowledgements
The authors wish to thank the International Science & Technology Cooperation Program (No. 2015DFA91390), Central Public-interest Scientific Institution Basal Research Fund (No. 20160301, Nanjing Institute of Environmental Sciences of the Ministry of Environmental Protection). The funding sources had no role in the study design, data collection and analysis, decision to publish, or preparation of the manuscript. Guanyin Zhen would like to appreciate the financial support from the Science & Technology Innovation Action Plan of Shanghai under the Belt and Road Initiative (17230741100), the Distinguished Professor in Universities of Shanghai (Oriental Scholar), the Shanghai Pujiang Program (17PJ1402100), the Youth Foundation of East China Normal University (40500-20101-222001), and the Postdoctoral Fellowship (ID No. PU 14016) of the Japan Society for the Promotion of Science.References
- R. Muñoz, L. Meier, I. Diaz and D. Jeison, Rev. Environ. Sci. Bio/Technol., 2015, 14, 727–759 CrossRef.
- N. Abatzoglou and S. Boivin, Biofuels, Bioprod. Biorefin., 2009, 3, 42–71 CrossRef CAS.
- X. Chai, D. J. Tonjes and D. Mahajan, Prog. Energy Combust. Sci., 2016, 56, 33–70 CrossRef.
- L. H. Su, G. Y. Zhen, L. J. Zhang, Y. C. Zhao, D. J. Niu and X. L. Chai, Environ. Sci.: Processes Impacts, 2015, 17, 2013–2021 CAS.
- M. R. J. Daelman, E. M. van Voorthuizen, U. G. J. M. van Dongen, E. I. P. Volcke and M. C. M. van Loosdrecht, Water Res., 2012, 46, 3657–3670 CrossRef CAS PubMed.
- J. P. Maestre, R. Rovira, F. J. Álvarez-Hornos, M. Fortuny, J. Lafuente, X. Gamisans and D. Gabriel, Chemosphere, 2010, 80, 872–880 CrossRef CAS PubMed.
- D. Deublein and A. Steinhauser, Biogas from Waste and Renewable Resources: An Introduction, Wiley-VCH, Weinheim, 2007 Search PubMed.
- General Administration of Quality Supervision, Inspection and Quarantine of the People's Republic of China, 2012, GB 17820-2012.
- X. Q. Li, D. W. Elliott and W.-x. Zhang, Crit. Rev. Solid State Mater. Sci., 2006, 31, 111–122 CrossRef CAS.
- W. Yan, H.-L. Lien, B. E. Koel and W.-x. Zhang, Environ. Sci.: Processes Impacts, 2013, 15, 63–77 CAS.
- J. E. Martin, A. A. Herzing, W. L. Yan, X. Q. Li, B. E. Koel, C. J. Kiely and W. X. Zhang, Langmuir, 2008, 24, 4329–4334 CrossRef CAS PubMed.
- W. L. Yan, A. A. Herzing, C. J. Kiely and W. X. Zhang, J. Contam. Hydrol., 2010, 118, 96–104 CrossRef CAS PubMed.
- D. R. Baer, D. J. Gaspar, P. Nachimuthu, S. D. Techane and D. G. Castner, Anal. Bioanal. Chem., 2010, 396, 983–1002 CrossRef CAS PubMed.
- X. Q. Li and W. X. Zhang, Langmuir, 2006, 22, 4638–4642 CrossRef CAS PubMed.
- X. Q. Li, D. Brown and W. X. Zhang, J. Nanopart. Res., 2007, 9, 233–243 CrossRef CAS.
- S. H. Chaung, P. F. Wu, Y. L. Kao, W. Yan and H. L. Lien, J. Nanomater., 2014, 2014, 10 Search PubMed.
- L. H. Su, X. L. Shi, G. Z. Guo, A. H. Zhao and Y. C. Zhao, J. Mater. Cycles Waste Manage., 2013, 15, 461–468 CrossRef CAS.
- Z. Guangyin and Z. Youcai, in Pollution Control and Resource Recovery for Sewage Sludge, Butterworth-Heinemann, 2017, pp. 275–352, DOI:10.1016/B978-0-12-811639-5.00006-1.
- A. Ros, M. A. Montes-Moran, E. Fuente, D. M. Nevskaia and M. J. Martin, Environ. Sci. Technol., 2006, 40, 302–309 CrossRef CAS PubMed.
- A. Ros, M. A. Lillo-Ródenas, C. Canals-Batlle, E. Fuente, M. A. Montes-Morán, M. J. Martin and A. Linares-Solano, Environ. Sci. Technol., 2007, 41, 4375–4381 CrossRef CAS PubMed.
- Y. Shen, C. Li, Y. Tang and S. Zhu, RSC Adv., 2015, 5, 13212–13219 RSC.
- C. M. Wang, D. R. Baer, J. E. Amonette, M. H. Engelhard, J. Antony and Y. Qiang, J. Am. Chem. Soc., 2009, 131, 8824–8832 CrossRef CAS PubMed.
- N. M. Pedoussaut and C. Lind, Inorg. Chem., 2008, 47, 392–394 CrossRef CAS PubMed.
- M. I. Nandasiri, L. E. Camacho-Forero, A. M. Schwarz, V. Shutthanandan, S. Thevuthasan, P. B. Balbuena, K. T. Mueller and V. Murugesan, Chem. Mater., 2017, 29, 4728–4737 CrossRef CAS.
- T. Gao, S. Hou, F. Wang, Z. Ma, X. Li, K. Xu and C. Wang, Angew. Chem., Int. Ed., 2017, 56, 13526–13530 CrossRef CAS PubMed.
- Z. Wen, Y. Zhang and C. Dai, Colloids Surf., A, 2014, 457, 433–440 CrossRef CAS.
- X. Q. Li and W. X. Zhang, J. Phys. Chem. C, 2007, 111, 6939–6946 CAS.
- E. Fromm, Kinetics of Metal-Gas Interactions at Low Temperatures: Hydriding, Oxidation, Poisoning, Springer, Berlin, Heidelberg, NY, 1998 Search PubMed.
- L. Signorini, L. Pasquini, L. Savini, R. Carboni, F. Boscherini, E. Bonetti, A. Giglia, M. Pedio, N. Mahne and S. Nannarone, Phys. Rev. B: Condens. Matter Mater. Phys., 2003, 68, 195423 CrossRef.
- R. J. Spiegel, J. L. Preston and J. C. Trocciola, Energy, 1999, 24, 723–742 CrossRef CAS.
- T. Shahwan, S. Abu Sirriah, M. Nairat, E. Boyacı, A. E. Eroğlu, T. B. Scott and K. R. Hallam, Chem. Eng. J., 2011, 172, 258–266 CrossRef CAS.
- E. C. Njagi, H. Huang, L. Stafford, H. Genuino, H. M. Galindo, J. B. Collins, G. E. Hoag and S. L. Suib, Langmuir, 2011, 27, 264–271 CrossRef CAS PubMed.
| This journal is © The Royal Society of Chemistry 2018 |

