 Open Access Article
Electrochemical measurements and theoretical studies for understanding the behavior of catechol, resorcinol and hydroquinone on the boron doped diamond surface†
Amison Rick Lopes da Silvaa,
Alexsandro Jhones dos Santosa and
Carlos Alberto Martínez-Huitle *ab
*ab
aLaboratório de Eletroquímica Ambiental e Aplicada (LEAA), Institute of Chemistry, Federal University of Rio Grande do Norte, Lagoa Nova, CEP 59078-970, Natal, RN, Brazil. E-mail: carlosmh@quimica.ufrn.br
bUNESP, National Institute for Alternative Technologies of Detection, Toxicological Evaluation and Removal of Micropollutants and Radioactives (INCT-DATREM), Institute of Chemistry, P.O. Box 355, 14800-900 Araraquara, SP, Brazil
First published on 16th January 2018
Abstract
Using electrochemical techniques (cyclic voltammetry (CV) and differential pulse voltammetry (DPV)) with a boron-doped diamond (BDD) electrode it was possible to study the behavior of hydroquinone (HQ), catechol (CT) and resorcinol (RS), in aqueous solutions as well as to associate the electrochemical profiles with computational simulations. It led to understanding the factors that influence the direct electrooxidation of HQ, CT and RS on the BDD surface. Theoretical calculations demonstrated that the compounds with lower HOMO energy and high ionization potential (IP) are more stable, showing a higher Epa, denoting that HOMO energies and IP are related to the difficulty of oxidizing (losing an electron) a specific compound. Analyzing the electro-oxidation reactions of HQ, CT and RS by using computational calculations, it was possible to verify the reversibility behavior, direct oxidation pathway and the possible intermediates formed during electron-transfer. The results clearly demonstrated that the reversibility was attained for HQ and CT, while this behavior is not feasible, thermodynamically speaking, for RS and this was confirmed by DFT calculations. For direct oxidation mechanisms, HQ and CT are quickly oxidized, but RS produces stable intermediates. These experimental and theoretical results also explain the behavior when the compounds were analyzed by electroanalytical techniques, suggesting that the interactions by direct electron-transfer determine the stability of response (sensitivity) as well as the limit of detection. The results are described and discussed in light of the existing literature.
1. Introduction
Catechol (CT), resorcinol (RS) and hydroquinone (HQ) are a class of chemical compounds consisting of a hydroxyl functional group (–OH) attached to an aromatic hydrocarbon group, with a ring structure like that of benzene.1 These compounds and their derivatives have wide application in various fields. Moreover, these compounds have great significance in biological properties such as anti-inflammatory, antibacterial, anticonvulsants, anti-tumor, antioxidant properties and many other applications,1–6 and also the isomers of di-hydroxyl-benzenes are employed in the cosmetics, dyes, chemical and pharmaceutical industries.7–10On the other hand, the interest in developing treatment methods, for use in environmental monitoring and restoring, has grown during the last years. Several industries produce during their processes, different solid and liquid wastes containing toxic phenolic compounds (Phs), and their detection, quantification and treatment are necessary before discharge of these pollutants into aquatic eco-systems.11
In this frame, electrochemical technologies12 have been the subject of several investigations to be used in analytical and environmental applications.13 In the former case, electrochemical techniques (cyclic voltammetry, chronoamperometry, chronocoulometry, differential pulse voltammetry, linear sweep voltammetry, etc.) can be fast in detection, less expensive, and with the merits of low detection limit and high accuracy as well as less complicated than the other techniques (high performance liquid chromatography, atomic absorption, gas chromatography and so on). Meanwhile, in the latter case, the application of electrochemistry to environmental pollution abatement has currently received great attention for the elimination of toxic and biorefractory organic pollutants14–18 from water, emerging the electrochemical advanced oxidation processes (EAOPs).
Among the analytical and environmental applications of electrochemical technologies, the effectiveness of both approaches depends on the nature of the material used. In this frame, boron doped diamond (BDD) is considered the most important and applicable of the electrodes4–9,15–17 in the last years. For electrochemical water treatment, BDD promotes the electrogeneration of oxidant mediators by the water discharge (H2O → ˙OH + e− + H+), the hydroxyl radicals (˙OH).14–17,19 These electrogenerated species are primordially physisorbed on its surface (non-active anode surface interacts so weakly with ˙OH), playing an important role in the electrochemical conversion/combustion of organic pollutants. For electrochemical detection, the wide potential window and low background current characteristics of BDD electrode enables highly sensitive detection of various chemical species, leading to significant improvements in terms of linear dynamic range, limit of detection (LOD), response precision and response stability.13,20
Although several mechanisms regarding the oxidation of Phs were described,1,6,7,11,13 more work needs to be done to fully characterize the electrochemical oxidation reactions of these compounds. In this frame, computational theoretical studies, by using Density Functional Theory (DFT), emerge as a power tool to verify the possible factors that guide the electrochemical reactions,21–26 at chemical molecular level during their detection/quantification or partial/complete oxidation at BDD electrode, for possible optimizations.
For this reason, in this work, it was studied the electrochemical behavior of three Phs (catechol, resorcinol and hydroquinone) by using electroanalytical methodologies (cyclic and differential pulse voltammetries) with BDD electrode. Moreover, a comparative study between Phs structures was performed by computational simulations, involving the natural bond orbital (NBO),21,24,27–30 ionization potential (IP) and electronic affinity (EA)21,22 (well-known chemical properties) with the voltammetric profiles in order to understand their main differences, the effects by the positions of the hydroxyl group (–OH) attached to the ring as well as the chemical properties related to the redox behavior of the reactions. It is important to remark that, as far as the authors know, no attempts about this research with BDD electrode have been published yet for understanding the relationship of the redox properties of Phs by theoretical–computational studies. Then, these outcomes will provide a contribution to comprehend the quantitative structure–activity relations in the diamond films electrochemistry.
2. Experimental
2.1 Reagents
Chemicals were of the highest quality commercially available, and were used without further purification. HQ, CT, RS, H2SO4 and NaOH were purchased from Fluka. All aqueous solutions were prepared using ultrapure water obtained by MilliQ® water purification system, and purged with pure nitrogen gas prior to each experiment. For electrochemical measurements, stock solutions 0.1 mol L−1 of HQ, CT and RS were prepared in 0.05 mol L−1 H2SO4.2.2 Electrochemical experiments
Voltammetric experiments were performed in an Autolab PGSTAT32N connected to a PC by using NOVA software to process all data. A stationary BDD electrode (1.02 cm2 of area) was used as working electrode for cyclic voltammetry (CV) and differential pulse voltammetry (DPV) experiments by using a conventional electrochemical cell with a capacity of 30 mL and thermostatic control. Platinum wire was used as auxiliary electrode and all potentials were measured against an Ag/AgCl electrode in saturated KCl (3.0 mol L−1). The experiments were conducted at room temperature (25 °C). The surface of the disk was polished by using isopropanol and sonicated with ultrapure water for 5 min, before use and after each measurement. BDD films were synthesized by Adamant Technologies (Neuchatel, Switzerland). It was grown onto a conductive p-Si substrate (0.1 Ω cm, Siltronix) via the hot-filament, chemical-vapor-deposition technique. This procedure gave a columnar, randomly textured, polycrystalline diamond coating, with a thickness of about 1 μm and a resistivity of 15 mΩ cm (±30%). The diamond electrode was place on a metal support (Ti) and electrical connection was made scratching the backside of Si substrate and then coating the area with Ag paste. Ti support was polished clean prior to contact. Subsequently, Ti support and the borders of BDD surface were covered with an isolator polymer to protect the electrode device when it was immersed in the aqueous solutions. In order to stabilize the electrode surface and to obtain reproducible results, the diamond electrode was pretreated at 25 °C by anodic polarization in 1 M HClO4 at 10 mA cm−2 during 30 min using stainless steel as counter electrode. This treatment made the surface hydrophilic.2.3 Analytical measurements
DPV measurements were usually conducted in 0.05 mol L−1 H2SO4 at 25 °C with a conventional three-electrode system described above, and applying scan rate of 50 mV s−1, equilibration time (s): 10; modulation time (s): 0.04; initial potential (V): 0.50; end potential (V): 2.50; step potential (V): 0.006; modulation amplitude (V): 0.05 and standby potential (V): 0.05. Calibration curves for of HQ, CT and RS were achieved in 0.05 mol L−1 H2SO4, evaluating the peak intensity as a function of the analyte concentration, and considering at least six analyte concentrations. At the end, the electrode was cleaned with alcohol–water steps as above described.2.4 Computational details
Computational calculations of optimization of geometry and NBO were performed using the Gaussian 09 package31 in a level of theory DFT with functional B3LYP and basis set 6-311++G (d, p). Ionization potential (IP) and electronic affinity (EA) were also calculated by estimating them in the vacuum and implicit solvent water.22,23 The HOMO (highest occupied molecular orbital) and SOMO (singly occupied molecular orbital) eigenvalues from optimized geometries of isomers in their neutral forms as well as the Gibbs energies of structures used to obtain the plots about of the reaction pathways were correlated with the voltammograms obtained at BDD electrode, evaluating the anodic oxidation potentials (Epa), which is a specific characteristic of each one of the isomers examined. Based on the results obtained, under the proposed conditions, it was established the relationship between HOMO/SOMO energy, obtained computationally, and the electrochemical behavior observed at the voltammetric analysis.3. Results and discussions
3.1 Cyclic voltammetry characterization
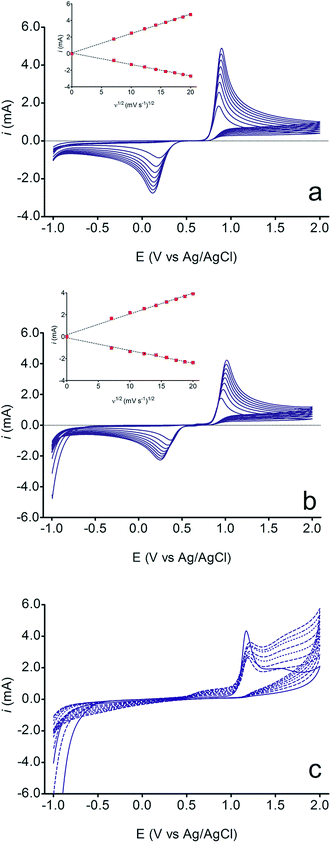
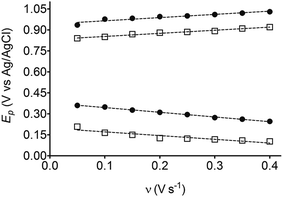
The electrochemical behavior of HQ, CT and RS was carefully investigated at a BDD electrode in 0.05 mol L−1 H2SO4 at 25 °C using cyclic voltammetry. These experiments were carried out at different sweep rates ranging from 0.05 to 0.40 V s−1. Typical voltammograms recorded under the chosen experimental conditions for HQ, CT and RS, are shown in Fig. 1. CV profiles for HQ and CT (see, Fig. 1a and b) show that the separation between the anodic (Epa) and cathodic (Epc) potential peaks is superior than +0.658 V and +0.565 V vs. Ag/AgCl, respectively. It occurs due to the redox process by these experimental conditions1,32,33 and it increases when an increase on the scan rate was attained for HQ and CT (see, Fig. 2). Meanwhile, no cathodic peak was achieved for RS during CV analysis (Fig. 1c), obtaining only an anodic peak about +1.16 V vs. Ag/AgCl indicating only occurrence of oxidative process. Insets in the Fig. 1a and b show a linear relationship of ip vs. the square root of the scan rate (ν1/2) in the range investigated for HQ and CT, suggesting that the redox reactions of HQ and CT are controlled by diffusion mass transport.7,34 Aiming to evaluate if the diffusion or the adsorption was the rate-determining step on the electrooxidation mechanism of the isomers, the influence of the scan rate (ν) was studied. The relationship between log![[thin space (1/6-em)]](https://www.rsc.org/images/entities/char_2009.gif) ip vs. log
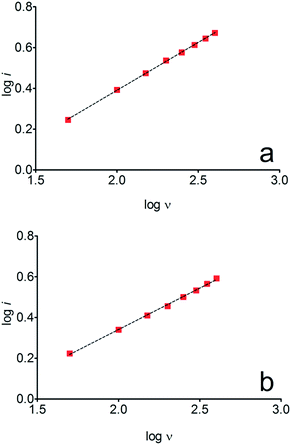
ip vs. log![[thin space (1/6-em)]](https://www.rsc.org/images/entities/char_2009.gif) ν for HQ and CT showed a linear response with linear correlation coefficient (r2) of 0.9974 and slopes close to 0.5 for both signals (0.47 and 0.45 for HQ and CT, respectively), confirming that currents were diffusion controlled (Fig. 3a and b) towards diamond surface.7,34 Similar analyses were performed for RS achieving different behavior due to the direct oxidation process attained on BDD surface. As can be seen on BDD anode (Fig. 1c), when RS is present in solution resulted in an anodic peak at +1.16 V and a broad peak at +1.56 V that is partially overlapped by an increase on the current at +1.86 V. This indicates that RS can be directly oxidized on diamond surface in the region before oxygen evolution,35,36 and consequently, the increase on the current can be due to the interaction of intermediates formed from RS oxidation with the diamond surface.
ν for HQ and CT showed a linear response with linear correlation coefficient (r2) of 0.9974 and slopes close to 0.5 for both signals (0.47 and 0.45 for HQ and CT, respectively), confirming that currents were diffusion controlled (Fig. 3a and b) towards diamond surface.7,34 Similar analyses were performed for RS achieving different behavior due to the direct oxidation process attained on BDD surface. As can be seen on BDD anode (Fig. 1c), when RS is present in solution resulted in an anodic peak at +1.16 V and a broad peak at +1.56 V that is partially overlapped by an increase on the current at +1.86 V. This indicates that RS can be directly oxidized on diamond surface in the region before oxygen evolution,35,36 and consequently, the increase on the current can be due to the interaction of intermediates formed from RS oxidation with the diamond surface.
It is also interesting to observe that some changes in the current were achieved in the potential range of +0.5 V and +1.0 V as well as in the region before of water decomposition (>+1.85 V), indicating that, direct and indirect (by water decomposition intermediates (hydroxyl radicals, ˙OH))32,33,35,36 oxidation processes occur, which are only available in conditions of oxygen evolution (eqn (1)). Since phenol is a byproduct or starting reagent in the formation and mineralization reactions of HQ, CT and RS, it is common the mechanism already proposed in ref. 32 because the mineralization is strongly influenced by the hydroxyl radicals.
| H2O → ˙OH + e− + H+ | (1) |
However, during continuous potential cycling at different scan rates (Fig. 1c), the anodic current peak at +1.16 V decreases, as a function of ν. This fact can be explained by the formation of an organic film that covered the electrode surface.36 Similar deactivation of BDD electrodes during the voltammetry with aromatic compounds such as phenol, naphthol and 4-chlorophenol has already been reported in the literature.37–39 Meanwhile, a new peak signal appears at +0.69 V and the broad peak at +1.56 V increases significantly when the ν rises. It is reasonable to assume that RS oxidation involves the formation of electroactive products, which can be destroyed by polarization at high anodic potential in the region of water decomposition. In fact, it was demonstrated in ref. 40 that high potential BDD anodes produce high amount of hydroxyl radicals (eqn (1)) that oxidize the polymeric film regaining the initial activity (eqn (2)):
| Organic film + ˙OH → CO2 + H2O | (2) |
Nevertheless, other intermediates can be produced from RS oxidation at BDD surface, indicating that the RS in solution is a system completely irreversible. In fact, it is confirmed by the absence of the cathodic peak in the voltammetric curves (see Fig. 1c) and by electrooxidation mechanisms that are already well-known in the literature41,42 where the formation of polymer layer is achieved, which deactivates the catalytic sites of the anode.43 These effects of isomers have been described in the literature14,15,17,33,35,37 and these have been claimed to explain the electrochemical behaviors obtained in numerous of oxidation processes; for this reason, mechanistic studies must be performed to increase the understanding on the oxidation pathways and on the viability of detection of these isomers.
3.2 Differential pulse voltammetric experiments
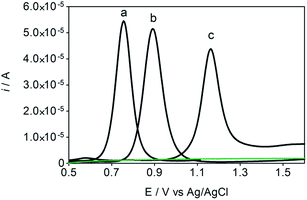
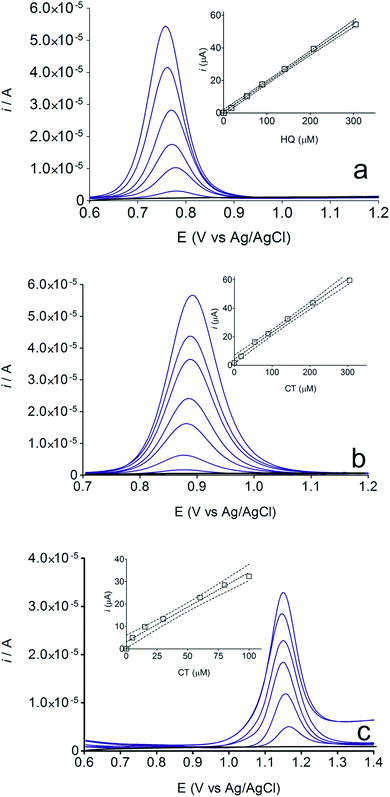
Some experiments were performed in order to evaluate the effects of isomers oxidizability on the BDD electrode by using differential pulse voltammetry (DPV)44,45 as well as to confirm the influence of isomers oxidation on the detection parameters. Fig. 4 allows comparing of DPV (i–E) curves, in absence (dashed green curve, in 0.05 mol L−1 H2SO4, as supporting electrolyte) and in presence of each one of the isomers in the solution (1.8 × 10⁻⁵ mol L−1 of HQ, CT and RS) (dotted black curves, a, b and c, respectively). As shown in the figure, BDD electrode showed peak responses for oxidation of Phs (HQ, CT and RS); however, DP voltammetric peak-current recorded for HQ was relatively higher than that observed for CT and RS under similar conditions. As can be also seen from Fig. 4, the oxidation potential is slightly shifted to more positive potentials in the order: HQ (+0.75 V) < CT (+0.89 V) < RS (+1.09 V). The peak current enhancement, for both HQ and CT, was in accordance with the increase on the BDD catalytic activity for these redox couples14,15,17,33,35,37 as well as the decrease on the diffusion layer thickness for the more reversible systems.A linear relationship between peak current and concentration was obtained using BDD electrode (see, Fig. 5) for HQ, CT and RS. Calibration plots were recorded in a large concentration range to explore the dynamic and linear ranges46,47 in order to understand the influence of the oxidation products formed during the electroanalytical analysis. Each curve was obtained by evaluating the peak intensity as a function of the analyte concentration, and considering at least six analyte concentrations (inset in Fig. 5). The calibration plot was linear between 1.8 × 10⁻⁵ and 3 × 10⁻⁴ M for HQ and CT, with regression coefficients always larger than 0.999; while the calibration plot for RS was linear between 5.00 × 10⁻⁵ to 1.00 × 10⁻⁴ M, with a regression coefficient about 0.9750. The functional relationships were (slope and intercept were the average of six independent calibrations):
| HQ: i/μA = 0.183 ± 0.006 [HQ] μM + 0.596 ± 0.941, (r = 0.9945); |
| CT: i/μA = 0.188 ± 0.002 [CT] μM + 0.123 ± 0.322, (r = 0.9960); |
| RS: i/μA = 0.309 ± 0.021 [RS] μM + 3.147 ± 1.140, (r = 0.9750). |
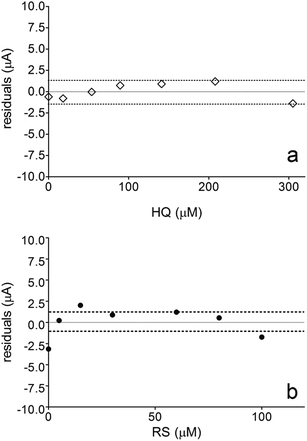
Fig. 6 also shows that the residuals of the regression are randomly distributed around the zero, for HQ, allowing a visual verification of the absence of a significant non linearity.46–49 It is worth noting that no significant differences in calibration curves recorded in different days at several different electrodes were evidenced. A preliminary estimation of the Limit of Detection (LOD), for HQ, CT and RS, was also possible by using the approach based on the standard deviation of regression:44–47 LOD = 3.3 × Sy/x/b, where Sy/x is the residual standard deviation and b is the slope of the calibration plot. On the basis of the preliminary results obtained, LOD of about 15.47, 16.34 and 19.23 μM could be estimated, for HQ, CT and RS, respectively. This approach allowed to control both false positive and false negative errors (a = b = 0.05).46–52 These results evidence the sensibility on the analytical responses to quantified each one of the Phs.52–54
Nevertheless, the results obtained by DPV technique clearly indicates that, the electroanalytic approach by using BDD electrode to quantify HQ and CT is weakly influenced by the interaction of organic compound with the diamond surface. In fact, a significant linear range of the analyte concentration was obtained, achieving a LOD below the last concentration added in solution. Conversely, BDD sensor was strongly affected by the oxidation mechanism developed by RS during its detection at higher positive potentials. Definitely, this behavior influences on the calibration linear range because no significant LOD was achieved (in fact, it is within the linear range) and no higher RS concentration can be electrochemically determined because the linearity is lost (>100 μM). These assertions are obvious when the weighted residuals for HQ and RS were evaluated. Fig. 6a showed that the residuals of the regression are randomly distributed around the zero for HQ, allowing a visual verification of the absence of a significant non linearity,53,54 indicating that there are repeatability, reproducibility, high confidence and sensibility in the analytical measurements. Conversely, when BDD is use to detect RS, no good performances were achieved (Fig. 6b shows that the residuals of the regression are not randomly distributed around the zero, and high statistical error is present in the measurements), and these are related to the mechanistic study as well as the voltammetric behavior previously observed, where the oxidation of RS to other compounds is feasible and the formation of polymeric film on electrode surface can promote an inactivation.
3.3 Mechanistic studies
The electrochemical oxidation of these isomers (HQ, CT and RS) strongly depends on the electronic effects of substituents on the aromatic ring as well as the formation of an intramolecular hydrogen bond between a hydroxyl group and a substituent.7 To understand their relationship with the electrochemical measurements and chemical properties, DFT calculations were performed. Table 1 presents the results obtained by theoretical calculations in vacuum and in implicit solvent for HOMO, IP and EA. Analyzing Table 1; it is possible to observe that the Epa for CT and Epa for RS is higher when compared to HQ. This behavior is related to the presence of electron withdrawing groups bonded to the aromatic ring, decreasing its electron density as well as on the hydroxyl oxygen atom, hindering the loss of one electron from it.In this context, the energy analyzes of molecular orbitals (EHOMO), according to molecular orbital theory55,56 the tendency of a compound losing or receiving an electron is mainly dependent on the energy of highest occupied molecular orbital (HOMO). Generally, a higher HOMO energy means that the compound is easily oxidized.40,56
Other important features that are directly linked to the ability to loss and receive electrons are the ionization potential (IP) and electronic affinity (EA), respectively. According to the Koopmans' theorem,57,58 the first ionization energy of a molecular system is equal to the negative of the orbital energy of the highest occupied molecular orbital (HOMO). A similar theorem exists in DFT for relating the exact IP and EA to the HOMO and LUMO energies; although both, the derivation and the precise statement, differ from that of Koopmans' theorem. Then, by using DFT calculations, IP can be considered as the absolute value of HOMO requiring some corrections57–59 and EA can be also estimated from the energy.57
Taking into account the above information, Table 1 shows the estimations of IP and EA values in vacuum or in water as implicit solvent. IP is considered as the necessary energy to withdraw an electron from the specie, while the EA is related to the energy released by the studied specie when it receives an electron, becoming more stable. In this context, IP values for HQ, CT and RS are very similar (in vacuum and implicit solvent); indicating that, the oxidation of all isomers is reasonably easy. Nevertheless, RS presents a smaller HOMO and higher IP values (higher energy to withdraw electrons from the organic species), indicating that no easy oxidation is performed; therefore, a higher energy is necessary to occur. In fact, this behavior is in accordance with the voltammetric results because in all cases, the oxidation of the isomers to their quinones is attained.1,32,42
On the other hand, significant differences are observed between the EA values for HQ, CT and RS (see Table 1). The energy released by HQ and CT is higher and these values are very similar in both cases, indicating that, the product formed is very stable (in vacuum or implicit solvent). Conversely, when an electron is received by the quinone formed from RS, lower EA energy is released (in vacuum or in implicit solvent), disfavoring the formation of a stable product and consequently, the reduction of RS–quinone is not suitable. In fact, no voltammetric signals are observed during reduction scan at RS experiments. This result also demonstrates that the solvation of species plays an important role in the oxidation or reduction processes as well as the charge formed at the Nernst layer (film of hydroxyl radicals formed at higher potentials on BDD surface11) because these effects decrease the approximation close the surface, and consequently, the interaction to efficient electron-transfer. Then, the HOMO energy for above isomers was calculated by DFT, and the results are also shown in Table 1. Last assumption is in agreement with the oxidation potentials experimentally determined for the compounds as well as the IP values. As shown in Fig. 1 and Table 1, these isomers can be oxidized at different potentials. For HQ, oxidation begins at 0.701 V vs. Ag/AgCl, while an optimal oxidation condition (peak potential) is under a potential of 0.845 V. These results suggest that, for the effective HQ oxidation; the potential of electrode must exceed 0.845 V. The other isomers compounds can also be similarly interpreted and the predictions can be done according to their CV profiles. However, in the case of RS, there are two peaks which can be ascribed as the oxidation of RS to two hydroxyl groups,14,15,17,33,35,37 increasing the difficulty to be oxidized, as already stated by the IP values. Additionally, when two carbons change from sp2 to sp3 hybridization, this fact also influences the stability of the compound analyzed.14,15,17,33
For HQ and CT, the quasi-reversibility of the reaction was experimentally observed when the characteristic peaks related to oxidation and reduction, were attained at CV profiles.33 Meanwhile, for RS, the reaction considers the generation of a quinone, which is not stable thermodynamically and it was confirmed because no cathodic peak was recorded1,7,30,31 as well as it was long-established by the EA values obtained in vacuum and implicit solvent.
From the data discussed above, the mechanisms proposed14,15,17,33,35,37 (see, Fig. 7) for electro-oxidation of isomers were analyzed by DFT calculations in order to verify the aspect of reversibility and energies (in terms of eV) by using the effect of water implicit solvent and also in the vacuum system. Fig. 8 shows the potential-energy surface plots for mechanism proposals in Fig. 7. From these results, it is possible to infer important thermodynamic aspects about these reactions. The anion and the radical are the main intermediates with higher energies, HQ (Fig. 8a), CT (Fig. 8b) and RS (Fig. 8c). However, the intermediate with two radical oxygen groups in the molecule is the most energetic structure. Another important feature is that, the energy barriers of the intermediates are closer, including the radical with the corresponding quinone, at the reaction pathways for HQ and CT. This fact indicates that is possible the reversibility because no significant energy barrier must be overcome after that the quinone was formed. It is supported by the IP and EA values, which indicate that, lower energies are necessary to lost electrons from HQ and CT, while, the opposite process is achieved releasing higher energies, showing at the reduction is possible, thermodynamically speaking.
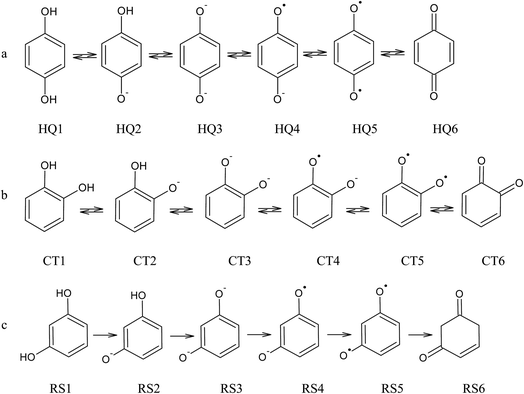 | ||
| Fig. 7 Electrochemical oxidation pathway for (a) HQ, (b) CT and (c) RS, considering the possible formation of quinones as by-products.14,15,17,33,35,37 | ||
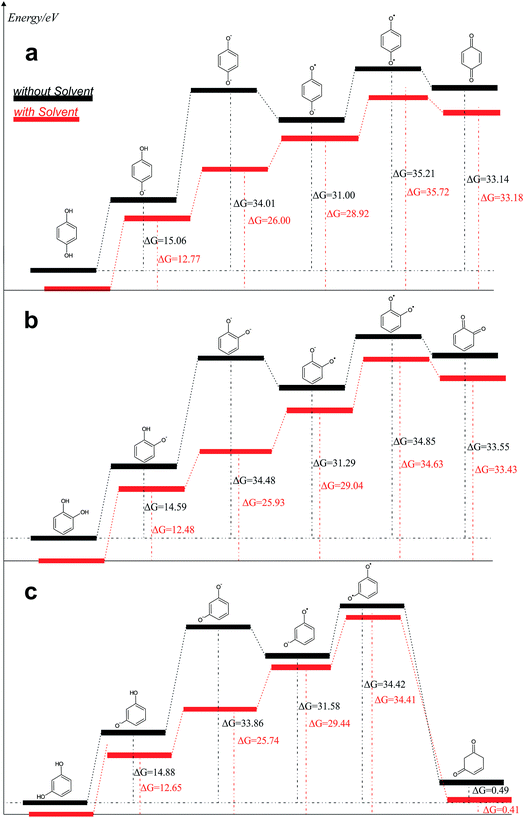 | ||
| Fig. 8 Reaction pathways obtained, in terms of eV, from structures optimized by B3LYP/6-311++G (d, p): (a) HQ; (b) CT and (c) RS are oxidized at BDD surface. | ||
Conversely, the radical intermediate, at RS oxidation (Fig. 8c), is a reactive species that could form the correspondent quinone or a polymeric product, avoiding that it returns to its original state. In fact, IP values indicate that RS oxidation is feasible even when more energetic requirements, thermodynamically speaking, are necessary respect to HQ and CT. But, the reduction process is not suitable.
The third intermediate of each reaction has an energetic decrease due to the solvent effect by water solvation, stabilizing charge of dianion. Meanwhile, when HQ and CT are in the form of HQ5 and CT5 (see Fig. 7), these can became HQ6 and CT6 via electronic arrangement without difficulty. Conversely, the formation of polymer films is feasible from the RS4 and RS5 intermediates (see Fig. 7).
In this frame, theoretical calculation methods by the use of natural bond orbital (NBO) method21,24,27–30 as tool for analyzing the orbital interactions, stabilization energies caused by electron transfer, and hyperconjugation stabilization energies, is possible. The NBOs are one of the consequences of natural localized orbitals set that include natural atomic (NAO), hybrid (NHO) and semi-localized molecular orbital (NLMO) sets, intermediate between basis atomic orbitals (AOs) and canonical molecular orbitals (MOs).27 The NBO method involves population analysis, which distributes computed electron density to orbitals in the way a chemist thinks in terms of physical organic chemistry. Then DFT calculations were employed to find NBO, since the direct electro-oxidation reactions occur via withdrawal of electrons from of the three isomers examined (Fig. 7). The proposal is that the electrons are withdrawal from the anion of each one of the isomers in the reaction. This orbital energy information reveals facts on molecular properties that are directly related to the experimental results of electroanalytical measurements exhibited above.
The calculations showed the following relationship about the energy (E) of the highest occupied molecular orbital (HOMO) calculated:
| E(HOMO-HQ) > E(HOMO-CT) > E(HOMO-RS) |
Based on these results, the smaller the HOMO energy the greater the potential of oxidation peak. This theoretical assertion is in accordance with the experimental results (Table 1 and Fig. 1) because the lower the energy of the HOMO orbital, more stable and higher energy required to withdrawal the electrons that are in the orbital.
4. Conclusions
In summary, the association of electrochemical techniques with computational simulations led us to understand the electrooxidation of HQ, CT and RS on BDD surface. Regarding the CV results, HQ, CT and RS are oxidized directly on BDD surface, however, RS also is indirectly oxidized by reactive oxygen species. In terms of DP voltammetry, the above effects influence the electroanalytical procedure for the determination and quantification of these isomers with BDD, showing a linear range of 1.8 × 10⁻⁵ and 3 × 10⁻⁴ M, with detection limits of 15.47 and 16.34 μM, for HQ and CT, respectively, with repeatability of 4.1% (n = 5), and reproducibility of 1.5% (n = 6).DFT studies clearly showed that the values of IP and EA with implicit solvent and vacuum system have a relation with the behavior of the oxidative potentials registered by using voltammetries, where higher IP values are related to the isomer with higher Epa. On the other hand, experimental measurements and theoretical calculations demonstrated that, the voltammetric profiles are related to NBO because the isomers with lower HOMO energy are more stable, showing a higher Epa. It also denotes that, HOMO energies is related to the difficulty to be oxidized (losing an electron) of each one of the isomers examined. These results open a new front of studies in the understanding and relation to models of the electrochemical profiles with molecular properties obtained computationally.
Conflicts of interest
We have no conflict of interest to declare.Acknowledgements
Brazilian financial supports from National Council for Scientific and Technological Development (CNPq – 465571/2014-0; CNPq – 446846/2014-7 and CNPq – 401519/2014-7) and FAPESP (2014/50945-4) are gratefully acknowledged. A. R. L. da Silva and C. A. Martínez-Huitle gratefully acknowledge the support and permission supplied by CENAPAD-SP to develop computational calculations during the period 2013–2015. A. R. L. da Silva and A. J. dos Santos acknowledge the PhD fellowships granted by CAPES.References
- T. A. Enache and A. M. Oliveira-Brett, J. Electroanal. Chem., 2011, 655, 9–16 CrossRef CAS.
- M. Valko, D. Leibfritz, J. Moncol, M. T. D. Cronin, M. Mazur and J. Telser, Int. J. Biochem. Cell Biol., 2007, 39, 44–84 CrossRef CAS PubMed.
- M. Cristani, M. D'Arrigo, G. Mandalari, F. Castelli, M. G. Sarpietro, D. Micieli, V. Venuti, G. Bisignano, A. Saija and D. Trombetta, J. Agric. Food Chem., 2007, 55, 6300–6308 CrossRef CAS PubMed.
- M. J. R. Vaquero, M. R. Alberto and M. C. M. de Nadra, Food Control, 2007, 18, 93–101 CrossRef.
- Z. Zhang, X. Yuan Lian, S. Li and J. L. Stringer, Phytomedicine, 2009, 16, 485–493 CrossRef CAS PubMed.
- L. R. C. Barclay, C. E. Edwards and M. R. Vinqvist, J. Am. Chem. Soc., 1999, 121, 6226–6231 CrossRef CAS.
- R. Salazar, J. Vidal, M. Martínez-Cifuentes, R. Araya-Maturana and O. Ramírez-Rodríguez, New J. Chem., 2015, 39, 1237–1246 RSC.
- T. Dunlap, R. E. P. Chandrasena, Z. Wang, V. Sinha, Z. Wang and G. R. J. Thatcher, Chem. Res. Toxicol., 2007, 20, 1903–1912 CrossRef CAS PubMed.
- M. Chigr, H. Fillion, A. Rougny, M. Berlion, J. Riondel and H. Beriel, Chem. Pharm. Bull., 1990, 38, 688–691 CrossRef CAS PubMed.
- K. Ichi Haruna, H. Kanezaki, K. Tanabe, W. M. Dai and S. Ichi Nishimoto, Bioorg. Med. Chem., 2006, 14, 4427–4432 CrossRef PubMed.
- M. Panizza, P. A. Michaud, G. Cerisola and C. Comninellis, J. Electroanal. Chem., 2001, 507, 206–214 CrossRef CAS.
- I. Sirés, E. Brillas, M. A. Oturan, M. A. Rodrigo and M. Panizza, Environ. Sci. Pollut. Res., 2014, 21, 8336–8367 CrossRef PubMed.
- A. Apilux, W. Siangproh, P. Chantarateepra and O. Chailapakul, Synthetic Diamond Films: Preparation, Electrochemistry, Characterization and Applications Applications, Wiley, New York, 2011 Search PubMed.
- E. Brillas and C. A. Martinez-Huitle, Appl. Catal., B, 2015, 166–167, 603–643 CrossRef CAS.
- C. A. Martínez-Huitle, M. A. Rodrigo, I. Sirés and O. Scialdone, Chem. Rev., 2015, 115, 13362–13407 CrossRef PubMed.
- C. Comninellis and G. Chen, Electrochemistry for the Environment, Springer, 2010 Search PubMed.
- E. Brillas, I. Sirés and M. A. Oturan, Chem. Rev., 2009, 109, 6570–6631 CrossRef CAS PubMed.
- G. Chen, Sep. Purif. Technol., 2004, 38, 11–41 CrossRef CAS.
- C. A. Martínez-Huitle and L. S. Andrade, Quim. Nova, 2011, 34, 850–858 CrossRef.
- S. Garcia-Segura, E. Vieira dos Santos and C. A. Martínez-Huitle, Electrochem. Commun., 2015, 59, 52–55 CrossRef CAS.
- A. Lammermann, I. Szatmári, F. Fulop and E. Kleinpeter, J. Phys. Chem. A, 2009, 113, 6197–6205 CrossRef PubMed.
- A. E. Shchavlev, A. N. Pankratov and V. Enchev, J. Phys. Chem. A, 2007, 111, 7112–7123 CrossRef CAS PubMed.
- F. Weinhold, Nature, 2001, 411, 539–541 CrossRef CAS PubMed.
- V. Pophristic and L. Goodman, Nature, 2001, 411, 565–568 CrossRef CAS PubMed.
- A. R. L. da Silva, J. L. A. de Queiroz, D. C. de Moura, D. R. da Silva and C. A. Martínez-Huitle, J. Electroanal. Chem., 2017, 794, 93–102 CrossRef.
- A. Silva, D. Araujo, E. Silva, D. S. Vieira, N. K. V Monteiro and C. A. Martinez-Huitle, New J. Chem., 2017, 41, 7766–7774 RSC.
- A. E. Reed, L. A. Curtiss and F. Weinhold, Chem. Rev., 1988, 88, 899–926 CrossRef CAS.
- A. Shchavlev, A. N. Pankratov and V. Enchev, J. Phys. Chem. A, 2007, 111, 7112–7123 CrossRef CAS PubMed.
- F. Weinhold, Nature, 2001, 411, 539–541 CrossRef CAS PubMed.
- A. E. Reed and F. Weinhold, J. Chem. Phys., 1983, 78, 4066–4073 CrossRef CAS.
- M. J. Frisch, G. W. Trucks, H. B. Schlegel, G. E. Scuseria, M. A. Robb, J. R. Cheeseman, G. Scalmani, V. Barone, B. Mennucci, G. A. Petersson, H. Nakatsuji, M. Caricato, X. Li, H. P. Hratchian, A. F. Izmaylov, J. Bloino, G. Zheng, J. L. Sonnenberg, M. Hada, M. Ehara, K. Toyota, R. Fukuda, J. Hasegawa, M. Ishida, T. Nakajima, Y. Honda, O. Kitao, H. Nakai, T. Vreven, J. A. Montgomery Jr, J. E. Peralta, F. Ogliaro, M. Bearpark, J. J. Heyd, E. Brothers, K. N. Kudin, V. N. Staroverov, R. Kobayashi, J. Normand, K. Raghavachari, A. Rendell, J. C. Burant, S. S. Iyengar, J. Tomasi, M. Cossi, N. Rega, J. M. Millam, M. Klene, J. E. Knox, J. B. Cross, V. Bakken, C. Adamo, J. Jaramillo, R. Gomperts, R. E. Stratmann, O. Yazyev, A. J. Austin, R. Cammi, C. Pomelli, J. W. Ochterski, R. L. Martin, K. Morokuma, V. G. Zakrzewski, G. A. Voth, P. Salvador, J. J. Dannenberg, S. Dapprich, A. D. Daniels, Ö. Farkas, J. B. Foresman, J. V. Ortiz, J. Cioslowski and D. J. Fox, Gaussian Inc., 2009.
- M. Pimentel, N. Oturan, M. Dezotti and M. A. Oturan, Appl. Catal., B, 2008, 83, 140–149 CrossRef CAS.
- A. J. Saleh Ahammad, S. Sarker, M. Aminur Rahman and J. J. Lee, Electroanalysis, 2010, 22, 694–700 CrossRef.
- F. W. D. S. Lucas, L. H. Mascaro, T. P. Fill, E. Rodrigues-filho, E. Franco-junior, P. Homem-de-mello, P. Lima-neto, A. N. Correia and C. Postal, Langmuir, 2014, 30, 5645–5654 CrossRef CAS PubMed.
- B. Nasr, G. Abdellatif, P. Cañizares, C. Sáez, J. Lobato and M. A. Rodrigo, Environ. Sci. Technol., 2005, 39, 7234–7239 CrossRef CAS PubMed.
- L. Labiadh, A. Barbucci, G. Cerisola, A. Gadri, S. Ammar and M. Panizza, J. Solid State Electrochem., 2015, 19, 3177–3183 CrossRef CAS.
- J. Iniesta, P. A. Michaud, M. Panizza, G. Cerisola, A. Aldaz and C. Comninellis, Electrochim. Acta, 2001, 46, 3573–3578 CrossRef CAS.
- M. A. Rodrigo, P. A. Michaud, I. Duo, M. Panizza, G. Cerisola and C. Comninellis, J. Electrochem. Soc., 2001, 148, D60–D64 CrossRef CAS.
- M. Panizza and G. Cerisola, Electrochim. Acta, 2003, 48, 3491–3497 CrossRef CAS.
- B. Marselli, J. Garcia-Gomez, P.-A. Michaud, M. A. Rodrigo and C. Comninellis, J. Electrochem. Soc., 2003, 150, D79–D83 CrossRef CAS.
- S. M. Ghoreishi, M. Behpour, E. Hajisadeghian and M. Golestaneh, Arabian J. Chem., 2016, 9, S1563–S1568 CrossRef CAS.
- H. Nady, M. M. El-Rabiei and G. M. A. El-Hafez, Egypt. J. Pet., 2017, 26, 669–678 CrossRef.
- C. A. Martínez-Huitle, M. A. Rodrigo, I. Sirés and O. Scialdone, Chem. Rev., 2015, 115, 13362–13407 CrossRef PubMed.
- Z. Li, S. Xia, J. Wang, C. Bian and J. Tong, J. Hazard. Mater., 2016, 301, 206–213 CrossRef CAS PubMed.
- J. R. Oliveira-Neto, S. G. Rezende, C. de Fátima Reis, S. R. Benjamin, M. L. Rocha and E. de Souza Gil, Food Chem., 2016, 190, 506–512 CrossRef CAS PubMed.
- B. Brunetti and E. Desimoni, Electroanalysis, 2009, 21, 772–778 CrossRef CAS.
- E. Desimoni and B. Brunetti, Electroanalysis, 2012, 24, 1481–1500 CrossRef CAS.
- E. G. Araújo, A. dos Santos, D. R. da Silva, R. Salazar and C. A. Martínez-Huitle, Electroanalysis, 2014, 26, 748–755 CrossRef.
- E. de Araújo, N. S. Fernandes, L. G. da Silva Solon, C. F. Soares Aragão and C. A. Martinez-Huitle, Electroanalysis, 2015, 27, 398–405 CrossRef.
- J. N. Miller and J. C. Miller, Statistics and Chemometrics for Analytical Chemistry, 1993 Search PubMed.
- I. guide 99:2007, International vocabulary of metrology – basic and general concepts and associated terms (VIM), 2007 Search PubMed.
- L. A. Currie, Pure Appl. Chem., 1995, 67, 1699–1723 CrossRef CAS.
- B. Brunetti and E. Desimoni, J. Food Compos. Anal., 2014, 33, 155–160 CrossRef CAS.
- E. Desimoni and B. Brunetti, Anal. Chim. Acta, 2009, 655, 30–37 CrossRef CAS PubMed.
- K. Fukui, T. Yonezawa and H. Shingu, J. Chem. Phys., 1952, 20, 722–725 CrossRef CAS.
- J. R. Steter, R. S. Rocha, D. Dionísio, M. R. V. Lanza and A. J. Motheo, Electrochim. Acta, 2014, 117, 127–133 CrossRef CAS.
- C. G. Zhan, J. A. Nichols and D. A. Dixon, J. Phys. Chem. A, 2003, 107, 4184–4195 CrossRef CAS.
- C. J. Cramer, Essentials of Computational Chemistry: Theories and Models, Wiley, 2nd edn, 2005 Search PubMed.
- D. J. Tozer and F. De Proft, J. Phys. Chem. A, 2005, 109, 8923–8929 CrossRef CAS PubMed.
Footnote |
| † Electronic supplementary information (ESI) available. See DOI: 10.1039/c7ra12257h |
| This journal is © The Royal Society of Chemistry 2018 |

