 Open Access Article
Creative Commons Attribution 3.0 Unported Licence
Casting of a superhydrophobic membrane composed of polysulfone/Cera flava for improved desalination using a membrane distillation process
Saikat Sinha Raya,
Shiao-Shing Chen *a,
Cao Thanh Ngoc Dana,
Hung-Te Hsua,
Hau-Ming Changa,
Nguyen Cong Nguyenb and
Hau-Thi Nguyenb
aInstitute of Environmental Engineering and Management, National Taipei University of Technology, No. 1, Sec. 3, Zhongxiao E. Rd., Taipei-10608, Taiwan. E-mail: f10919@ntut.edu.tw
bFaculty of Environment and Natural Resources, DaLat University, Viet Nam
First published on 8th January 2018
Abstract
Superhydrophobic membranes are necessary for effective membrane-based seawater desalination. This paper presents the successful fabrication of a novel electrospun nanofibrous membrane composed of polysulfone and Cera flava, which represents a novel class of enhanced performance membranes consisting of a superhydrophobic nanofibrous layer and hydrophobic polypropylene (PP). Cera flava, which helps lower the surface energy, was found to be the ideal additive for increasing the hydrophobicity of the polysulfone (PSF) polymeric solution because of its components such as long-chain hydrocarbons, free acids, esters, and internal chain methylene carbons. In the fabricated membrane, consisting of 10 v/v% Cera flava, the top PSF–CF nanofibrous layer is active and the lower PP layer is supportive. The hybrid membrane possesses superhydrophobicity, with an average contact angle of approximately 162°, and showed high performance in terms of rejection and water flux. This work also examined the surface area, pore size distribution, fiber diameter, surface roughness, mechanical strength, water flux, and rejection percentage of the membrane. The salt rejection was above 99.8%, and a high permeate flux of approximately 6.4 LMH was maintained for 16 h of operation.
1. Introduction
A clean water supply is crucial for various aspects of modern life, such as public health, agriculture, and industrial production. However, the scarcity of clean water is a serious concern for many countries. The increasing scarcity of water is also a result of heightened water demand for households, industry, and agriculture. To solve this problem, effective and low-cost techniques for decontaminating water are being investigated.1 Currently, many advanced technologies based on membranes have been developed for water reuse and desalination. Reverse osmosis is a well-known methodology, but it is considerably more expensive than other available technologies; moreover, its use is constrained by the limited amount of permeate water that can be recovered and the environmental impact of the toxic residue remaining after the process. Therefore, a cheaper and more sustainable process with a high recovery rate for water reclamation is required.2The membranes used in membrane distillation (MD) processes, which are commonly composed of hydrophobic materials such as polypropylene (PP), polytetrafluoroethylene (PTFE), and polyvinylidene fluoride (PVDF), are generally fabricated by processes such as thermally induced phase separation, stretching, and phase inversion.3 Direct contact membrane distillation (DCMD) configuration is a type of MD where an aqueous solution at a lower temperature is in direct contact with the permeate stream of the membranes. DCMD has been widely studied because of its convenience and simplicity.4 Recently, the electrospinning technique has been widely used to cast highly hydrophobic MD membranes. Electrospinning is a versatile technology for casting nonwoven sheets of nanofibrous polymeric material for membrane-based purification and separation.5 The electrospun nanofibrous material can easily be spun into structures possessing small pore size and a high surface-area-to-volume ratio, which can be further utilized for MD processes offering high water flux and salt or solute rejection.
Currently, superhydrophobic-surface-specialized structures with versatile characteristics have attracted broad attention in the field of desalination as well as absorption and filtration. Superhydrophobic specialized surfaces fabricated by electrospinning processes have several advantages such as high porosity, submicron pore diameter, nanoscale rough surface morphology, high permeability, and a large surface-area-to-volume ratio.6 MD processes should be able to continuously generate pure water with lower conductivity. However, membrane pore wetting and liquid penetration during long-term MD operation results in decreased salt rejection. Recently, some researchers have shown that an increase in the hydrophobicity of MD membranes can decrease pore wetting effectively.7 Therefore, some researchers are focusing on the development of superhydrophobic membranes by producing rough surfaces or utilizing hydrophobic additives.8 Superhydrophobicity introduces an air gap between water and the membrane surface, which can potentially increase the allowable pore sizes before membrane pore wetting takes place, resulting in higher mass flux.9 Additionally, superhydrophobic membranes limit the heat loss due to conduction, which would otherwise decrease the evaporation (which works as a driving force) and compromise vapor flux. Thus, superhydrophobic modification could decrease the heat loss by conduction across the membrane.10
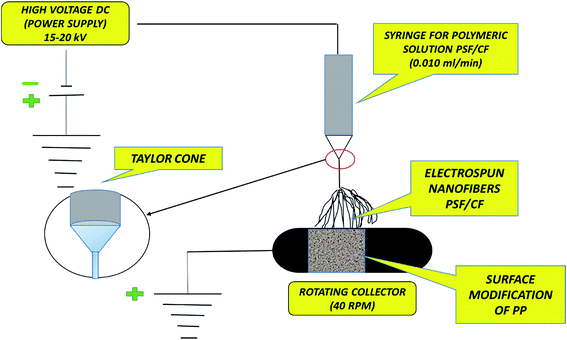
In this study, for the first time, Cera flava has been incorporated into polysulfone (PSF) solution to modify the PP membrane for MD application. Cera flava consists of various components that are typically hydrophobic in nature, such as long-chain hydrocarbons, free acids, and esters. In addition, most of the carbons in Cera flava are internal chain methylene [int-(CH2)] carbons; this specialized structure is responsible for its superhydrophobicity. Cera flava is generally a waste product from honey-based industries. Therefore, it is an economical and easily available material categorized as a solid lipid with very low surface energy; that is, it comprises physiological and compatible lipids with a very high melting point as the solid core. The hydrophobicity of the PSF solution increases with increasing Cera flava concentration. Previous studies have successfully increased surface roughness, resulting in increased surface hydrophobicity of PP membranes, by utilizing the electrospinning of PSF and incorporating Cera flava solution on the PP surface.6,11 Finally, sodium dodecyl sulfate (SDS) surfactant was doped with polysulfone (PSF) for uniformity and homogeneity in fiber diameter. This anionic surfactant was found to be the ideal additive for increasing the conductivity of the PSF polymeric solution, which helps in lowering the critical voltage required to start the electrospinning process, resulting in greater elongation of the nanofibers because of the increase in charge density.12 Fig. 1 illustrates the detailed mechanism of the surface modification of the PP membrane by PSF–CF. The figure also clarifies why the superhydrophobic PSF–CF layer was placed on the feed solution side.
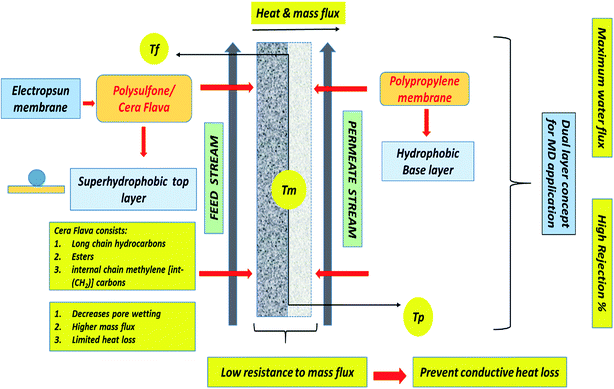 | ||
| Fig. 1 Surface modification of a polypropylene membrane with an electrospun nanofibrous polysulfone layer incorporating Cera flava for improved MD applications. | ||
For instance, electrospun membranes have been reported in many studies and have shown very interesting outcomes while utilizing in MD application. A brief summary of different electrospun nanofibrous membranes utilized in MD system is shown in Table 1. The properties of the proposed membrane were compared with that of other electrospun nanofibrous membranes based on pore size range, contact angle, porosity and membrane material. The present composite membrane achieved higher contact angle with higher degree of porosity.
| Technique utilized | Membrane material | Porosity | Pore size range | Average contact angle | References |
|---|---|---|---|---|---|
| Electrospinning with post treatment | PVDF | 80% | 0.18 μm | ≥150° | 13 |
| Electrospinning followed by hot pressing | PVDF–HFP | 58% | 0.26 μm | 125° | 14 |
| Electro-spinning followed by sintering | PTFE | 72–82% | — | 136.1–157.3° | 15 |
| Electrospinning | PVDF | 58.87% | 1.0 μm | 143–147° | 16 |
| Electrospinning with post heat treatment | PSF–CF/PP | 80–81% | 0.1 μm | 150–162° | Present study |
With the current developments in MD technology, recent research has focused on improving membranes by modifying or changing the surface chemistry.17 This paper includes factors such as high salt rejection (>99%) and high-water flux due to a high surface-area-to-pore-volume ratio; hence, it also confirms the feasibility of the proposed surface-modified membrane. These features place the PSF–CF/PP in a novel category of bilayered membranes for MD processes. Finally, the overall performance of the modified membrane has been thoroughly examined using a thermally driven MD operation to evaluate the water flux and salt rejection of a 30 g L−1 NaCl aqueous solution. Moreover, this paper provides the fundamental concepts for developing other novel bilayered superhydrophobic membranes for MD processes.
2. Materials and methods
2.1 Starting material
PSF with a molecular weight of 35![[thin space (1/6-em)]](https://www.rsc.org/images/entities/char_2009.gif) 000 was ordered from Sigma Aldrich by LS, sodium dodecyl sulfate (SDS) was purchased from Sigma Aldrich and natural honey was acquired from a forest in Taiwan. PP was provided by BenQ, Taiwan.
000 was ordered from Sigma Aldrich by LS, sodium dodecyl sulfate (SDS) was purchased from Sigma Aldrich and natural honey was acquired from a forest in Taiwan. PP was provided by BenQ, Taiwan.
2.2 Experimental
Table 2 lists the electrospinning process parameters such as the voltage, flow rate, current temperature, and distance between the needle tip (jet) and metal collector (roller) applied in the electrospinning of the PSF–CF solution at various concentrations onto the PP mats.
| Membrane type (concentration % of electrospinning solution) | Temperature (°C) | Flow rate (ml min−1) | Applied voltage (kV) | Current (mA) | Distance between needle tip (jet) and metal collector (cm) | Metal Collector Roller (rpm) |
|---|---|---|---|---|---|---|
| 16% PSF–CF(5%)/PP | 24.5 | 0.008 | 19 | 0.004 | 12 | 30 |
| 16% PSF–CF(7.5%)/PP | 24.5 | 0.008 | 19 | 0.004 | 12 | 30 |
| 16% PSF–CF(10%)/PP | 24.5 | 0.008 | 19 | 0.004 | 12 | 30 |
The permeate flux Jw (L m−2 h−1; LMH) was measured in terms of the total volume of the permeate water using eqn (1)2,20
 | (1) |
 | (2) |
2.3 Characterization
The surface morphology was studied using scanning electron microscopy (SEM; JEOL JSM-5900, Japan). The contact angle of the membrane was analyzed with the OSATM optical surface analyzer (OSA60-G, Ningbo NB Scientific Instruments Co., Ltd., China) to measure its hydrophobicity. The surface roughness was examined with atomic force microscopy (AFM). Membrane surface properties such as pore size, pore diameter, and surface area were observed using an adsorption/desorption analyzer (Micromeritics N2, ASAP 2020, USA).2.4 Quality control
To obtain reliable results, the experiments were performed in triplicate and the mean values were recorded. Error bars are based on the standard errors of the three replicate tests.213. Results and discussion
3.1 Physical properties of solution
| Polymeric solution | Conductivity (μS cm−1) | Viscosity (cP) |
|---|---|---|
| PSF (only) | 10.5 | 121.3 |
| PSF–CF(0%) | 1105.5 | 135.0 |
| PSF–CF(5%) | 1157.1 | 135.9 |
| PSF–CF(7.5) | 1182.0 | 137.6 |
| PSF–CF(10%) | 1197.9 | 139.1 |
3.2 Characterization of the membranes
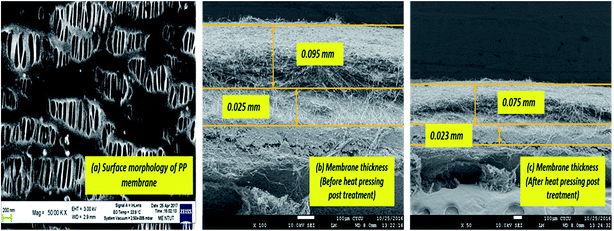
Fig. 7 is a cross-sectional view of the PSF–CF/PP membrane, which also shows the morphology of the PP membrane. The SEM images indicate a significant decrease in membrane thickness after heat-pressing posttreatment.
The BET surface area indicates multilayer adsorption whereas the Langmuir surface area indicates monolayer adsorption.25 Initially, the BET and Langmuir surface areas seemed to increase after the modification of PP mat with PSF–CF, although with little difference in the pore volume. Fig. 9 indicates the surface area analysis along with the pore volume, which confirmed that almost all the modified membranes shows higher surface-area-to-volume ratio range. This effect can be seen in water flux as well which has been discussed in next part.
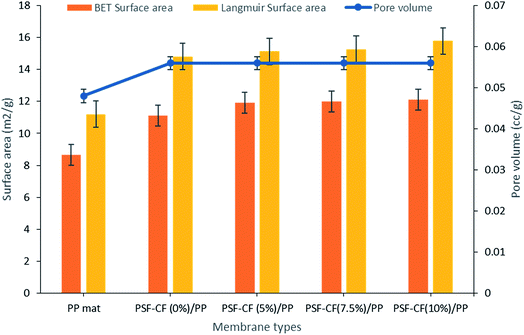 | ||
| Fig. 9 Surface area and pore volume analysis of various modified membranes [note: error bars are based on standard errors from three replicate tests]. | ||
Table 4 shows the surface-area to volume ratio (considering BET surface area and Langmuir surface area). Interestingly, almost all the modified membranes possess higher surface area to volume ratio that indicates higher water flux range compared to PP mat.
| Membrane | BET surface area to volume ratio (m2 cc−1) | Langmuir surface area to volume ratio (m2 cc−1) |
|---|---|---|
| PP mat | 180.41 | 233.33 |
| PSF–CF(0%)/PP | 198.21 | 264.2 |
| PSF–CF(5%)/PP | 212.67 | 271.41 |
| PSF–CF(7.5%)/PP | 214.28 | 272.5 |
| PSF–CF(10%)/PP | 214.47 | 281.78 |
The thickness of the PP membrane was found to be 0.020 mm, which is thin compared to other available commercial membranes. However, the membrane thickness was increased 3–4 times with the surface modification of electrospun PSF–CF nanofibers. In general, the membrane thickness may influence the water flux and decrease the thermal resistance (by reducing the heat efficiency or interface temperature difference) as the membrane becomes thinner.26 According to eqn (3), decreasing the thickness of the membrane also increases the sensible heat loss from the hot feed stream to the cold permeate stream, which leads to a decline of water flux because of decreased interfacial temperature differences (vapor pressure difference). Therefore, the membrane thickness must be optimized for efficient performance in MD processes.20a,27
 | (3) |
Table 5 shows the comparative thicknesses as well as average contact angle of the different membranes before and after heat pressing treatment. Interestingly, the post heat treatment resulted in smoother surfaces that reduces average contact angle in the resultant membrane. Though the decrease in contact angle was found to be insignificant in this study, it can be suggested that the post heat-treatment has an impact on surface roughness as well as thickness of the membrane. The thickness of the surface-modified membrane was comparable to those of the commercially available membranes for MD applications (varying from 0.08 to 0.2 mm).
| Membrane types | Thickness before heat pressing treatment (mm) | Thickness after heat pressing treatment (mm) | Contact angle before heat pressing treatment (°) | Contact angle after heat pressing treatment (°) | Tensile strength after heat pressing treatment (MPa) |
|---|---|---|---|---|---|
| a Note: tensile strength analysis has been conducted by utilizing an Instron mechanical tester at a tensile speed of 20 mm min−1. | |||||
| PP mat | 0.025 | 0.023 | 92.1 | 90.5 | 33.1 |
| PSF–CF(0%)/PP | 0.121 | 0.092 | 131.7 | 130.1 | 34.6 |
| PSF–CF(5%)/PP | 0.122 | 0.096 | 152.6 | 150.7 | 34.6 |
| PSF–CF(7.5%)/PP | 0.120 | 0.095 | 160.1 | 158.9 | 35.1 |
| PSF–CF(10%)/PP | 0.122 | 0.095 | 163.9 | 162 | 35.2 |
As reported earlier, capillary flow porometry (CFP) measures only the throat diameter of each through pore, one diameter per through pore is measured. Blind pores are not measured.28 Thus, in this study, BJH adsorption/desorption technique has been utilized to determine detailed information of membrane morphology. In addition to that, the pore width ranges from 20 nm to 35 nm for all the fabricated membranes and hence, BJH technique seems to be suitable for analysing the pore size. Even specific surface area, pore size distribution, total pore area and total pore volume can be easily measured by BJH adsorption/desorption technique. Hence, the average pore width and pore diameters of the PP and modified PSF–CF/PP membranes were analyzed using BJH adsorption/desorption techniques. Little difference was found in pore diameter when the concentration of PSF–CF was increased (Fig. 10). Therefore, the PSF–CF/PP membrane is expected to show a higher rejection percentage than the PP membrane because of the lower pore diameter range. In general, the salt rejection of a membrane design is dependent on both pore geometry and pore size; therefore, this study evaluated both the pore diameter and salt rejection. Smaller pore diameters clearly exhibited a higher rejection percentage. To support previous outcomes, the average pore widths of these membranes were analyzed, and PSF–CF/PP was found to possess a very small pore width (20 nm) compared with that of the PP membrane. Fig. 10 shows the pore width distribution based on different concentrations of PSF–CF on the PP membrane.
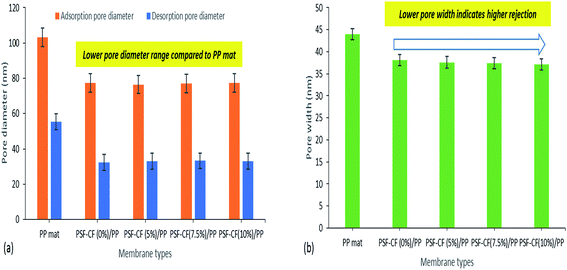 | ||
| Fig. 10 BJH adsorption/desorption average pore diameter and average pore width for various modified membranes [note: error bars were based on the standard errors of three replicate tests]. | ||
Typically, wetting can be directly analysed by contact angle. In general, smaller pore size, greater contact angle and surface tension increase the value of liquid entry pressure (LEP). The wetting of the membrane pores leads to reduced product quality; hence, it is advantageous to utilize membranes with high LEP value.29 Franken et al.30 has suggested a model to evaluate LEP value based on Cantor–Laplace equation30 eqn (4):
 | (4) |
![[thin space (1/6-em)]](https://www.rsc.org/images/entities/char_2009.gif) θ is the contact angle in degree, rmax is the maximal pore (non-closed) radius in m.
θ is the contact angle in degree, rmax is the maximal pore (non-closed) radius in m.
In addition to that, higher porosity is favoured for higher flux31 Table 6 shows the LEP values that was calculated using the Cantor–Laplace equation whereas, the porosity of membrane was measured by BJH adsorption and desorption technique. Interestingly, the fabricated membranes PSF–CF/PP show higher degree of porosity than compared to PP mat which indirectly indicates higher water flux. This effect can be clearly seen in Fig. 11 and 12.
| Membrane Type | Average contact angle (°) | LEP (Bar) | Porosity (%) |
|---|---|---|---|
| PP mat | 90.5° | 0.22 | 71% |
| PSF–CF(0%)/PP | 130.1° | 4.12 | 80.1% |
| PSF–CF(5%)/PP | 150.7° | 4.58 | 80.2% |
| PSF–CF(7.5%)/PP | 158.9° | 4.79 | 80.2% |
| PSF–CF(10%)/PP | 162.0° | 4.97 | 81% |
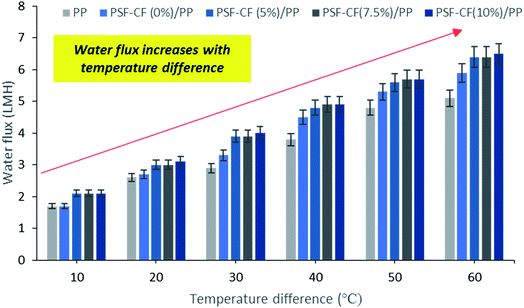 | ||
| Fig. 11 Effect of temperature difference on water flux in MD [note: feed solution = 30 g L−1 NaCl solution, time period = 1 h]. Error bars are based on standard errors from three replicate tests. | ||
3.3 Membrane distillation application
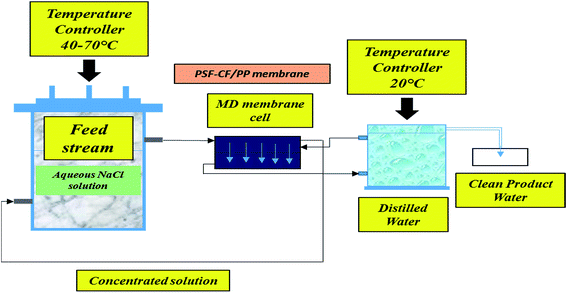
The MD process was performed in the lab as indicated in Fig. 3. Aqueous NaCl solution with 30 g L−1 concentration was used as the feed solution. The temperature of the feed was controlled by a water bath, and varied between 30 °C and 80 °C. The temperature of the cooling side was constantly maintained at 20 °C by circulating a relatively large amount of water through an air cooling system. The effective membrane area measured 100 cm2 (10 cm × 10 cm). A mesh spacer was utilized in this MD process, working as a turbulence promoter that could reduce the thermal polarization on the feed stream of the membrane, resulting in higher mass transport.32 The salt concentration of the feed solution stream and the permeate water quality were measured by a professional series and a conductivity meter/TDS/DO (YSI Quatro, USA).The results of the MD process demonstrate a sharp increase in water flux with an increasing temperature difference up to 80 °C (ΔT = 60 °C). The water flux varied from 4.5 to 6.4 LMH, which suggests stronger temperature dependence with the water flux. Thus, PSF–CF(10%)/PP shows maximum water flux for the highest surface-area-to-pore-volume ratio. Fig. 11 indicates an increase in water flux with an increase in temperature difference for the various membranes used in distillation.
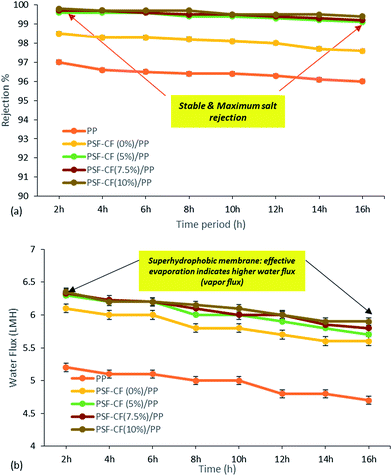
Fig. 12 compares the water flux and salt rejection percentage over time. The MD process was continued for up to 16 hours for the various membranes to test their stability for long-term operation. The water flux and salt rejection declined slightly with increasing time duration. PSF–CF(10%)/PP possesses a maximum water flux of 6.4 LMH and rejection of 99.8%. The negligible water flux decline over time clearly indicates the higher stability and durability of the PSF sublayer on the PP membrane. Moreover, the interconnectivity of the PP membrane with the superhydrophobic layer (PSF–CF) is demonstrated by the stable water flux and salt rejection over 16 hours of operation. During the MD process, a stable water flux of 6.4 LMH was achieved, indicating the stability of the superhydrophobic/hydrophobic dual-layer composite membrane. Regarding surface area to pore volume ratio, the water flux of the PSF–CF/PP membrane was expected to exceed that of PP mat. Even, the superhydrophobic membrane composed of Cera flava indicates higher water flux compared to other membranes due to effective evaporation (higher vapor flux). In other words, the increased superhydrophobicity is responsible for higher and stable water flux while utilizing in MD application. Moreover, the salt rejection of all the modified membranes seems to be 99.5–99.8%, indicating higher permeate quality in the permeate stream as compared to the commercial PP mat which can be clearly identified in Fig. 12. The Cera flava based superhydrophobic modified membranes have indicated higher rejection as compared to hydrophobic membranes such as PSF/PP and PP mat. Thus, it can be concluded that, the superhydrophobicity has increased salt rejection in membrane distillation application due to higher wetting resistibility.
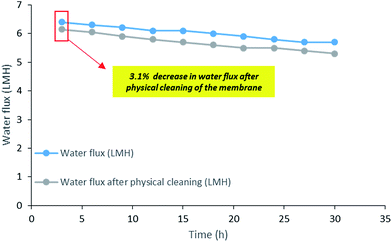
The long term operation of PSF–CF(10%)/PP membrane was examined as it shows better efficiency compared to other membranes. Fig. 13 shows the reusability of the membrane which was analysed by evaluating the decrease in water flux after physical cleaning of the membrane. In this experiment, the same membrane was used for 30 h to analyse the long-term stability of the membrane. Interestingly, only 3.1% decrease in water flux initially was calculated. Thus, the decrease in water flux seems to be insignificant after reusing it for 30 h which directly indicates the self-cleaning property of this PSF–CF/PP superhydrophobic membrane.
4. Conclusion
In this study, electrospinning was used to generate a superhydrophobic nanofibrous nonwoven PSF layer on the surface of a hydrophobic PP membrane used for MD desalination. The results demonstrate that with a high voltage of 19–20 kV, a spinneret-to-collector distance of 12 cm, and a PSF solution concentration of 16% w/v incorporating Cera flava, the formation of superhydrophobic nanofibers can be achieved. The hybrid membrane consisting of 10 v/v% Cera flava (PSF–CF(10%)) possesses superhydrophobicity, with an average contact angle of approximately 162°. In addition, the membrane's morphology, contact angle, pore size distribution, BET surface area, and pore volume were thoroughly examined and compared with those of a standard PP membrane. The water flux and salt rejection percentage were also tested using 30 g L−1 of NaCl solution in the feed stream. Changes in the surface chemistry of the modified dual-layered PSF–CF/PP membranes resulted in a higher pore volume, producing twice the water flux of the PP membrane. Furthermore, this dual-layered membrane achieved 99.8% salt rejection. In conclusion, because the PSF–CF/PP membrane achieved an improved rejection percentage and stable water flux, PSF–CF is an ideal choice for modifying the surface of PP membranes for long-term MD operations.Conflicts of interest
The authors declare that they have no competing interests.Acknowledgements
The authors would like to acknowledge the financial assistance from the Ministry of Science and Technology (MOST), Republic of China (Taiwan) and Institute of Environmental Engineering and Management (IEEM), National Taipei University of Technology under the grant number: 104-2221-E-027-004-MY3.References
- C. J. Vörösmarty, P. B. McIntyre, M. O. Gessner, D. Dudgeon, A. Prusevich, P. Green, S. Glidden, S. E. Bunn, C. A. Sullivan and C. R. Liermann, Nature, 2010, 467, 555 CrossRef PubMed.
- S. S. Ray, S.-S. Chen, N. C. Nguyen, H. T. Nguyen, C.-W. Li, J. Wang and B. Yan, Chem. Eng. J., 2016, 304, 962 CrossRef CAS.
- (a) E. Curcio and E. Drioli, Sep. Purif. Rev., 2005, 34, 35 CrossRef CAS; (b) A. Basile, A. Figoli and M. Khayet, Pervaporation, vapour permeation and membrane distillation: Principles and applications, Elsevier, 2015 Search PubMed.
- F. Laganà, G. Barbieri and E. Drioli, J. Membr. Sci., 2000, 166, 1 CrossRef.
- D. R. Lloyd, K. E. Kinzer and H. Tseng, J. Membr. Sci., 1990, 52, 239 CrossRef CAS.
- C. Reshmi, S. P. Sundaran, A. Juraij and S. Athiyanathil, RSC Adv., 2017, 7, 2092 RSC.
- (a) M. Gryta, J. Membr. Sci., 2005, 265, 153 CrossRef CAS; (b) A. Nakajima, K. Hashimoto and T. Watanabe, Monatsh. Chem. Chem. Mon., 2001, 132, 31 CrossRef CAS.
- (a) H. Zhang, R. Lamb and J. Lewis, Sci. Technol. Adv. Mater., 2005, 6, 236 CrossRef CAS; (b) J. Zhang, Z. Song, B. Li, Q. Wang and S. Wang, Desalination, 2013, 324, 1 CrossRef CAS; (c) J. E. Efome, M. Baghbanzadeh, D. Rana, T. Matsuura and C. Q. Lan, Desalination, 2015, 373, 47 CrossRef CAS; (d) D. Zhao, J. Zuo, K.-J. Lu and T.-S. Chung, Desalination, 2017, 413, 119 CrossRef CAS.
- M. M. Teoh and T.-S. Chung, Sep. Purif. Technol., 2009, 66, 229 CrossRef CAS.
- (a) A. Razmjou, E. Arifin, G. Dong, J. Mansouri and V. Chen, J. Membr. Sci., 2012, 415, 850 CrossRef; (b) Z.-Q. Dong, X.-H. Ma, Z.-L. Xu and Z.-Y. Gu, RSC Adv., 2015, 5, 67962 RSC.
- K. Boussu, B. Van der Bruggen, A. Volodin, J. Snauwaert, C. Van Haesendonck and C. Vandecasteele, J. Colloid Interface Sci., 2005, 286, 632 CrossRef CAS PubMed.
- S. S. Ray, S.-S. Chen, H.-T. Hsu, D.-T. Cao, H.-T. Nguyen and N. C. Nguyen, Sep. Purif. Technol., 2017, 186, 352–365 CrossRef CAS.
- Y. Liao, R. Wang and A. G. Fane, J. Membr. Sci., 2013, 440, 77 CrossRef CAS.
- B. S. Lalia, E. Guillen-Burrieza, H. A. Arafat and R. Hashaikeh, J. Membr. Sci., 2013, 428, 104 CrossRef CAS.
- T. Zhou, Y. Yao, R. Xiang and Y. Wu, J. Membr. Sci., 2014, 453, 402 CrossRef CAS.
- M. Essalhi and M. Khayet, J. Membr. Sci., 2014, 454, 133 CrossRef CAS.
- (a) C. Feng, K. Khulbe, T. Matsuura, R. Gopal, S. Kaur, S. Ramakrishna and M. Khayet, J. Membr. Sci., 2008, 311, 1 CrossRef CAS; (b) J. Prince, G. Singh, D. Rana, T. Matsuura, V. Anbharasi and T. Shanmugasundaram, J. Membr. Sci., 2012, 397, 80 CrossRef.
- (a) S. S. Ray, S.-S. Chen, C.-W. Li, N. C. Nguyen and H. T. Nguyen, RSC Adv., 2016, 6, 85495 RSC; (b) T. J. Sill and H. A. von Recum, Biomaterials, 2008, 29, 1989 CrossRef CAS PubMed.
- (a) J. Zhao, Z. Wang, J. Wang and S. Wang, J. Membr. Sci., 2006, 283, 346 CrossRef CAS; (b) A. Rahimpour, S. Madaeni, M. Amirinejad, Y. Mansourpanah and S. Zereshki, J. Membr. Sci., 2009, 330, 189 CrossRef CAS.
- (a) N. C. Nguyen, S.-S. Chen, H. T. Nguyen, Y.-H. Chen, H. H. Ngo, W. Guo, S. S. Ray, H.-M. Chang and Q. H. Le, Sep. Purif. Technol., 2017 DOI:10.1016/j.seppur.2017.01.011; (b) N. C. Nguyen, S.-S. Chen, S.-T. Ho, H. T. Nguyen, S. S. Ray, N. T. Nguyen, H.-T. Hsu, N. C. Le and T. T. Tran, Sep. Purif. Technol., 2017 DOI:10.1016/j.seppur.2017.02.001.
- (a) K. N. Kontogiannopoulos, A. N. Assimopoulou, I. Tsivintzelis, C. Panayiotou and V. P. Papageorgiou, Int. J. Pharm., 2011, 409, 216 CrossRef CAS PubMed; (b) S. S. Ray, S.-S. Chen, N. C. Nguyen, H.-T. Hsu, H. T. Nguyen and C.-T. Chang, Desalination, 2017, 414, 18 CrossRef CAS.
- (a) E. S. Araújo, M. L. F. Nascimento and H. P. d. Oliveira, Fibres Text. East. Eur., 2013, 21(4), 39–43 Search PubMed; (b) X. Zong, K. Kim, D. Fang, S. Ran, B. S. Hsiao and B. Chu, Polymer, 2002, 43, 4403 CrossRef CAS.
- (a) P. Gupta, C. Elkins, T. E. Long and G. L. Wilkes, Polymer, 2005, 46, 4799 CrossRef CAS; (b) H. Fong, I. Chun and D. Reneker, Polymer, 1999, 40, 4585 CrossRef CAS.
- (a) N. P. Gule, M. de Kwaadsteniet, T. E. Cloete and B. Klumperman, Macromol. Mater. Eng., 2012, 297, 609 CrossRef CAS; (b) R. Gopal, S. Kaur, Z. Ma, C. Chan, S. Ramakrishna and T. Matsuura, J. Membr. Sci., 2006, 281, 581 CrossRef CAS.
- (a) X. Zhang, J. H. Pan, A. J. Du, W. Fu, D. D. Sun and J. O. Leckie, Water. Res., 2009, 43, 1179 CrossRef CAS PubMed; (b) J. H. Pan, X. Zhang, A. J. Du, D. D. Sun and J. O. Leckie, J. Am. Chem. Soc., 2008, 130, 11256 CrossRef CAS PubMed.
- J. Zhang and S. Gray, J. Membr. Sci., 2011, 369, 514 CrossRef CAS.
- L. M. Camacho, L. Dumée, J. Zhang, J.-d. Li, M. Duke, J. Gomez and S. Gray, Water, 2013, 5, 94 CrossRef.
- A. Jena and K. Gupta, Int. Nonwovens J., 2005, 14, 25 Search PubMed.
- G. Rácz, S. Kerker, Z. Kovács, G. Vatai, M. Ebrahimi and P. Czermak, Period. Polytech., Chem. Eng., 2014, 58, 81 Search PubMed.
- A. Franken, J. Nolten, M. Mulder, D. Bargeman and C. Smolders, J. Membr. Sci., 1987, 33, 315 CrossRef CAS.
- S. Adnan, M. Hoang, H. Wang and Z. Xie, Desalination, 2012, 284, 297 CrossRef CAS.
- (a) J. Zhang, N. Dow, M. Duke, E. Ostarcevic and S. Gray, J. Membr. Sci., 2010, 349, 295 CrossRef CAS; (b) F. Guo, A. Servi, A. Liu, K. K. Gleason and G. C. Rutledge, ACS Appl. Mater. Interfaces, 2015, 7, 8225 CrossRef CAS PubMed.
| This journal is © The Royal Society of Chemistry 2018 |

