 Open Access Article
Creative Commons Attribution 3.0 Unported Licence
Facile synthesis of high-surface-area nanoporous carbon from biomass resources and its application in supercapacitors†
Yuechao Yao a,
Qi Zhangc,
Peng Liua,
Liang Yua,
Lin Huang
 ab,
Shao-Zhong Zeng
 ab,
Lijia Liuab,
Xierong Zenga and
Jizhao Zou*a
aShenzhen Key Laboratory of Special Functional Materials, Shenzhen Engineering Laboratory for Advance Technology of Ceramics, College of Materials Science and Engineering, Shenzhen University, Shenzhen, 518060, P. R. China. E-mail: zoujizhao@szu.edu.cn
bKey Laboratory of Optoelectronic Devices and Systems of Ministry of Education and Guangdong Province, College of Optoelectronic Engineering, Shenzhen University, Shenzhen 518060, P. R. China
cSchool of Aerospace, Transport and Manufacturing, Cranfield University, Cranfield, Bedfordshire MK43 0AL, UK
First published on 9th January 2018
Abstract
It is critical for nanoporous carbons to have a large surface area, and low cost and be readily available for challenging energy and environmental issues. The pursuit of all three characteristics, particularly large surface area, is a formidable challenge because traditional methods to produce porous carbon materials with a high surface area are complicated and expensive, frequently resulting in pollution (commonly from the activation process). Here we report a facile method to synthesize nanoporous carbon materials with a high surface area of up to 1234 m2 g−1 and an average pore diameter of 0.88 nm through a simple carbonization procedure with carefully selected carbon precursors (biomass material) and carbonization conditions. It is the high surface area that leads to a high capacitance (up to 213 F g−1 at 0.1 A g−1) and a stable cycle performance (6.6% loss over 12![[thin space (1/6-em)]](https://www.rsc.org/images/entities/char_2009.gif) 000 cycles) as shown in a three-electrode cell. Furthermore, the high capacitance (107 F g−1 at 0.1 A g−1) can be obtained in a supercapacitor device. This facile approach may open a door for the preparation of high surface area porous carbons for energy storage.
000 cycles) as shown in a three-electrode cell. Furthermore, the high capacitance (107 F g−1 at 0.1 A g−1) can be obtained in a supercapacitor device. This facile approach may open a door for the preparation of high surface area porous carbons for energy storage.
1. Introduction
Supercapacitors have been used in energy storage devices and have been a hot research area, due to their long cycle life and high power density.1–3 Supercapacitors can be divided into electrical double layer capacitors (EDLC) and Faraday capacitors (pseudocapacitor). EDLCs store the charge electrostatically by reversible desorption–adsorption of ions at the interface between the electrolyte and active materials. Currently, the main commercially available supercapacitors, EDLC, use carbon-based materials as electrode active materials, due to their extraordinary cycle stability, high power density, easy fabrication and non-toxicity.4 Carbon materials, such as nanoporous carbon,5–7 graphene,8–10 carbon nanotubes,11,12 carbon nanofibers,13–15 etc. have been widely used in supercapacitors. The higher capacitance of carbon materials is highly demanded. To provide high capacitance, a large specific surface area (SSA) and high porosity are desired because more electrons can be effectively stored in electric double layer capacitors (EDLC).16–18 Moreover, the hydrophilicity of carbon materials is another important factor that affects the electrochemical performance because a poor contact between electrode and electrolyte in the aqueous medium would lead to the reduced effective SSA.19In recent years, many strategies have been reported to obtain nanoporous carbon (NPC) with high SSAs, including carbonization of high SSAs metal–organic frameworks (MOFs),20,21 physical chemical activation,10,22–26 and nanocasting strategy with hard templates27 (for example, nanoporous silica). Although NPC of high SSAs was obtained by above these methods, their processes of production were very complicated and costly.
Lately, the NPC materials from renewable biomass resources through pyrolysis method have attracted much attention due to their sustainability and low cost.28–32 Duan et al. reported carbon nanofibrous microspheres (the SSA up to 1141 m2 g−1) derived from renewable chitin.33 In the organic electrolyte, the energy density of the carbon nanofibrous microspheres reached up to 58.7 W h kg−1 in supercapacitors. Moreover, Liu et al. reported a porous carbon fibers by using cotton as carbon precursor via the pretreatment of fiber in NaOH/urea solution and a subsequent carbonization process.34 These porous carbon fibers exhibit a high electric double layer capacitance (221.7 F g−1 at 0.3 A g−1). A series of high SSA NPC materials have been obtained from renewable biomass resources through pyrolysis. However, almost all reported processes are complicated and need pre-treatment for the precursors or following activation process. Therefore, a facile method of calcining renewable biomass resources to obtain high SSA NPC materials is highly desired.
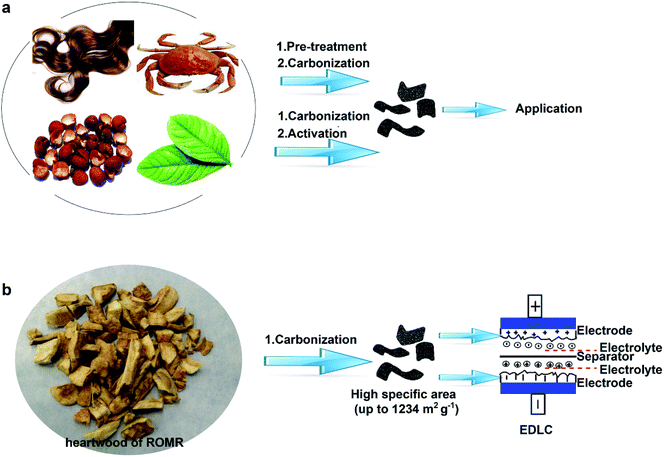
In this study, we reported a facile and cost-effective method to produce NPC materials with high SSA by carbonizing heart wood of Root of Multibract Raspberry (ROMR explanation, S1†). Compared to the other processes for pre-treatment or activation step (Scheme 1a), the high SSA (1234 m2 g−1) was obtained simply by the direct carbonization of precursor at 900 °C in our process as shown in Scheme 1b. The electrochemical performance of the obtained NPC materials in supercapacitors was systematically studied. The results showed a high capacitance (up to 213 F g−1 at 0.1 A g−1) and a stable cycle performance (6.6% loss over 12![[thin space (1/6-em)]](https://www.rsc.org/images/entities/char_2009.gif) 000 cycles) in a three-electrode cell.
000 cycles) in a three-electrode cell.
2. Experimental section
2.1 Synthesis of NPC
The precursor for porous carbon was obtained by extracting the inner component of Root of Multibract Raspberry and was dried in an oven at 100 °C for 24 h. The dried precursor was carbonized in a tubular furnace at 800, 900 and 1000 °C for 2 h at a heating rate of 10 °C min−1 under an Ar atmosphere. The obtained carbon materials were treated with 1 mol L−1 hydrochloric acid, and washed several times with deionized water and vacuum dried at 120 °C for 24 h. The final products were labeled as NPC-800, NPC-900 and NPC-1000.2.2 Materials characterization
Field emission scanning electron microscopy (FESEM) images were captured by a Hitachi SU-70 FESEM instrument, and transmission electron microscopy (TEM) was conducted via a JEOL 2011 TEM facility. X-ray diffraction (XRD) patterns were recorded on a Bruker D8 advance powder X-ray diffractometer using a Cu Kα radiation. Elemental analysis was acquired using a Vario EL cube elemental analyzer. The specific surface areas were determined by the gas sorption technique using a Micromeritics ASAP 2020 based on the Brunauere–Emmette–Teller (BET) method. Laser Raman spectroscopy was performed on a Renishaw inVia Spectrometer. X-ray photoelectron spectroscopy (XPS) was investigated on a ULVAC-PHI 1800 spectrometer. The electrochemical properties were examined on an electrochemistry workstation (CHI660E).2.3 The fabrication of supercapacitor electrode and electrochemical measurements
All electrochemical measurements were carried out in a standard three-electrode electrochemical cell equipped with a Pt counter electrode, an Hg/HgO reference electrode. The NPC electrodes were prepared by mixing 85 wt% active materials, 10 wt% acetyleneblack and 5 wt% polytetrafluoroethylene with ethanol to form slurries that were then spread onto nickel foams with the coating area of 1 cm2. These foams were dried at 110 °C under vacuum overnight and then pressed under a pressure of 10 MPa to completely adhere to the electrode materials. The loading mass of active materials on the prepared working electrode is approximately 3 mg cm−2.The electrochemical performances were characterized in a three-electrode system using 6 M KOH as electrolyte, a saturated calomel electrode as reference electrode, and a platinum foil as a counter electrode. CV measurements were performed over the potential range from 0 to −1 V in 6 M KOH, at scan rates of 5, 10, 25, 50 and 100 mV s, respectively. Electrochemical impedance spectroscopy (EIS) measurements were taken over the frequency range from 100 kHz to 0.01 Hz. In the three-electrode configuration, the specific capacitance, C3E, was calculated from the discharge curve according to eqn (1):
| C3E = IΔt/(mΔV) | (1) |
The electrochemical performance was also tested in a 2-electrode symmetric supercapacitor configuration. In this configuration, the C2E of NPC was calculated based on eqn (2):
| C2E = 4IΔt/(mΔV) | (2) |
3. Results and discussion
Fig. 1 illustrates the mechanism for the synthesis of the ROMR (Fig. 1a) derived nanoporous carbon (NPC) by self-activation. The seed plants can be divided into two types, angiosperm and gymnosperms. ROMR belongs to angiosperm, and their trunk is made of xylem and phloem as shown in Fig. 1b. Moreover, there are a large amount of perforation plates in xylem area. This special structure plays a transportation aisle (H2O) role in ROMR, and has a lot of pores to store moisture. These pores can be maintained after calcination. The EDX result of xylem was exhibited in Fig. 1c–e, and a lot of inorganic salts (Al, Ca, K) were found. The specific content of Al, Ca, K were investigated by EDX mapping and are 0.16 wt%, 0.87 wt% and 0.49 wt% in precursor, respectively (Table S1†). These meltable salts play an activation role and step up the improvement of SSA in NPC materials.35–37 In a word, after calcination the high SSA of NPC materials were attributed to the co-work of special perforation plates and inorganic salts. In view of above two points, the heartwood of ROMR was selected. They are widely distributed in China has fully illustrated that they can get widely application.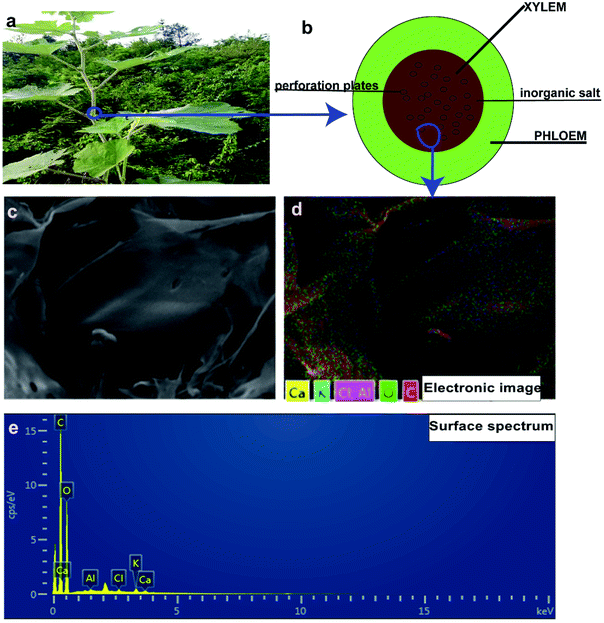 | ||
| Fig. 1 (a) The digital photos of ROMR. (b) The images of internal anatomy for ROMR trunk. (c–e) The EDX results of the calcination precursor. | ||
Next, the microstructure of heartwood of ROMR and NPC materials was observed by SEM and TEM. The architecture of precursors before calcination shows a 3D sheet morphology (Fig. 2a). The higher magnification SEM (Fig. 2b) of heartwood of ROMR shows a lot of perforation plates (pores) and corresponding to the Fig. 1b results. After calcination, the SEM images of NPC were showed in Fig. 2c, the 3D sheet structure can be maintained. Moreover the higher magnification SEM is provided in Fig. 2d, the nanoporous carbon was clearly observed, especially mesopores. As shown in Fig. 2e, a lot of bright pores can be clearly observed in NPC. Moreover, the high magnification TEM results of NPC further illustrated these pores (Fig. 2f).
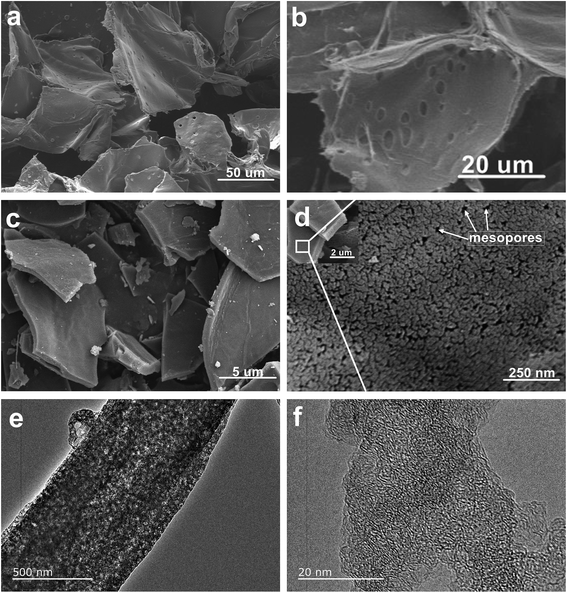 | ||
| Fig. 2 (a and b) SEM images of ROMR trunk inner structure. SEM images (c and d) and TEM (e and f) of NPC-900. | ||
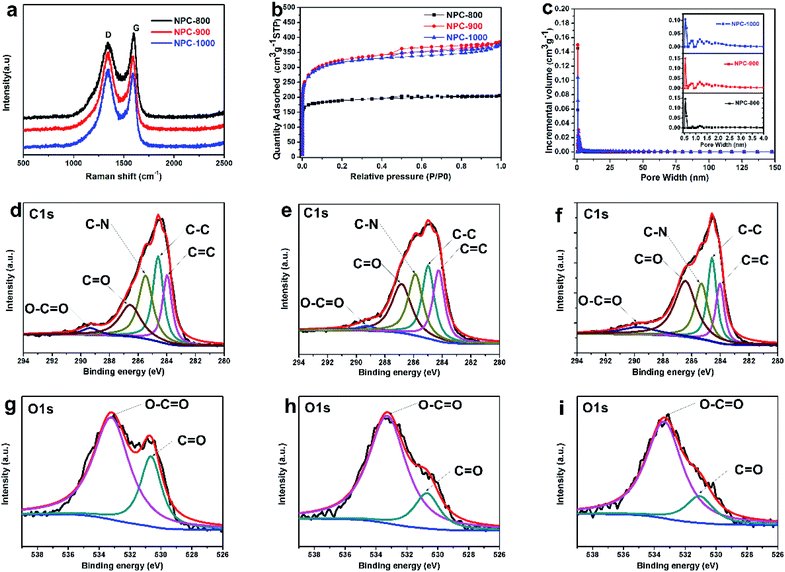
To investigate the influence of different calcination temperature on NPC physical performance, the precursor materials were calcined at 800, 900, and 1000 °C. The XRD patterns of NPC for different calcination temperatures were exhibited in Fig. S2.† The XRD profiles showed two broad peaks located at ∼23° and ∼44° corresponding to the (002) and (100) reflections of carbon materials, respectively. The NPC-800 has a relatively high (002) peak intensity compared to that of others, indicating a higher degree of graphitization in all NPC materials.38 In contrast, for the NPC-900 and NPC-1000 samples, the peak at ∼23° became a lower shoulder while a large increase in the low-angle scatter was observed instead, indicating a lot of nanoporous existing.39 The results were consistent with the previous TEM. Moreover, the Raman spectrum has further proved the above consequence as shown in Fig. 3a. The graphitic layers are reflected by the G band value, while the D band corresponds to disordered carbon or defective graphitic structures.29 The intensity ratio (ID/IG) of these two peaks partially depends on the graphitization degree.40 The D peak value at ∼1349 cm−1 increased drastically with the increases of calcination temperature, indicating more disorder carbon produced. The NPC-800 gets the better graphitization degree with lower ID/IG ratio (0.88). With the increase of pyrolysis temperature, the ID/IG ratio increased to 0.912 (NPC-800) and 1.063 (NPC-1000). The existence of a lot of disorder carbon in NPC-900 and NPC-1000 resulted in high SSA as shown in Table 1. The nitrogen adsorption–desorption measurements were conducted to analyze the detailed pore structure of the NPC materials obtained by calcination at 800, 900 and 1000 °C. The N2 absorption analysis of NPC-900 and 1000 shows type-IV curve with a gradual capillary condensation step (hysteresis loop) in the relative pressure range of 0.5–0.8 (Fig. 3b), suggesting the existence of hierarchical mesopores structures.41 As shown in Fig. 3c (inset) the pore size distribution shows uniform micropores with average diameters of 0.5 nm and some mesopores with average diameters of 2.5 nm. For NPC-800, 900 and 1000, the SSA were 589, 1234 and 1209 m2 g−1, respectively. The corresponding pore volume was 0.32, 0.59 and 0.57 cm3 g−1, respectively. From the XPS investigation of the NPC materials, three elements, carbon, oxygen and nitrogen, were detected (Fig. S3†). The C 1s spectrum of the NPC carbon was fitted using five component peaks with binding energy of∼284.4, ∼284.9, ∼285.7, ∼286.7 and ∼289.2 eV (Fig. 3d–f), attributed to the contribution of C![[double bond, length as m-dash]](https://www.rsc.org/images/entities/char_e001.gif) C, C–C, C–N, C
C, C–C, C–N, C![[double bond, length as m-dash]](https://www.rsc.org/images/entities/char_e001.gif) O and O–C
O and O–C![[double bond, length as m-dash]](https://www.rsc.org/images/entities/char_e001.gif) O, respectively.33,39 The high-resolution O 1s spectrum (Fig. 3g–i) can be divided into two peaks located at ∼531.2 and ∼533.5 eV, corresponding to C
O, respectively.33,39 The high-resolution O 1s spectrum (Fig. 3g–i) can be divided into two peaks located at ∼531.2 and ∼533.5 eV, corresponding to C![[double bond, length as m-dash]](https://www.rsc.org/images/entities/char_e001.gif) O and O–C
O and O–C![[double bond, length as m-dash]](https://www.rsc.org/images/entities/char_e001.gif) O groups. By comparison of Fig. 3g–i, the intensity of C
O groups. By comparison of Fig. 3g–i, the intensity of C![[double bond, length as m-dash]](https://www.rsc.org/images/entities/char_e001.gif) O group drastically decreased with the calcination temperature, which illustrates a reduction in O-functionalities. The XPS results of N content were exhibited in Table 1. For NPC-800
O group drastically decreased with the calcination temperature, which illustrates a reduction in O-functionalities. The XPS results of N content were exhibited in Table 1. For NPC-800![[thin space (1/6-em)]](https://www.rsc.org/images/entities/char_2009.gif) 900 and 1000, the N content is 1.96, 3.13 and 2.6 at%, respectively. The NPC-800 shows a low N content because of extremely high O proportion (up to 20.68 at%). As demonstrated in the literature, the N and O doping can effectively improve the pseudocapacitance and wettability of carbon electrode materials in the aqueous electrolyte.22,42,43
900 and 1000, the N content is 1.96, 3.13 and 2.6 at%, respectively. The NPC-800 shows a low N content because of extremely high O proportion (up to 20.68 at%). As demonstrated in the literature, the N and O doping can effectively improve the pseudocapacitance and wettability of carbon electrode materials in the aqueous electrolyte.22,42,43
| Sample | SBET (m2 g−1) | Vpore (cm3 g−1) | Ultimate analysis | XPS | Cspe (F g−1) | ||||
|---|---|---|---|---|---|---|---|---|---|
| Cwt% | Nwt% | Hwt% | Cat% | Nat% | Oat% | ||||
| NPC-800 | 589 | 0.32 | 80.95 | 1.04 | 0.915 | 77.36 | 1.96 | 20.68 | 195 |
| NPC-900 | 1234 | 0.59 | 82.72 | 1.13 | 0.654 | 80.78 | 3.13 | 16.09 | 213 |
| NPC-1000 | 1209 | 0.57 | 86.41 | 0.96 | 0.303 | 87.01 | 2.6 | 10.4 | 175 |
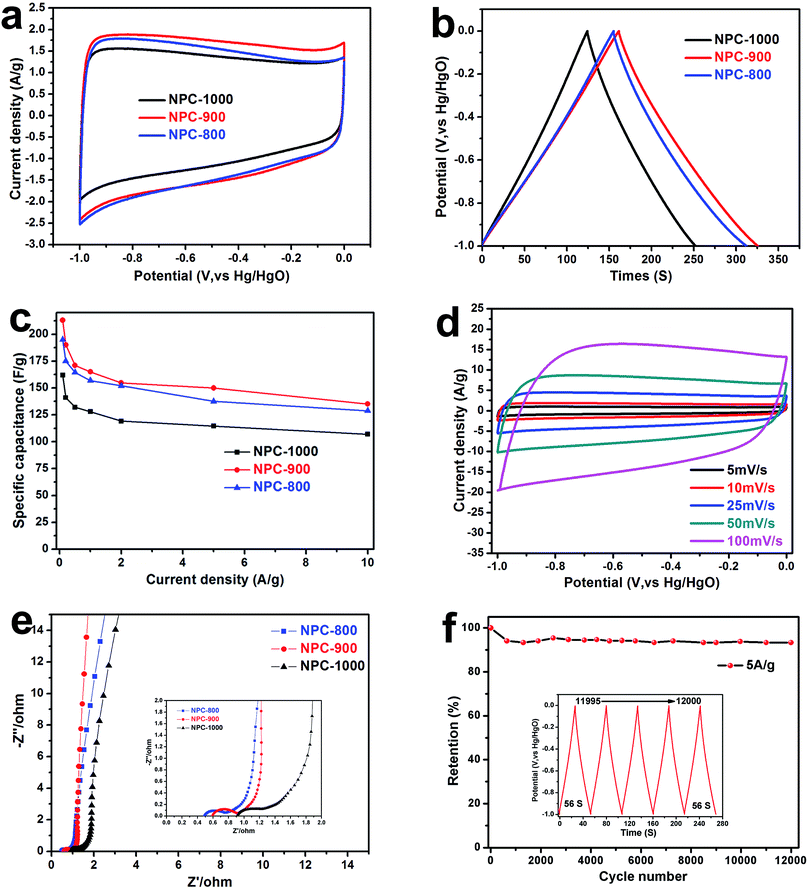
The N,O-functionalities and hierarchical nanoporous structure of NPC are beneficial for supercapacitors applications as well. Fig. 4 shows the electrochemical performance of NPC carbons calcined at different temperatures in a three-electrode supercapacitor setup tested in 6 M KOH electrolyte. The CV curve of NPC-800, NPC-900 and NPC-1000 at a scan rate of 10 mV s−1 was showed in Fig. 4a. The NPC-900 obtained the biggest CV area in all samples, indicating that NPC-900 could make a better performance than the others in supercapacitors. Fig. 4b shows the GCD curves of NPC materials with different carbonization temperature electrodes at a current density of 1 A g−1. The NPC-900 shows the longest charge–discharge time than others, demonstrating the higher capacitance and has been fully tallies with the above CV results. The gravimetric capacitances of the NPC-800, NPC-900 and NPC-1000 samples were calculated at various current densities ranging from 0.1 to 10 A g−1 (Fig. 4c), resulting in a value as high as 213 F g−1 of NPC-900, at a current density of 0.1 A g−1. Moreover, the high specific capacitance of the NPC-900 can be still obtained at a much higher current density (135 F g−1 at 10 A g−1). The CV curves of NPC-900 at a scan rate ranging from 5 to 100 mV s−1 are exhibited in Fig. 4d. The rectangular shape maintained at a high scan rate of 100 mV s−1 reveals the quick charge transfer of the EDLC, fully exhibiting capacitive performance of NPC-900. The IR drops curve of NPC-900 is showed in Fig. S4.† The small IR drops (0.0778 V) even at a high current density of 10 A g−1 demonstrates that the NPC-900 electrode has excellent reversibility and small internal resistance. Fig. 4e shows the Nyquist plots of NPC-800, 900 and 1000 electrode-based supercapacitors in the frequency ranging from 10 kHz to 10 mHz. The Nyquist plot expanded in the high frequency region is presented in the inset. The semicircle diameter of NPC-800, NPC-900 and NPC-1000 was 0.3, 0.32 and 0.4 Ω, respectively, illustrating the good conductivity of the materials. Moreover, and the short Warburg-type lines (in the low frequency) indicate the low resistance of ion transportation and high ion diffusion efficiency for NPC, especially for NPC-900. As shown in Fig. 4f, NPC-900 shows an excellent cycle life with less than 6.6% capacitance loss after 12![[thin space (1/6-em)]](https://www.rsc.org/images/entities/char_2009.gif) 000 cycles (140 F g−1 at 5 A g−1). Fig. S5† shows the electrochemical performance of NPC-900 when the loading mass is 8 mg cm−2. The CV curves (Fig. S5a†) and GCD curves (Fig. S5b†) show an excellently reversible and high capacitance in discharge–charge process, respectively. Fig. S5c† shows a specific capacitance with different loading mass in NPC-900 electrode. Even at high loading mass is 8 mg cm−2 in an electrode, the NPC-900 still obtaining high capacitance (196 F g−1). Moreover, a small resistance (Fig. S5d†) at high loading mass are also proved the excellent electrochemical performance of NPC-900.
000 cycles (140 F g−1 at 5 A g−1). Fig. S5† shows the electrochemical performance of NPC-900 when the loading mass is 8 mg cm−2. The CV curves (Fig. S5a†) and GCD curves (Fig. S5b†) show an excellently reversible and high capacitance in discharge–charge process, respectively. Fig. S5c† shows a specific capacitance with different loading mass in NPC-900 electrode. Even at high loading mass is 8 mg cm−2 in an electrode, the NPC-900 still obtaining high capacitance (196 F g−1). Moreover, a small resistance (Fig. S5d†) at high loading mass are also proved the excellent electrochemical performance of NPC-900.
In conclusion, the best performance was obtained when NPC-900 acts as electrode materials in supercapacitors. Compared to other NPC samples, the NPC-900 shows the biggest EDLC because of the highest SSA of NPC-900 (1234 m2 g−1) in all samples. However, NPC-1000 shows a low specific capacitance (162 F g−1 at 0.1 A g−1) at the high SSA (1209 m2 g−1). Thus, the SSA is not the only impact factor of capacitance. In comparison to NPC-800 capacitance, it could be found that N,O-functionalities of NPC is another impact factor of capacitance. NPC-800 shows up to 195 F g−1 specific capacitance at 0.1 A g−1 current density because of N,O-enriched. In the aqueous electrolyte, the introduction of N,O heteroatom not only improves the surface wettability of NPC electrode material, but also enlarges the whole capacitance due to the existence of pseudocapacitance (N-doped).10,15 With the calcination temperature increasing, the N,O-functional group content decreased. When calcination temperature increasing up to 900 °C, a high SSA and reasonable amount of N,O-doping were created, which contributed to the high specific capacitance. Due to the extremely high calcination temperature (1000 °C) of NPC materials, the content of N,O-functional group drastically decreases (N: from 3.13 to 2.6; O: from 16.9 to 10.4) as well as pore structure collapses resulting in low capacitance. However, due to the over low SSA (only 589 m2 g−1) for NPC-800 with good conductivity, NPC-800 hardly obtain the better performance than NPC-900 (1234 m2 g−1). All of the above studies show that the high capacitance of NPC-900 exhibits the best results that could be due to the synergy work of high SSA, functionalized heteroatoms and conductivity.
Next, the best performance sample (NPC-900) has also been investigated in symmetric supercapacitor with identical amount of active materials on both electrodes. The electrochemical performances of NPC-900 were evaluated as shown in Fig. 5.
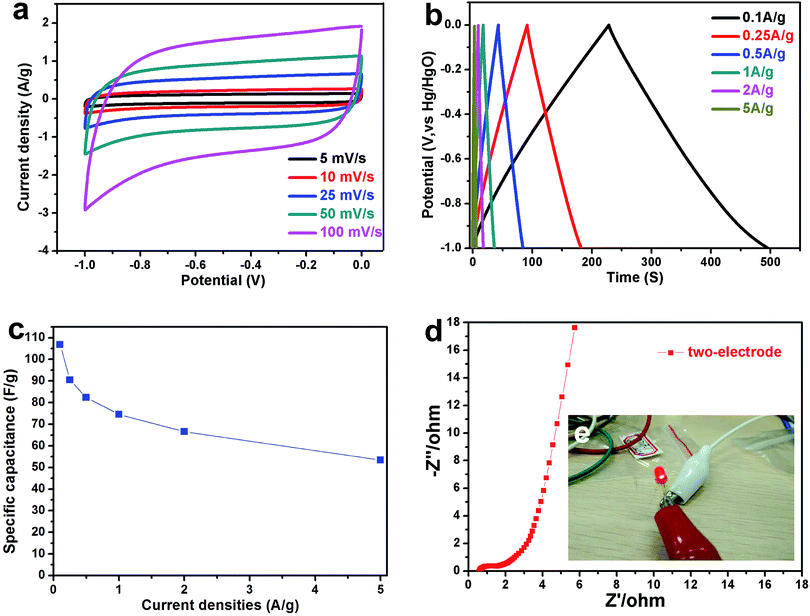
Fig. 5a shows the CV curves of NPC-900 using a two-electrode cell. As shown in Fig. 5a, the device exhibits a rectangular CV shape at all scan rates with rapid current responses upon voltage reversal (from 5 mV s−1 to 100 mV s−1). The linear GCD curves at all current densities demonstrated the high-rate responses of the device.27 The obtained specific capacitances of the device are 107, 90, 82, 74, 67, and 53 F g−1 at the current densities of 0.1, 0.25, 0.5, 1, 2, and 5 A g−1, respectively (Fig. 5c). Moreover, the excellent conductivity was further proved by EIS as shown in Fig. 5d (the semicircle diameter was about 1.1 Ω). An energy storage device with two supercapacitors connected in series was fabricated. Such a simple energy storage device could power a commercial red light-emitting diode (LED) as shown in Fig. 5e.
Thus, it has proved the potential commercial value of NPC materials in energy storage. Compared to the previous reported carbon materials from biomass resource (Table 2), NPC obtained in this study shows good performance. Moreover, this facile approach may open a door for preparation of high surface area porous carbons for energy storage.
| Materials | Activation agent | SBET (m2 g−1) | Test system | Electrolyte | Current density/scan voltage | Cspe (F g−1) | Ref. |
|---|---|---|---|---|---|---|---|
| Wood | CO2 | — | 3E | 1 M Na2SO4 | 1 m A cm−2 | 118.7 | 44 |
| Cotton | NaOH/urea | 584.49 | 3E | 3 M KOH | 0.3 A g−1 | 221.7 | 34 |
| Lignocelluloses | H3PO4 | 1135 | 3E | 1 M H2SO4 | 0.05 A g−1 | 176 | 45 |
| Fungi | Hydrothermal | 80 | 3E | 6 M KOH | 5 mV s−1 | 196 | 46 |
| Cassava peel waste | KOH + CO2 | 1352 | 3E | 0.5 M H2SO4 | 10 A g−1 | 153 | 47 |
| Water hyacinth | KOH | 1010 | 3E | 30 wt% KOH | — | 179.6 | 48 |
| Cow dung | KOH | 2000 | 2E | Et4NBF4 | 1 A g−1 | 117 | 49 |
| Firewood | Na2CO3 K2CO3 | 818 | 3E | 1 M H2SO4 | 0.2 A g−1 | 189 | 50 |
| Boiled coffee beans | CaCl2 | 550 | 2E | 1 M MeEt3NBF4 | 0.4 | 93.4 | 51 |
| Rootof multibract raspberry | Self-activation | 1234 | 3E | 6 M KOH | 0.1 A g−1 | 213 | Our work |
| 2E | 6 M KOH | 0.1 A g−1 | 107 |
4. Conclusion
In summary, we report a facile synthesis of 3D sheet nanoporous carbon materials from plant, using trunk inner substance of ROMR as the precursor. These nanoporous carbon materials show high SSA (1234 m2 g−1) and large pore volume (0.59 cm3 g−1) without the need of complicated processes (e.g. activation, pre-treatment), except for calcination at 900 °C for 2 h. Moreover, these materials exhibited high specific capacitance (up to 213 F g−1 at 0.1 A g−1) and stable cycle performance (6.6% loss over 12![[thin space (1/6-em)]](https://www.rsc.org/images/entities/char_2009.gif) 000 cycles) in three-electrode configuration. The high electrochemical performance was obtained due to the coherent work of high SSA and functionalized heteroatoms. Furthermore, the high capacitance (107 F g−1 at 0.1 A g−1) could also be obtained in a supercapacitor device, which further illustrated the fact that the nanoporous carbon materials, obtained with high yield, environmental friendliness, low-cost and being readily available, are appropriate for being used in energy storage devices.
000 cycles) in three-electrode configuration. The high electrochemical performance was obtained due to the coherent work of high SSA and functionalized heteroatoms. Furthermore, the high capacitance (107 F g−1 at 0.1 A g−1) could also be obtained in a supercapacitor device, which further illustrated the fact that the nanoporous carbon materials, obtained with high yield, environmental friendliness, low-cost and being readily available, are appropriate for being used in energy storage devices.
Conflicts of interest
There are no conflicts to declare.Acknowledgements
This work was financially supported by the National Natural Science Foundation of China (No. 51202150, 51272161, 21703141), Program of Introducing Innovative Research Team in Dongguan (No. 2014607109), Foundation of the State Key Laboratory of Solidification Processing in NWPU (SKLSP201110), Shenzhen Basic Research Program (No. JCYJ20160422091418366) and Foundation of Shenzhen University Innovation and Development (PIDFP-ZR2017022).References
- A. Manthiram, S. H. Chung and C. Zu, Adv. Mater., 2015, 27, 1980–2006 CrossRef CAS PubMed.
- P. Simon, Y. Gogotsi and B. Dunn, Science, 2014, 343, 1210–1211 CrossRef CAS PubMed.
- Y. Zeng, M. Yu, Y. Meng, P. Fang, X. Lu and Y. Tong, Adv. Energy Mater., 2016, 1601053, DOI:10.1002/aenm.201601053.
- C. Ruan, K. Ai and L. Lu, RSC Adv., 2014, 4, 30887 RSC.
- M. Rose, Small, 2011, 7, 1108–1117 CrossRef CAS PubMed.
- W. Li, J. Liu and D. Zhao, Nat. Rev. Mater., 2016, 1, 16023 CrossRef CAS.
- D. Wang, G. Fang, G. Geng and J. Ma, Mater. Lett., 2017, 189, 50–53 CrossRef CAS.
- Y. Huang, J. Liang and Y. Chen, Small, 2012, 8, 1805–1834 CrossRef CAS PubMed.
- L. Wang, Y. Zhang, J. Yu, J. He, H. Yang, Y. Ye and Y. Song, Sens. Actuators, B, 2017, 239, 172–179 CrossRef CAS.
- Y. Zhu, S. Murali, M. D. Stoller, K. J. Ganesh, W. Cai, P. J. Ferreira, A. Pirkle, R. M. Wallace, K. A. Cychosz, M. Thommes, D. Su, E. A. Stach and R. S. Ruoff, Science, 2011, 332, 1537–1541 CrossRef CAS PubMed.
- Z. Wang, D. Luan, S. Madhavi, Y. Hu and X. W. Lou, Energy Environ. Sci., 2012, 5, 5252–5256 CAS.
- Y.-W. Ju, G.-R. Choi, H.-R. Jung and W.-J. Lee, Electrochim. Acta, 2008, 53, 5796–5803 CrossRef CAS.
- B.-H. Kim, K. S. Yang, H.-G. Woo and K. Oshida, Synth. Met., 2011, 161, 1211–1216 CrossRef CAS.
- Z. Zhou, X.-F. Wu and H. Hou, RSC Adv., 2014, 4, 23622 RSC.
- Y. Yao, H. Wu, L. Huang, X. Li, L. Yu, S. Zeng, X. Zeng, J. Yang and J. Zou, Electrochim. Acta, 2017, 246, 606–614 CrossRef CAS.
- A. G. Pandolfo and A. F. Hollenkamp, J. Power Sources, 2006, 157, 11–27 CrossRef CAS.
- J. R. Miller and P. Simon, Science, 2008, 321, 651 CrossRef CAS PubMed.
- P. Simon and Y. Gogotsi, Nat. Mater., 2008, 7, 845–854 CrossRef CAS PubMed.
- Z. Zhou and X.-F. Wu, J. Power Sources, 2013, 222, 410–416 CrossRef CAS.
- H. Yoo, H. D. Mai and K. Rafiq, Chemistry, 2016, 23, 5631–5651 Search PubMed.
- H. B. Aiyappa, P. Pachfule, R. Banerjee and S. Kurungot, Cryst. Growth Des., 2013, 13, 4195–4199 CAS.
- M. Zhou, F. Pu, Z. Wang and S. Guan, Carbon, 2014, 68, 185–194 CrossRef CAS.
- S.-H. Yoon, S. Lim, Y. Song, Y. Ota, W. Qiao, A. Tanaka and I. Mochida, Carbon, 2004, 42, 1723–1729 CrossRef CAS.
- E. Raymundo-Piñero, D. Cazorla-Amorós, A. Linares-Solano, J. Find, U. Wild and R. Schlögl, Carbon, 2002, 40, 597–608 CrossRef.
- D. Wang, G. Fang, T. Xue, J. Ma and G. Geng, J. Power Sources, 2016, 307, 401–409 CrossRef CAS.
- D. Wang, S. Liu, L. Jiao, G. Fang, G. Geng and J. Ma, Carbon, 2017, 119, 30–39 CrossRef CAS.
- L. Fan, L. Yang, X. Ni, J. Han, R. Guo and C. Zhang, Carbon, 2016, 107, 629–637 CrossRef CAS.
- H. Wang, Z. Xu, A. Kohandehghan, Z. Li, K. Cui, X. Tan, T. J. Stephenson, C. K. King'Ondu, C. M. Holt and B. C. Olsen, ACS Nano, 2013, 7, 5131–5141 CrossRef CAS PubMed.
- Z. Li, Z. W. Xu, X. H. Tan, H. L. Wang, C. M. B. Holt, T. Stephenson, B. C. Olsen and D. Mitlin, Energy Environ. Sci., 2013, 6, 871–878 CAS.
- M. Wahid, G. Parte and S. Ogale, J. Mater. Chem. A, 2014, 3, 1208–1215 Search PubMed.
- L. Zhang, F. Zhang, X. Yang, K. Leng, Y. Huang and Y. Chen, Small, 2013, 9, 1342–1347 CrossRef CAS PubMed.
- D. Wang, S. Liu, G. Fang, G. Geng and J. Ma, Electrochim. Acta, 2016, 216, 405–411 CrossRef CAS.
- B. Duan, X. Gao, X. Yao, Y. Fang, L. Huang, J. Zhou and L. Zhang, Nano Energy, 2016, 27, 482–491 CrossRef CAS.
- Y. Liu, Z. Shi, Y. Gao, W. An, Z. Cao and J. Liu, ACS Appl. Mater. Interfaces, 2016, 8, 28283–28290 CAS.
- X. Liu, N. Fechler and M. Antonietti, Chem. Soc. Rev., 2013, 42, 8237 RSC.
- X. Liu and A. Markus, Adv. Mater., 2013, 25, 6284–6290 CrossRef CAS PubMed.
- Y. Wang, J. Yang, R. Du and L. Chen, ACS Appl. Mater. Interfaces, 2017, 9, 23731–23740 CAS.
- R. Qiang, Y. Du, Y. Wang, N. Wang, C. Tian, J. Ma, P. Xu and X. Han, Carbon, 2016, 98, 599–606 CrossRef CAS.
- C. Chen, D. F. Yu, G. Y. Zhao, B. S. Du, W. Tang, L. Sun, Y. Sun, F. Besenbacher and M. Yu, Nano Energy, 2016, 27, 377–389 CrossRef CAS.
- L. Henrard, Phys. Rep., 2005, 409, 47–99 CrossRef.
- Y. X. Wang, J. Yang, W. Lai, S. L. Chou, Q. F. Gu, H. K. Liu, D. Zhao and S. X. Dou, J. Am. Chem. Soc., 2016, 138, 16576–16579 CrossRef CAS PubMed.
- L. Hao, X. Li and L. Zhi, Adv. Mater., 2013, 25, 3899–3904 CrossRef CAS PubMed.
- Z. Wen, X. Wang, S. Mao, Z. Bo, H. Kim, S. Cui, G. Lu, X. Feng and J. Chen, Adv. Mater., 2012, 24, 5610 CrossRef CAS PubMed.
- C. Chen, Y. Zhang, Y. Li, J. Dai, J. Song, Y. Yao, Y. Gong, I. Kierzewski, J. Xie and L. Hu, Energy Environ. Sci., 2017, 10, 538–545 CAS.
- C. Huang, A. M. Puziy, T. Sun, O. I. Poddubnaya, F. Suárez-García, J. M. D. Tascón and D. Hulicova-Jurcakova, Electrochim. Acta, 2014, 137, 219–227 CrossRef CAS.
- H. Zhu, X. Wang, F. Yang and X. Yang, Adv. Mater., 2011, 23, 2745–2748 CrossRef CAS PubMed.
- A. E. Ismanto, S. Wang, F. E. Soetaredjo and S. Ismadji, Bioresour. Technol., 2010, 101, 3534–3540 CrossRef CAS PubMed.
- F. Kurniawan, M. Wongso, A. Ayucitra, F. E. Soetaredjo, A. E. Angkawijaya, Y. H. Ju and S. Ismadji, J. Taiwan Inst. Chem. Eng., 2015, 47, 197–201 CrossRef CAS.
- D. Bhattacharjya and J. S. Yu, J. Power Sources, 2014, 262, 224–231 CrossRef CAS.
- D. Wang, W. Xiao, L. Hu, B. Lu and H. Yin, RSC Adv., 2016, 6, 106485–106490 RSC.
- B. Lu, J. Zhou, Y. Song, H. Wang, W. Xiao and D. Wang, Faraday Discuss., 2016, 190, 147 RSC.
Footnote |
| † Electronic supplementary information (ESI) available. See DOI: 10.1039/c7ra12525a |
| This journal is © The Royal Society of Chemistry 2018 |

