 Open Access Article
Luminescent biomimetic citrate-coated europium-doped carbonated apatite nanoparticles for use in bioimaging: physico-chemistry and cytocompatibility†
Jaime Gómez-Morales *a,
Cristóbal Verdugo-Escamilla
 a,
Raquel Fernández-Penasa,
Carmen María Parra-Millaa,
Christophe Drouet
 b,
Françoise Maube-Boscb,
Francesca Oltolinac,
Maria Prat
 c and
Jorge Fernando Fernández-Sánchez
 d
d
aLaboratorio de Estudios Cristalográficos, IACT (CSIC-UGR), Avda. Las Palmeras, No. 4. E-18100 Armilla, Granada, Spain. E-mail: jaime@lec.csic.es
bCIRIMAT, Université de Toulouse, UMR CNRS/INPT/UPS 5085, Ensiacet, 4 Allée Emile Monso, 31030 Toulouse Cedex 4, France
cDipartimento di Scienze della Salute, Università del Piemonte Orientale A. Avogadro, Via Solaroli, 17, 28100 Novara, Italy
dDepartment of Analytical Chemistry, Faculty of Sciences, University of Granada, Avda. Fuentenueva s/n, 18071 Granada, Spain
First published on 10th January 2018
Abstract
Nanomedicine covers the application of nanotechnologies in medicine. Of particular interest is the setup of highly-cytocompatible nanoparticles for use as drug carriers and/or for medical imaging. In this context, luminescent nanoparticles are appealing nanodevices with great potential for imaging of tumor or other targetable cells, and several strategies are under investigation. Biomimetic apatite nanoparticles represent candidates of choice in nanomedicine due to their high intrinsic biocompatibility and to the highly accommodative properties of the apatite structure, allowing many ionic substitutions. In this work, the preparation of biomimetic (bone-like) citrate-coated carbonated apatite nanoparticles doped with europium ions is explored using the citrate-based thermal decomplexing approach. The technique allows the preparation of the single apatitic phase with nanosized dimensions only at Eu3+ doping concentrations ≤0.01 M at some timepoints. The presence of the citrate coating on the particle surface (as found in bone nanoapatites) and Eu3+ substituting Ca2+ is beneficial for the preparation of stable suspensions at physiological pH, as witnessed by the ζ-potential versus pH characterizations. The sensitized luminescence features of the solid particles, as a function of the Eu3+ doping concentrations and the maturation times, have been thoroughly investigated, while those of particles in suspensions have been investigated at different pHs, ionic strengths and temperatures. Their cytocompatibility is illustrated in vitro on two selected cell types, the GTL-16 human carcinoma cells and the m17.ASC murine mesenchymal stem cells. This contribution shows the potentiality of the thermal decomplexing method for the setup of luminescent biomimetic apatite nanoprobes with controlled features for use in bioimaging.
1 Introduction
Luminescent nanoparticles are excellent candidates for the setup of optical probes for use in medical and biological imaging. Their function is to provide the necessary fluorescence contrast required to visualize specific cellular components and tissues.1 Several luminescent materials including quantum dots,2 nanodiamonds,3 gold nanoparticles,4 nanostructures labeled with organic dyes,5 nanoapatites labeled with organic dyes and monoclonal antibodies6 and rare earth-doped apatite nanomaterials7,8 have been proposed as fluorophores for bioimaging and biosensing applications. Among them, lanthanide-doped apatite nanoparticles have recently emerged as a new class of bioprobes exhibiting long fluorescence lifetime (sensitized fluorescence), high quantum yield, sharp emission peaks, color tuning depending on the lanthanide ion doped and good resistance to photo-bleaching from environmental conditions.7,9 As a host material, apatite provides a flexible crystal lattice to fix the dopant ion, whereas lanthanides offer the detectable and stable fluorescence signal. Compared to traditional fluorescence labeling procedures based on organic dyes or fluorescent proteins, which are prone to problems such as short luminescence lifetime, broad spectrum profiles, poor photochemical stability, and potential toxicity to cells,5 or to quantum dots, which are cytotoxic and show photoblinking,2,10 the special features of lanthanide-doped apatite nanoparticles makes them excellent candidates as bioprobes in medical diagnostics and targeted therapeutics applications.11,12In addition to be a very accommodative matrix for lanthanide ions, apatites also exhibit excellent properties such as biocompatibility, bioactivity, biodegradability, and lack of toxicity or inflammatory and immune responses.13,15 Moreover, they show good stability at physiological conditions of pH and temperature; high loading capacity of biomolecules and drugs, and ability to release the drugs in response to local stimuli such as acidic pHs, as those found at tumor sites or within lysosomes, due to apatite progressive solubility in acidic conditions. All these properties have been extensively exploited for hard tissue repair and replacement, DNA loading, drug delivery, passive and active targeting treatments of tumor cells, etc.13–18
The above properties can be enhanced by improving the biomimetism of nanocrystalline apatites,19 that is, by preparing them with similar dimensions, morphology, (nano)structural and chemical characteristics of the natural biological ones. Among different synthetic routes to prepare biomimetic apatites,13,20 we have proposed the thermal decomplexing of Ca/citrate/phosphate/carbonate solutions21–25 which is a low cost, eco-friendly and easily scalable method yielding highly monodisperse plate-shaped citrate-functionalized carbonate-apatite nanoparticles with mean lengths ranging from 20 to 100 nm and tailored carbonate content. The amount of citrate found adsorbed on the nanoparticles is very similar to that measured in bone carbonate apatite by Hu et al.26 Citrate ions can modulate the physico-chemical characteristics of apatite nanocrystals; they favor in particular their flat morphology, contribute to controlling the thickness of precipitated apatite nanocrystals24 and affect their interfacial properties by decreasing the surface hydrophilicity.27 Although recent results indicated that no organic template was strictly necessary to obtain bone-like carbonated apatite crystals,28 the precipitation of carbonated apatite in the presence of citrate has attracted attention in modelling of bone mineralization since these small organic molecules are present in vivo forming a coating on the bone nanoapatites surface.26 In this context, the thermal decomplexing method based on Ca/citrate/phosphate/carbonate solutions has been proposed as an alternative route to obtain biomimetic apatites both undoped and doped with metallic ions.29
The aim of the present contribution was to investigate, in detail and for the first time, the possibility to obtain, in a controlled way, luminescent biomimetic and highly-biocompatible Eu-doped apatite nanoparticles via the thermal decomplexing method, and to explore their physico-chemical and cytocompatibility properties. It was reported that apatites prepared in the presence of citrate by a hydrothermal method exhibited a strong blue luminescence under UV lamp, mainly due to the presence of adsorbed citrate.30 To explore the luminescence properties due to europium in this work we have measured the sensitized fluorescence of Eu(III). This condition reduced/eliminated the fluorescence background due to citrate.
In a first stage, Eu-doped citrate-coated carbonated apatite (Eu-doped cit-cAp) precipitates was generated by thermal decomplexing of Eu3+/Ca2+/citrate/phosphate/carbonate solutions, and thoroughly characterized using a large set of complementary techniques. Special attention was paid to conditions allowing the obtainment of biomimetic features. The luminescence properties of produced particles were then explored by measuring the sensitized fluorescence. Finally, the cytocompatibility of such particles was investigated via in vitro cell tests.
2 Materials and methods
2.1 Reagents
Europium chloride hexahydrate (EuCl3·6H2O, ACS reagent, 99.9% pure), calcium chloride dihydrate (CaCl2·2H2O, Bioxtra, 99.0% pure), sodium citrate tribasic dihydrate (Na3(cit)·2H2O, with cit = citrate = C6H5O7, ACS reagent, ≥99.0% pure), disodium hydrogenphosphate (Na2HPO4, ACS reagent, ≥99.0% pure), sodium carbonate monohydrate (Na2CO3·H2O, ACS reagent, 99.5% pure) and hydrochloric acid (HCl, ACS reagent, 37 wt% in H2O) were provided by Sigma-Aldrich. All solutions were prepared with ultrapure water (0.22 μS, 25 °C, Milli-Q, Millipore).2.2 Precipitation method
The experiments were carried out by thermal treatment of metastable solutions containing Eu3+/Ca2+–citrate complexes in the presence of phosphate and carbonate ions, at pH = 8.5. Powders were synthesized as follows: 50 mL of a solution (a) of composition 0.06 M Na2HPO4 + 0.1 M Na2CO3 was poured into 50 mL of a solution (b) of composition 2xEuCl3 + 2yCaCl2 + 0.2 M Na3(cit), with x = 0.001, 0.005, 0.01, 0.02 and 0.03 M and y = 0.1 − x M, at 4 °C. Then, the pH was adjusted to 8.5 with diluted HCl. The undoped sample (cit-cAp) was obtained using a 0.10 M CaCl2 europium-free solution in the aforementioned procedure. The mixed solution was introduced into a 200 mL bottle made of glass Pyrex®, sealed with a screw cap, immediately submerged in a water bath at 80 °C and then put in an oven with circulated forced air at the same temperature. The experiments lasted between 1 and 96 hours, except at some Eu3+ concentrations for which longer maturation times were used (mentioned in the text). Upon completion, the precipitates were subjected to 6 consecutive cycles of washing by centrifugation with ultrapure water to remove unreacted species or salts such as NaCl. Afterwards they were freeze-dried overnight at −50 °C under vacuum (3 mbar). The theoretical reaction yielding Eu-doped carbonated apatites can be represented by eqn (1):| (5 − x)[Ca(cit)]− + x[Eu(cit)]0 + 3HPO42− + 5/3CO32− + OH− → Ca5−xEux(PO4)3−z(CO3)z(OH)1−z(CO3)z + 5cit3− + 3H+ + nCO32− with z = 5/3 − n | (1) |
2.3 Particle characterization
Different techniques were used for the characterization of the precipitates including X-ray diffraction (XRD), FTIR spectroscopy, atomic absorption spectroscopy (AAS), visible spectrophotometry, scanning and transmission electron microscopy (SEM and TEM) and energy dispersive X-ray spectroscopy (EDS) analysis. Selected samples were additionally analyzed by dynamic light scattering (DLS) and ξ-potential against pH.XRD data were collected by using a Bruker D8 Advance Vario diffractometer with a Bragg–Brentano parafocusing geometry and Cu Kα1 radiation (1.5406 Å). Data processing was conducted by using the software Diffract EVA from Bruker and Profex based on the Rietveld refinement kernel BGMN.31 The approach used by this software to determine the anisotropic size broadening contribution was used to determine the crystallite size. The instrumental contribution to the peak width was taken into account and calculated from the LaB6 standard supplied by NIST (SRM 660c).
SEM observations and EDS were performed with both a field emission high resolution microscope FEG-ESEM QUEMSCAN 650F equipped with Dual EDS XFlash from Bruker with a XFlash 6/30 X-ray detector, and a variable pressure Zeiss SUPRA40VP scanning electron microscope (VPSEM). This instrument is provided of a large X-Max 50 mm area detector for energy dispersive X-ray spectroscopy (EDS) microanalysis. The powder samples were ultrasonically dispersed in deionized water and then a few droplets of the slurry were deposited on conventional supports, then dried and carbon-sputtered, prior observation. Eu, P and Ca were determined averaging 7–10 measurements in different Eu-apatite particles of each sample.
Transmission electron microscopy (TEM) observations were performed with a Carl Zeiss Libra 120 microscope operating at 80 kV. The powder samples were ultrasonically dispersed in ethanol (absolute, ≥99.8%), and then a few droplets of the slurry were deposited on formvar coated copper microgrids prior to observation.
Fourier transform infrared spectra were initially recorded with a JASCO 6200 FTIR spectrometer equipped with an attenuated total reflectance (ATR) accessory of diamond crystal. For more advanced IR investigations, transmission FTIR spectra were recorded on selected samples using a Perkin-Elmer Spectrum One FTIR spectrometer. The pellets were prepared by mixing ∼1 mg of sample with ∼100 mg of anhydrous KBr and then pressed with a hydraulic pump at 10t into 13 mm diameter discs. Pure KBr pellets were used to record the background. FTIR spectra in transmittance mode were recorded within the wavenumber range from 4000 cm−1 to 400 cm−1 at a resolution of 4 cm−1.
Calcium and europium contents were measured by AAS using atomic absorption bands located at 422.7 and 459.4 nm respectively for calcium and europium. AAS spectra were obtained on a ContrAA 300 High-Resolution Continuum Source Atomic Absorption Spectrometer from Analytik Jena AG, operated in a nitrous oxide-acetylene flame, in acidic conditions via addition of perchloric acid HCLO4 6 M down to pH close to 2 and in the presence of cesium chloride (starting reagent: CsCl 1%). Phosphate titrations were carried out by visible spectrophotometry using the vanado–molybdeno–phosphate yellow complex whose absorbance at 460 nm is directly related to the phosphate concentration in solution.
The analysis of the particle size distribution and electrophoretic mobility (ζ-potential) of samples were performed using a Zetasizer Nano ZS analyzer provided of a 633 nm laser (Malvern, UK) using disposable polystyrene cuvettes containing the particles suspended in deionized water (0.5 mg mL−1) at 25 °C. For the measurements of the ζ-potential versus pH, the MPT-2 autotitrator (Malvern, UK) connected to the analyzer was employed. Diluted HCl and NaOH solutions (0.25 and 0.1 M, respectively) were used as titration agents. No additional electrolytes were added.
2.4 Luminescence spectroscopy
The luminesce properties (excitation and emission spectra and lifetime) of solid europium-doped particles and their aqueous suspensions (∼0.5 mg mL−1) were recorded using a Cary Eclipse Varian Fluorescence Spectrophotometer (Varian Australia, Mulgrave, Australia). A front surface accessory was used to obtain the luminescence spectra, the luminescence lifetime and the relative luminescence intensities of the powders and a commercial Peltier cell holder connected to a temperature control module (Agilent Technologies, Madrid, Spain) was used to obtain the luminescence spectra and the relative luminescence intensities (R.L.I.) of the liquid suspensions. The instrumental parameters for characterizing the solid particles in powder were: λexc = 394 nm, λem = 614 nm, slit-widthsexc/em = 5/5 nm, delay time (td) = 0.120 μs, gate time (tg) = 5 ms and detector voltage = 500 V. The instrumental parameter for the characterization of the particles in aqueous suspensions were: λexc = 232 nm, λem = 616 nm, slit-widthsexc/em = 10/10 nm, delay time (td) = 0.120 μs, gate time (tg) = 5 ms and detector voltage = 600 V. Luminescence lifetimes (τ) were measured in solid samples prepared at the higher maturation times using the following conditions: λexc/em = 229/614 or 240/614 nm, slit-widthsexc/em = 5/5 nm, td = 0.1 μs, tg = 0.1 ms and detector voltage = 550 V. The effect of several chemical conditions over the luminescence properties of the aqueous suspensions prepared from powders of the higher maturation times were also evaluated: concentration of nanoparticles in suspension (0–100 mM), temperature (25 °C, 37 °C), pH (5.0–7.5) and ionic strength (0–100 mM NaCl).2.5 Cytotoxicity tests
GTL-16 (a human gastric carcinoma cell line, obtained after cloning the MNK45 cell line, and at its passage 7032,33, at Dept of Health Sciences, Università del Piemonte Orientale, 28100 Novara) and m17.ASC (a spontaneously immortalized mouse mesenchymal stem cell clone from subcutaneous adipose tissue, obtained in the same labs, at its passage 7834) cells (12![[thin space (1/6-em)]](https://www.rsc.org/images/entities/char_2009.gif) 000 and 5000 cells per well in 96-well plates, respectively) were incubated for 24 hours and then different concentrations of the differentially doped (x = 0.001, 0.005, 0.010, 0.020 and 0.030 M Eu3+) particles, ranging from 0.1 to 100 μg mL−1, were added in 100 μL of fresh medium. After 72 hours incubation, cell viability was evaluated by the (3-(4,5-dimethylthiazol-2-yl)-2,5-diphenyltetrazolium bromide) (MTT, Sigma) colorimetric assay. Briefly, 20 μL of MTT solution (5 mg mL−1 in a PBS solution) were added to each well. The plate was then incubated at 37 °C for 3 hours. After the removal of the solution, 125 μL of 0.2 M HCl in isopropanol were added to dissolve formazan crystals. 100 μL were then removed carefully and the optical density was measured in a multiwell reader (2030 Multilabel Reader Victor TM X4, PerkinElmer) at 570 nm. Viability of parallel cultures of untreated cells was taken as 100% viability, and values obtained from cells undergoing the different treatments were referred to this value. Experiments were performed 4 times using 3 replicates for each sample.
000 and 5000 cells per well in 96-well plates, respectively) were incubated for 24 hours and then different concentrations of the differentially doped (x = 0.001, 0.005, 0.010, 0.020 and 0.030 M Eu3+) particles, ranging from 0.1 to 100 μg mL−1, were added in 100 μL of fresh medium. After 72 hours incubation, cell viability was evaluated by the (3-(4,5-dimethylthiazol-2-yl)-2,5-diphenyltetrazolium bromide) (MTT, Sigma) colorimetric assay. Briefly, 20 μL of MTT solution (5 mg mL−1 in a PBS solution) were added to each well. The plate was then incubated at 37 °C for 3 hours. After the removal of the solution, 125 μL of 0.2 M HCl in isopropanol were added to dissolve formazan crystals. 100 μL were then removed carefully and the optical density was measured in a multiwell reader (2030 Multilabel Reader Victor TM X4, PerkinElmer) at 570 nm. Viability of parallel cultures of untreated cells was taken as 100% viability, and values obtained from cells undergoing the different treatments were referred to this value. Experiments were performed 4 times using 3 replicates for each sample.
2.6 Statistical analysis
Data are expressed as mean ± standard deviation of at least three replicates. Statistical analyses were performed using a one-way ANOVA with Bonferroni's post test for grouped analyses using GraphPad Prism version 4.03 for Windows, GraphPad Software (GraphPad Prism, San Diego, CA). Differences at p < 0.05 were considered to be statistically significant.3 Results and discussion
3.1 Preliminary thermal decomplexing experiments and chemical titrations on precipitates
A series of synthesis experiments was first carried out by citrate-based thermal decomplexing for 96 h and using increasing europium concentrations in a wide range of values (x between 0 and 0.05 M) for a preliminary screening of precipitation conditions.Table 1 reports the Eu/(Ca + Eu) and the (Ca + Eu)/P molar ratios as drawn from atomic absorption (Ca and Eu) and spectrophotometry (P) analyses. These results point out the significant effect of europium on the precipitation events occurring during thermal decomplexation. While the nature of the precipitated phases will be investigated in the following sections, these data already show that europium has indeed been incorporated in all the precipitates, and in increasing amounts.
| Value of x (in M) | Eu/(Ca + Eu) | (Ca + Eu)/P |
|---|---|---|
| 0 | 0 | 1.60 |
| 0.02 | 0.22 | 1.44 |
| 0.03 | 0.33 | 1.24 |
| 0.04 | 0.40 | 1.17 |
| 0.05 | 0.53 | 1.09 |
3.2 X-ray diffraction patterns of precipitated solids
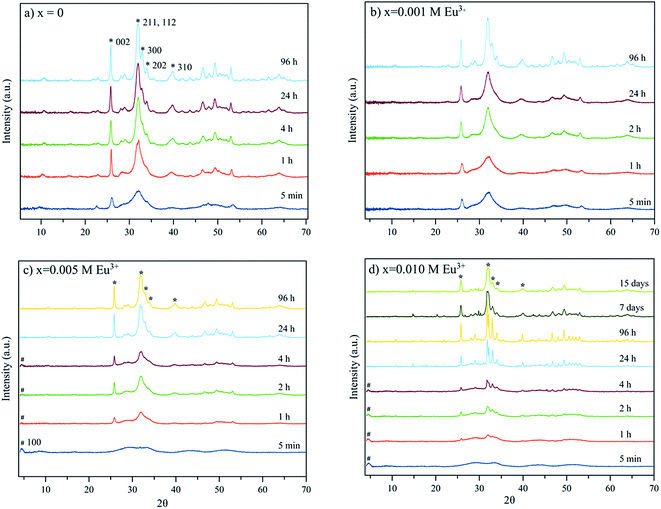
The XRD diagrams of the samples precipitated in the absence (x = 0) and presence of Eu3+ doping concentrations (x from 0.001 to 0.01 M) are reported on Fig. 1. They show rather similar evolutions with time, although increasing concentrations in europium leads to slowing of the precipitation process as witnessed by the broad peaks observed at the lowest timepoints for x = 0.005 and 0.01 M Eu3+. Early in time, however, all samples started to display the main distinguishing XRD reflections of an apatite phase (PDF 01-1008), for example with peaks at 2θ = 25.87° corresponding to the (002) plane, the triplet at 31.77°, 32.19° and 32.90° (planes (211), (112) and (300)) respectively, the reflections at 33.9° and 39.81° (planes (202) and (310)) and other minor peaks in the 2θ range from 40–55°.29The nanocrystalline character of the particles was assessed by applying the Rietveld method as implemented in Profex software (Table 2), giving an estimate of the mean length and width/depth of the apatite nanocrystals formed. Dimensional considerations will be discussed later, in the section dedicated to microscopy analyses. Due to the nanocrystalline character of the particles the reflections in the 2θ range 31–34° are seen as a broad peak. Only for maturation times longer than 4 hours the three peaks can be detected isolately. For x = 0.005 and 0.010 M Eu3+, the presence of octacalcium phosphate (OCP), small and wide reflection at 4.74°, plane (100), (OCP, PDF 44-0778) is also noted for maturation times from 5 min to 4 hours. This reflection is not observed in precipitates matured for more than 4 hours, which in turn show the main reflections of the apatite. The width of the reflection at 4.74° along with the bulging of the baseline in the interval 23–38° may be attributed to the nanocrystalline character of the precipitated calcium phosphate phase.
| [Eu3+]0, M (x) | Crystalline phasesa | Ca/P ratiob | wt% Eub | L (nm) | W (nm) | L (nm) (Rietveld) | W (nm) (Rietveld) |
|---|---|---|---|---|---|---|---|
| a Ap = apatitic phase; OCP = octacalcium phosphate.b Measured by EDS technique averaging the composition of 6–10 different zones of the Ap phase.c At this timepoint the europium phosphate phase started to appear.d Calculated crystallite dimensions greater than 100–150 nm have to be considered only as an estimated trend. They are accurate only for dimensions below these sizes, because for bigger sizes the difference between the instrumental FWHM contribution and the FWHM contribution due to the size is negligible. | |||||||
| 0.001 4 h | Ap | 1.59 ± 0.14 | 1.72 ± 0.31 | 23.5 ± 5.4 | 23.5 ± 5.4 | 25.4 ± 6.9 | 7.9 ± 0.9 |
| 0.001 24 h | Ap | 1.65 ± 0.24 | 1.56 ± 0.37 | 38.7 ± 5.8 | 18.7 ± 6.2 | 32.9 ± 8.3 | 11.2 ± 1.2 |
| 0.001 96 h | Ap | 1.63 ± 0.09 | 2.04 ± 0.27 | 39.2 ± 5.3 | 9.6 ± 1.4 | 35.1 ± 0.5 | 11.7 ± 0.1 |
| 0.005 4 h | Ap + OCP | 1.34 ± 0.42 | 14.6 ± 2.1 | 65.3 ± 9.3 | 65.3 ± 9.3 | 26 ± 0.9 | 5.1 ± 0.1 |
| 0.005 24 h | Ap | 1.53 ± 0.12 | 6.40 ± 0.48 | 170.4 ± 6.5 | 52.5 ± 6.4 | 41.2 ± 0.7 | 9.1 ± 0.1 |
| 0.005 96 h | Ap | 1.48 ± 0.18 | 5.25 ± 0.68 | 127 ± 27 | 17.9 ± 7.2 | 39.7 ± 0.7 | 9.3 ± 0.1 |
| 0.010 4 h | Ap + OCP | 1.08 ± 0.54 | 23.8 ± 5.7 | 526 ± 235 | 134.5 ± 40.7 | 54.7 ± 6.4 | 31.2 ± 1.4 |
| 0.010 24 h | Ap | 1.08 ± 0.15 | 24.0 ± 7.7 | 325 ± 50 | 73 ± 7 | 79.7 ± 3.6 | 60.4 ± 1.4 |
| 0.010 96 h | Ap | 1.54 ± 0.14 | 11.5 ± 0.3 | 380 ± 65 | 92 ± 12 | 80.5 ± 2.2 | 53.5 ± 0.7 |
| 0.010 7 d | Ap | 1.53 ± 0.04 | 5.4 ± 1.2 | 90 ± 21 | 90 ± 21 | 30.6 ± 0.8 | 13.6 ± 0.1 |
| 0.020 4 h | Ap + OCP | 0.98 ± 0.02 | 13.0 ± 0.3 | 340 ± 50 | 75 ± 10 | 92.3 ± 2.3 | 62.3 ± 1.3 |
| 0.020 24 h | Ap + OCP | 1.05 ± 0.03 | 20.6 ± 0.4 | 1250 ± 15 | 225 ± 40 | 328 ± 5.6 d | 247 ± 4.1d |
| 0.020 96 h | Ap + OCP | 1.45 ± 0.01 | 13.3 ± 2.6 | 1870 ± 100 | 260 ± 45 | 567 ± 4.5d | 166 ± 3.2d |
| 0.030 96 hc | Ap + OCP | 1.56 ± 0.01 | 10.03 ± 0.3 | 1230 ± 50 | 210 ± 55 | 643 ± 10.2d | 128 ± 9.8d |
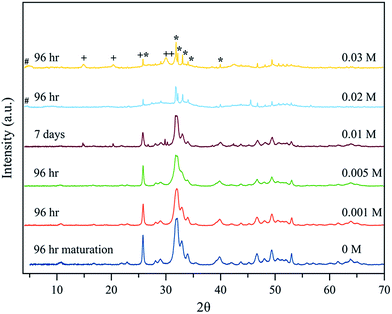
For x = 0.02 M Eu3+ both the reflection at 4.74° of OCP and/or the bulging of the baseline in the interval 23–38° are present at all maturation times tested. At 96 hours, in addition, strong and narrow apatite peaks emerging from the bulged baseline are observed, which indicates that bigger apatite crystals coexist with the OCP phase (Fig. 2 and SI1, see ESI†). Finally, for x = 0.03 M Eu3+ the OCP phase forms for all maturation times from 5 min to 96 hours and coexists with apatite at this last timepoint. Besides this reflection, the crystallographic features of a hexagonal phase identified as EuPO4·H2O (PDF 20 1044) are also observed at 96 hours (Fig. 2 and SI1†). A last precipitate obtained at 21 days is composed of the EuPO4·H2O phase and apatite, showing that for high Eu3+ amounts in the solution, europium phosphate precipitates beside apatite.
Taking into account that OCP is a known precursor for apatite formation, all the above results strongly suggest that the presence of europium ions in the precipitating medium significantly modifies the progression of apatite precipitation. This can most likely be related to an inhibitory effect of Eu3+ on apatite crystallization, as was already pointed out in the literature.9 These results however also indicate that adequate conditions for the thermal decomplexing approach can be determined for leading to the precipitation of an apatitic phase alone, as for example using x = 0 to 0.02 for 96 h, (Fig. 2). Such apatites precipitated as single phases by the thermal decomplexing method exhibited a Eu/(Ca + Eu) molar ratio varying between 0 and 0.22, as reported in Table 1, evidencing a large incorporated europium content, as well as a (Ca + Eu)/P molar ratio significantly lower than 1.67 pointing out their non-stoichiometry as for bone apatite.13
3.3 FTIR spectroscopy
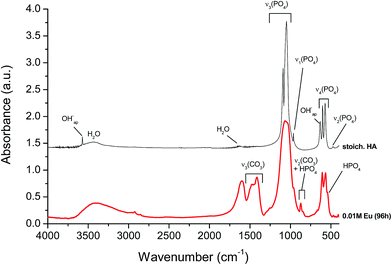
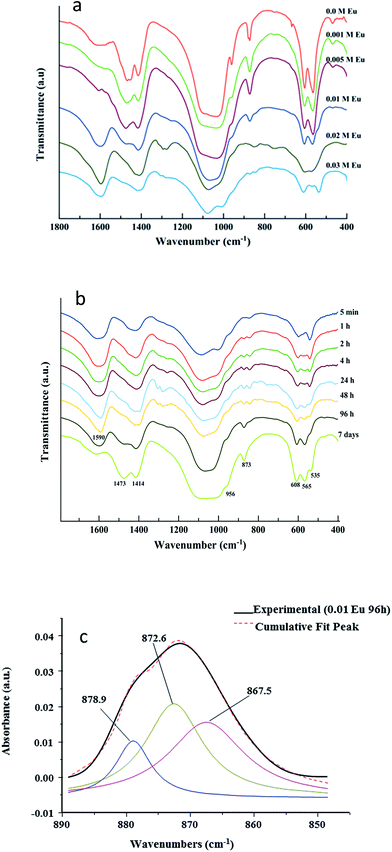
For complementary characterization, the samples were also analyzed by FTIR. The example of the compound corresponding to x = 0.01 at 96 h maturation is shown on Fig. 3, in comparison to a stoichiometric hydroxyapatite reference sample. Typical bands characteristic of poorly-crystallized carbonated apatite can be observed.Generally speaking, all spectra of Eu-free and Eu-doped specimens (x = 0.001 M to 0.010 M Eu3+) at maturation times of 96 hours were found to exhibit a broad band between 3600 cm−1 and 2600 cm−1 corresponding to O–H stretching from adsorbed water while no clear detection of apatitic OH bands around 3570 cm−1 was made, as is customary for bio-inspired apatites. The 400–1800 cm−1 region was more specifically analyzed, allowing to visualize typical spectral features of apatitic compounds. The main band at 1000–1100 cm−1 (Fig. 4a) corresponds to the asymmetric stretching mode of PO43− groups (υ3PO4). The shoulder at ∼965 cm−1 is ascribed to the symmetric stretching (υ1PO4) while less intense bands at ∼608 and 565 cm−1 are due to the bending mode of PO43− groups (υ4PO4). The band at ∼535 cm−1 in the υ4PO4 domain can be assigned to non-apatitic (surface) HPO42− ions, also clearly visible on Fig. 3, which points to the biomimetic nature of the precipitated nanocrystalline apatite in these compounds.35 Note however that this band is not clearly detected in the spectra of the Eu-free sample nor in the spectra of specimens prepared with doping concentrations 0.001 M and 0.005 M Eu3+ at the same times. However, it is important for 0.010 M Eu3+ at the lower maturation times, between 5 min and 4 hours (Fig. 3 and 4b). These findings reveal that, using this methodology of thermal decomplexing, a certain amount of europium is needed in the medium to play an effective inhibiting role on apatite crystallization, thus generating more immature apatite nanocrystals exhibiting larger non-apatitic surface layers.35 This, again, indicates the biomimetic nature of apatite crystals precipitated by the thermal decomplexing method, e.g. for x = 0.01 M Eu3+.
The presence of carbonate (CO32−) bands is attested by vibrational signatures due to the υ3CO3 mode, with maxima around ∼1414 cm−1 and 1473 cm−1, and the υ2CO3 mode with a bulging peak around 873 cm−1 (Fig. 4). From the intensity of FTIR carbonate bands relative to phosphate ones, it is possible to evaluate the overall degree of carbonation of the apatite phase. This quantification methodology has recently been revisited by Grunenwald et al.36 using the area ratio rc/p between the υ3CO3 and the υ1υ3PO4 contributions, between selected integration limits. Following this method, a rc/p ratio of 0.3185 is calculated, leading to an overall carbonation of sample x = 0.01 (96 h) estimated to 9.2 ± 0.5 wt%. This degree of carbonation may be somewhat overestimated due to partial overlapping with carboxylate COO− citrate bands (especially the one located at 1466 cm−1 (ref. 37)). The present precipitating conditions however lead to significantly larger carbonation than previously reached (up to 5.9 wt%) via the citrate-based thermal decomplexing approach.23
Detailed analysis of the υ2CO3 region was carried out to inspect the chemical environments of the carbonate species within the apatite phase (Fig. 4c). Spectral decomposition indicates that three contributions co-exist, at ∼879 (smaller shoulder), 873 (main contribution), and 868 (shoulder) cm−1. These bands are respectively attributable to A-type (minor), B-type (major), and labile (intermediate intensity) carbonate species.38 While A- and B-type correspond to carbonate ions replacing lattice ions (respectively OH− and PO43−) in apatite nanocrystals bulk, labile carbonates correspond to surface carbonate species belonging to the hydrated non-apatitic layer on the nanocrystals. CO32− ions replacing tetrahedral PO43− groups (B-type carbonation)23 are found here to be predominant. This is in agreement also with the positions of the 1414/1473 cm−1 bands from the υ3CO3 mode; however the co-presence of labile carbonate species is another feature pointing to the biomimetic character of the samples precipitated by this thermal decomplexing route, including in the presence of europium ions.
Beside apatitic vibrational contributions, a band at ∼1590 cm−1 is also noticed on all samples, which can be ascribed to the antisymmetric stretching frequencies of the carboxylate groups of the citrate. This band is sharper than that corresponding to the Eu-free sample, indicating a higher adsorption of citrate to the crystal surface due to the incorporation of Eu3+. Bands at ∼2930 cm−1 and ∼840 cm−1 are assignable to υCH2 and δCOO modes39 of the citrate ions, respectively. Note that the citrate layer (composed of citrate and Na+) adsorbed to Eu-Ap nanocrystals can be removed afterward by washing the crystals in a basic solution (NaOH 0.1 M), as we demonstrated in a previous work.29
3.4 Scanning and transmission electron microscopy
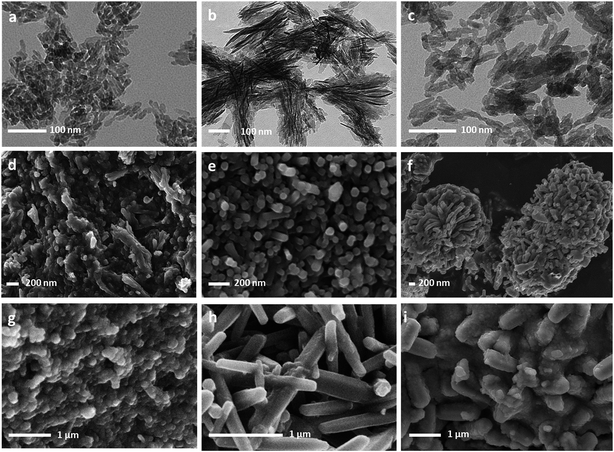
The morphological aspects of the particles composing the precipitates obtained for x = 0.001 M to x = 0.030 M Eu3+ are shown in Fig. 5. TEM micrographs (Fig. 5a and b) confirm the nanocrystalline character of the precipitates obtained for x < 0.010 M Eu3+ (t = 96 hours). For x = 0.010 M, SEM micrographs (Fig. 5d–f) show the formation of elongated hexagonal prisms of submicron or micron sizes at precipitation times below or equal to 96 h. Longer precipitation times (at least 7 days) are needed to obtain the characteristic features of Eu-doped nanocrystalline apatites (Fig. 5c). For x = 0.020 M Eu3+ (Fig. 5g and h) a mixture of small quasi spherical OCP nanocrystals (Fig. 5g) and elongated apatite microcrystals (Fig. 5h) is observed. The same occurred for x = 0.030 M (Fig. 5i). The conditions x = 0.010 M Eu3+ and maturation time 96 hours are, thus, the pair of conditions representing a boundary for the precipitation of the Eu-doped apatites with ‘nanosized’ dimensions, which is among the objectives of our study.Table 2 summarizes the main characterization results obtained in this work, including the crystalline phase composition of the precipitates, the evolution with the maturation time of dimensions of the crystalline domains of the Eu-doped cit-cAp, the average dimensions of the particles (length and width), the Ca/P ratio and the percentage of europium incorporated in the doped nanoparticles, as evaluated by EDS analyses. For the sake of simplicity, only the results obtained at some of the maturation times are shown.
The presence of nanoparticles (L < 100 nm) is observed only for x = 0.001, 0.005 and 0.010 M Eu3+ at 7 days. The evolution of the particle dimensions (L, W) with the maturation time depends on the doping concentration. For x = 0.001 and 0.005 M Eu3+ L increases while W decreases. For x = 0.010 M Eu3+ both L and W decrease until reaching nanosized dimensions at 7 days. For x = 0.020 M Eu3+ both L and W increase. The same trend is observed when we analyze the dimensions of the crystalline domains via the Profex software. Both particle size and dimensions of the crystalline domains are similar only when the particle size is less than 40 nm, i.e. for x = 0.001 M Eu3+. Concerning the incorporation of europium during the formation of Eu-doped cit-cAp we observed similar trends irrespective of x. At x = 0.001 M Eu3+, the nanoparticles incorporate only ≈2 wt% Eu3+ at any maturation time. For x = 0.005, 0.010 M the europium contents are lower at the higher maturation times (i.e. 5.25 wt% against 14.6 wt% for x = 0.005 M Eu3+, 5.4 wt% against 23.8 wt%), indicating that increasing the time favors the Ca2+ to be accommodated in the apatitic structure against Eu3+. This is reflected in a Ca/P ratio closer to the theoretical one of a stoichiometric hydroxyapatite (1.67). For x = 0.020 M Eu3+ the Eu content of around 13 wt% is kept constant with the maturation time.
Considering that EuCl3 and Na2CO3 are reagents used in the precipitation experiments and Eu3+, Na+ and CO32− are prone to entering the apatite structure, an anionic–cationic multiple substitution mechanism might be active during the formation of the doped apatite.40,41 One likely mechanism implies that 2 Eu3+ ions substitute 3 Ca2+ generating a Ca2+ vacancy,41 while Na+ and CO32− can substitute Ca2+ and PO43− in B-position, respectively, by any of six fundamental mechanisms reported by Maeyer and Verbeeck or by a linear combination of some of them.42
During the doping process Eu3+ substitutes Ca positions in the cit-cAp structure. In the apatitic unit cell there is a total of 10 calcium ions per unit cell, with four of them in Ca(I) positions, which are in columns parallel to the c-axis. Each Ca(I) is surrounded by nine oxygen atoms. The other six calcium ions per unit cell, called Ca(II), form two equilateral triangles localized along the c-axis at z = 1/4 and 3/4, a so-called anion channel, which is typically occupied by monovalent anions.43 Site Ca(I) is smaller in volume than site Ca(II). As the Eu3+ ionic radius (1.08 Å) is slightly higher than the ionic radius of Ca2+ (0.99 Å), we can speculate that Eu3+ is more prone to occupy Ca(II) positions. However, we have no data to properly assign the substitution in these two non-equivalent positions.
3.5 Electrokinetic properties of Eu-doped cit-cAp nanoparticles
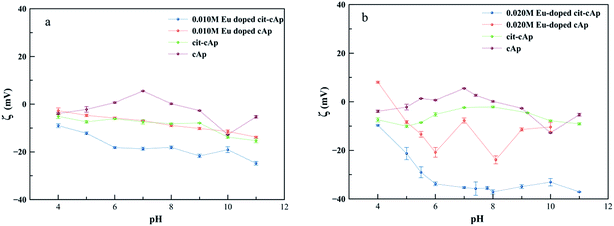
An important property of colloidal Eu-doped cit-cAp suspensions regarding its potential applications as drug delivery vehicles or as luminescent probes is the ζ-potential of the suspensions vs. pH of the medium, which influences the aggregation state of the particles. Fig. 6a and b depict the evolution of ζ-potential for the cases x = 0.010 M and x = 0.020 M Eu3+ respectively. In both series, four samples were analyzed: Eu-doped cit-cAp, Eu-doped cAp, cit-cAp and cAp (see caption of Fig. 6).The general trend observed along the whole pH range (from 3 to 11) is the decrease of the ζ-potential in the order: cAp > cit-cAp > Eu-doped cAp > Eu-doped cit-cAp. For each subsystem, the presence of the citrate layer and Eu3+ substituting Ca2+ in the apatite structure leads the ζ-potential to be more negative until levels allowing the preparation of stable suspensions. For x = 0.010 M Eu3+ at pHs 7 and 5 these values are −18.7 and −12.2 mV, whereas for x = 0.020 M Eu3+ they are more negative, around −35.3 and −29.0 mV. These pHs are close to the physiological pH in the blood circulation and the more acidic pH in the endosome–lysosome intracellular compartment, respectively. In contrast, aqueous suspensions of cAp show ζ-potential values closer to 0 except at high pHs, indicating that they are the least stable suspensions. The negative values of the ζ-potential found for the cit-cAp is explained on the basis of the interaction of the negatively charged free carboxylate groups (–COO−) of the adsorbed citrate layer with the aqueous medium. This interaction is stronger than that produced by the Caδ+, >PO4δ−, >CO3δ−,>OHδ− surface groups of cAp nanoparticles. The incorporation of Eu3+ in the apatite structure (case of Eu-doped cAp) originates Ca2+ vacancies in the bulk structure as well as in the surface of the nanoparticles, thus making the surface more negatively charged. In the Eu-doped cit-cAp samples, this negative charge is increased by the presence of the citrate layer.
3.6 Luminescence properties of solid Eu-doped cit-cAp samples
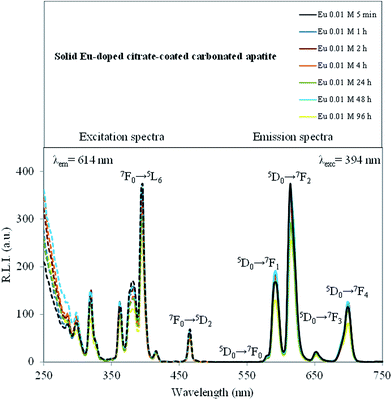
Some lanthanides, especially Eu3+ and Tb3+, form highly fluorescent chelates with many different organic ligands. The sensitized fluorescence results from the ligand absorbing light, the energy of which is then transferred to the chelated metal ion. In fact, Eu3+ emits the energy as narrow-banded, line-type fluorescence with a long Stokes shift (over 250 nm) and an exceptionally long fluorescence decay time (up to 1 ms).44 Because of the long fluorescence decay time (over 10 times longer than the average background fluorescence) of Eu3+, a delay time (td) and a gate time (tg) can be used during the measuring, remarkably reducing the background fluorescence.The luminescence properties of solid Eu-doped cit-cAp samples are depicted in Fig. 7 and SI2 of ESI† which show the uncorrected excitation and emission spectra.
The observed excitation wavelengths for the powder were 320, 362, 380, 394 and 465 nm which correspond to the Eu3+ ion 7F0 → 5H6, 7F0 → 5D4, 7F0 → 5L7, 7F0 → 5L6, and 7F0 → 5D2 transitions, and the emission wavelengths were 576, 590, 614, 650 and 698 nm, which correspond to the Eu3+ ion 5D0 → 7F0, 5D0 → 7F1, 5D0 → 7F2, 5D0 → 7F3 and 5D0 → 7F4 transitions, respectively.45 The emission wavelength corresponding to the hypersensitive transition without inversion center (5D0 → 7F2, 614 nm) produces the highest relative luminescence intensity, while the 5D0 → 7F0 produces the lowest one. Therefore, the optimum excitation and emission wavelengths of solid Eu-doped material were 394 nm and 614 nm, respectively. The cit-cAp sample, free of Eu3+, does not show any luminescence emission (see ESI, Fig. SI2a†), thus it is possible to deduce that the luminescent properties of these materials are only due to the incorporation of Eu3+ into their structure. Ternane et al.46 pointed out that three kinds of spectroscopic sites could be distinguished for 5D0 → 7F0 transitions of Eu3+. The former two sites were associated with 5D0 → 7F0 emission of Eu3+ ions in Ca(II) sites and the latter one was associated with that in Ca(I) sites. The intensity ratio of the emissions in Ca(I) respect to Ca(II) was about 1/20. In our experiments the low intensity of the 5D0 → 7F0 transition at 575 nm does not allow us to deconvolute the small peak in Fig. 7. Therefore we deduce that it is mostly associated with Eu3+ in Ca(II) positions.
Fig. SI3 and SI4 (see ESI†) also show the effect of the maturation time and concentration of Eu3+ on the luminescence properties. It is possible to observe that neither the maturation time nor the concentrations of doping agent affect the excitation and emission wavelengths. Nevertheless, the relative luminescence intensity (R.L.I.) is affected by both parameters.
The evolution of the R.L.I. versus maturation time for 0.001 M Eu3+ doping concentration does not report any relevant information because the luminescence emission is too weak and the measurement errors might be higher than the luminescent changes. 0.005 and 0.010 M Eu3+ doping concentrations show similar evolutions with the precipitation time; the highest signal is obtained at t = 5 min, then a decrease of the luminescence emission is observed up to 24 h, maintaining this emission for larger times. These observations agree with the evolution of the Eu incorporated to the solids (Table 2) and might be linked to the formation of transient metastable intermediate phases incorporating europium ions and for which luminescence yield could be high. XRD data (Fig. 1) indeed pointed out poorly crystallized samples for low maturations times. Samples prepared with 0.020 and 0.030 M Eu3+ doping concentrations show similar evolutions with time; a high signal is obtained at t = 5 min, then the R.L.I. decreases up to 48 h and increases for 96 h.
Concerning the effect of the Eu3+ doping concentration, Fig. SI4 of ESI† shows the evolution of the R.L.I. for a fixed precipitation time versus the concentration of Eu3+. The evolution for 5 min and 1 h is practically the same; the R.L.I. increases with the concentration of Eu3+, reaching the maximum R.L.I. at 0.030 and 0.020 M, respectively. Precipitation times of 2, 4 and 24 h, show similar variations; the R.L.I. increases from 0 to 0.010 M, then it is maintained from 0.01 to 0.02 M and for Eu3+ concentrations higher than 0.02 M it is increased again. Finally, for the 96 h sample, the R.L.I. increases with the Eu3+ concentration until reaching a maximum emission at 0.02 M, and then it decreases for higher concentrations. For large europium amounts in the apatitic lattice, a phenomenon of luminescence quenching might indeed occur due to Eu3+ luminescent centers too close from each other.
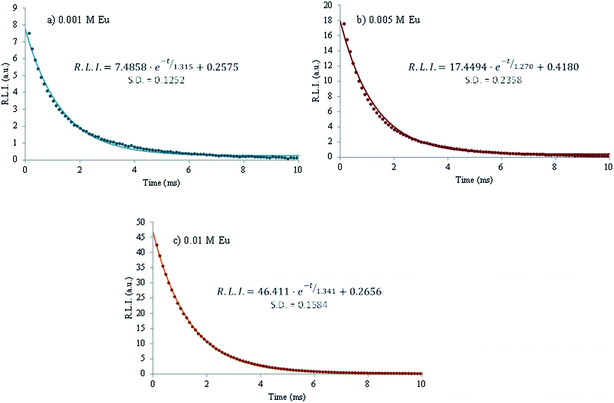
An important parameter in luminescent complexes is the luminescence lifetime (τ). The decrease of the R.L.I. versus time for 0.001, 0.005 and 0.01 M Eu3+ at 96 h is shown in Fig. 8. For each case, the decay profile was analyzed as a single exponential component (R.L.I. = Ae−t/τ + C) obtaining τ of 1315, 1147 and 1341 μs, respectively. It is possible to conclude that the luminescence lifetime for all the tested concentrations are almost the same, of the order of the millisecond. This order of magnitude is similar to that or colloidal apatite nanoparticles stabilized with a phospholipid moiety, AEP,47 and points out a long luminescence lifetime as compared to the auto-fluorescence of biological matter (of the order of the nanosecond), thus allowing us to envision applications as biomedical probes. This luminescence is expected to be linked to Eu3+ luminescent centers (most likely in Ca(II) positions) located in the apatitic lattice for all the samples studied.
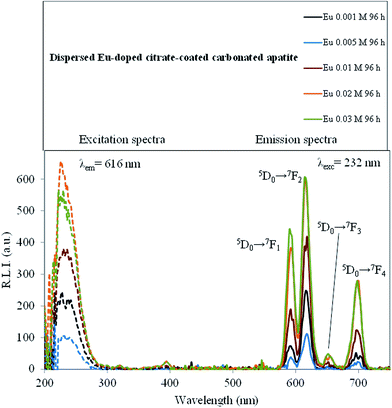
3.7 Luminescence properties of Eu-doped cit-cAp nanoparticles in aqueous suspension
The luminescence properties of the Eu-doped cit-cAp samples suspended in water are depicted in Fig. 9 which shows the uncorrected excitation and emission spectra.The maximum excitation wavelength observed was 232 nm. The observed emission wavelengths were 592, 616, 648 and 696 nm, which correspond to the Eu3+ ion 5D0 → 7F1, 5D0 → 7F2, 5D0 → 7F3 and 5D0 → 7F4 transitions, respectively.45 The emission wavelength corresponding to the hypersensitive transition without inversion centre (5D0 → 7F2, 616 nm) produces the highest relative luminescence intensity. Therefore, the optimum excitation and emission wavelengths of the Eu-doped material dispersed in water were 232 nm and 616 nm, respectively.
It is known that the media affect the luminescence intensities of luminophores.48 In order to obtain a deeper understanding, the effects of changes in pH, ionic strength and temperature were evaluated.
The influence of pH on the luminescence intensity was studied over the range 5.0–7.4 (see ESI, Fig. SI5†) for the materials obtained for x = 0.001, 0.005, 0.010 and 0.020 M Eu3+at 96 h. For Eu3+doped samples obtained with 0.001 M Eu3+doping concentration, the R.L.I. remained approximately constant from pH 5.0 to 6.5. Beyond this pH value a drastic rise was observed. For the 0.005 M Eu3+ sample the variation is the opposite, the R.L.I. remained approximately constant from pH 5.0 to 6.5, beyond which a drastic drop was observed. For the rest of Eu3+ concentrations, the R.L.I. was practically not altered by the pH. The variation of the R.L.I. with the pH is a complex phenomenon which could be attributed to the balance between the tendency of the apatite nanoparticles to dissolve at acidic pHs and the protection from dissolution offered by citrate layer, whose amount increases with the concentration of Eu3+ doping the samples as shown by the evolution of the antisymmetric stretching frequency of the carboxylate group of citrate at 1590 cm−1 in the FTIR spectra of Fig. 4a.
The effect of ionic strength was studied by suspending the particles in solutions of different concentrations of NaCl (0, 25, 50, 75 and 100 mM). The results are shown in Fig. SI6† of ESI. Overall, the ionic strength did not affect significantly the luminescent activity.
Temperature may also theoretically affect luminescence event by quenching of excited states: increasing T increases molecular motion and collisions, and hence decreases the luminescence emission by increasing encounters probabilities.49 Therefore, it is important to know the effect of the T on this kind of materials because their main application might be for medical and biomedical imaging (∼37.4 °C) while all the previous experiments were performed at RT (25 °C). Fig. SI7 of ESI† shows the experimental results obtained when monitoring the temperature effect. To sum up, increasing from 25 to 37 °C decreases the luminescence emission of all the tested materials in suspension (0.01, 0.02 and 0.03 M Eu3+, maturation time of 96 h). The change in fluorescence intensity is normally 1% per degree celsius;49 however for these materials the decrease is found to be somewhat larger, around 1.3, 2.0 and 3.8% per degree celsius, respectively.
3.8 Cytocompatibility of Eu-doped cit-cAp nanoparticles
The cytocompatibility of Eu-doped cit-cAp samples was tested in a MTT assay on the GTL-16 human carcinoma cells and on the m17.ASC murine mesenchymal stem cells, after incubation at different concentrations ranging from 100 to 0.1 μg mL−1. No significant toxicity was observed on GTL-16 cells at any nanoparticle concentration (Fig. 10a). Indeed in all cases cell viability was always higher than 83%.In the case of the mesenchymal stem cells a somehow higher toxicity was observed in samples prepared with doping concentrations 0.020 and 0.030 M Eu3+. For these samples the highest cell viability was around 70–75% of the controls run with undoped nanoparticles (Fig. 10b). In any case the level observed is above the cytocompatibility cut-off (70%) indicated by ISO 10993-5:2009 (ref. 50) and, moreover, it is largely reported from the literature that cell lines can differ in their sensitivity to external stimuli.51,52 On the other side, both cell types were sensitive to the toxic activity of doxorubicin, which reduced their viability to less than 40%.
This in vitro evaluation thus pointed out the good cytocompatibility of the Eu-doped cit-cAp nanoparticles prepared by the thermal decomplexing method, thus showing promise for their future biomedical use as luminescent nanoprobes.
4 Conclusions
Luminescent Eu-doped cit-cAp particles were prepared and fully characterized, for the first time, using the citrate-based thermal decomplexing method. This study allowed to determine the most appropriate experimental conditions, especially in terms of europium concentration and duration of maturation, so as to obtain single-phased apatitic particles with nanosized dimensions for which the biomimetic (bone-like) nature was evidenced. Their luminescence properties were investigated in detail, both as powders and suspensions, pointing out their long luminescence lifetime (of the order of the millisecond), relevant for biomedical uses. The cytocompatibility of the particles was then explored on two cell types. The nano-systems appear to be fully cytocompatible since none of the concentrations assessed in the MTT, ranging from 0.1 to 100 μg mL−1, was found to be significantly toxic. Consequently, these highly biocompatible, bio-inspired nanoparticles produced by thermal decomplexing of citrate complex could represent valuable new luminescent nanoprobes for applications in biology and medical imaging, and could also serve in (targeted) cell therapy.Conflicts of interest
There are no conflicts to declare.Acknowledgements
We greatly acknowledge the project Biomin-nanoapatite MAT2014-60533-R supported by Spanish MINEICO and co-funded by FEDER and the Excellence Network of Crystallography and Crystallization “Factoría de Cristalización” FIS2015-71928-REDC supported by Spanish MINEICO. Cristóbal Verdugo-Escamilla also acknowledges the Spanish MINEICO for his contract PTA2015-11103-I.References
- V. K. A. Sreenivasan, A. V. Zvyagin and E. M. Goldys, J. Phys.: Condens. Matter, 2013, 25, 194101–194124 CrossRef PubMed.
- J. Li and J.-J. Zhu, Analyst, 2013, 138, 2506–2515 RSC.
- C.-C. Fu, H.-Y. Lee, K. Chen, T.-S. Lim, H.-Y. Wu, P.-K. Lin, P. K. Wei, P. H. Tsao, H.-C. Chang and W. Fann, Proc. Natl. Acad. Sci. U. S. A., 2007, 104(3), 727–732 CrossRef CAS PubMed.
- Y.-C. Yeh, B. Creran and V. M. Rotello, Nanoscale, 2012, 4, 1871–1880 RSC.
- F. Wang, W. B. Tan, Y. Zhang, X. P. Fan and M. Q. Wang, Nanotechnology, 2006, 17, R1–R13 CrossRef CAS.
- F. Oltolina, L. Gregoletto, D. Colangelo, J. Gómez-Morales, J. M. Delgado-López and M. P. Monoclonal, Langmuir, 2015, 31, 1766–1775 CrossRef CAS PubMed.
- T. S. H. Perera, Y. Han, X. Lu, X. Wang, H. Dai and S. Li, J. Nanomater., 2015, 6 Search PubMed.
- A. Al-Kattan, V. Santran, P. Dufour, J. J. Dexpert-Ghys and C. Drouet, J. Biomater. Appl., 2014, 28, 697–707 CrossRef PubMed.
- A. Al-Kattan, P. Dufour, J. Dexpert-Ghys and C. Drouet, J. Phys. Chem. C, 2010, 114, 2918–2924 CAS.
- S. Ranjbarvaziri, S. Kiani, A. Akhlaghi, A. Vosough, H. Baharvand and N. Aghdami, Biomaterials, 2011, 32, 5195–5205 CrossRef CAS PubMed.
- A. Al-Kattan, S. Girod-Fullan, C. Charvillat, H. Ternet-Fontebasso, P. Dufour, J. Dexpert-Ghys, V. Santran, J. Bordere, B. Pipy, J. Bernad and C. Drouet, Int. J. Pharm., 2012, 423, 26–36 CrossRef CAS PubMed.
- A. Escudero, M. E. Calvo, S. Rivera-Fernández, J. M. de la Fuente and M. Ocaña, Langmuir, 2013, 29, 1985–1994 CrossRef CAS PubMed.
- J. Gomez-Morales, M. Iafisco, J. M. Delgado-López, S. Sarda and C. Drouet, Prog. Cryst. Growth Charact. Mater., 2013, 59, 1–46 CrossRef CAS.
- A. Grunenwald, C. Keyser, A. M. Sautereau, E. Crubezy, B. Ludes and C. Drouet, Appl. Surf. Sci., 2014, 292, 867–875 CrossRef CAS.
- M. Iafisco, J. M. Delgado-Lopez, E. M. Varoni, A. Tampieri, L. Rimondini, J. Gómez-Morales and M. Prat, Small, 2013, 9, 3834–3844 CrossRef CAS PubMed.
- I. Rodríguez-Ruiz, J. M. Delgado-López, M. A. Duran-Olivencia, M. Iafisco, A. Tampieri, D. Colangelo, M. Prat and J. Gomez-Morales, Langmuir, 2013, 29, 8213–8221 CrossRef PubMed.
- M. Iafisco, C. Drouet, A. Adamiano, P. Pascaud, M. Montesi, S. Panseri, S. Sarda and A. Tampieri, J. Mater. Chem. B, 2016, 4, 57 RSC.
- C. Drouet, A. Al-Kattan, M. Choimet, A. Tourrette, V. Santran, J. Dexpert-Ghys, B. Pipy, F. Brouillet and M. Tourbin, J. Gen. Pract. Med. Diagn., 2015, 1, 1–9 Search PubMed.
- C. Sanchez, H. Arribart and M. M. Girau-Guille, Nat. Mater., 2005, 4, 277 CrossRef CAS PubMed.
- S. V. Dorozhkin, Acta Biomater., 2010, 6, 715–734 CrossRef CAS PubMed.
- A. López-Macipe, J. Gómez-Morales and R. Rodríguez-Clemente, Adv. Mater., 1998, 10(1), 49–53 CrossRef.
- J. Gómez-Morales, R. Rodríguez-Clemente, B. Armas, C. Combescure, R. Berjoan, J. Cubo, E. Martínez, J. García-Carmona, S. Garelik, J. Murtra and D. N. Muraviev, Langmuir, 2004, 20(13), 5174–5178 CrossRef.
- J. M. Delgado-López, M. Iafisco, I. Rodríguez-Ruiz, M. Prat, J. Gómez-Morales and A. Tampieri, Acta Biomater., 2012, 8, 3491–3499 CrossRef PubMed.
- J. M. Delgado-López, R. Frison, A. Cervellino, J. Gómez-Morales, A. Guagliardi and N. Masciocchi, Adv. Funct. Mater., 2014, 24, 1090–1099 CrossRef.
- M. Iafisco, G. B. Ramírez-Rodríguez, Y. Sakhno, A. Tampieri, G. Martra, J. Gómez-Morales and J. M. Delgado-López, CrystEngComm, 2015, 17, 507–511 RSC.
- Y. Y. Hu, A. Rawal and K. Schmidt-Rohr, Proc. Natl. Acad. Sci. U. S. A., 2010, 107, 22425–224259 CrossRef CAS PubMed.
- P. Ivanchenko, J. M. Delgado-López, M. Iafisco, J. Gómez-Morales, A. Tampieri, G. Martra and Y. Sakhno, Sci. Rep., 2017, 7, 8901 CrossRef PubMed.
- A. C. Deymier, A. K. Nair, B. Depalle, Z. Qin, K. Arcot, C. Drouet, C. Yoder, M. Buehler, S. Thomopoulos, G. Genin and J. Pasteris, Biomaterials, 2017, 127, 75–88 CrossRef CAS PubMed.
- F. J. Martínez-Casado, M. Iafisco, J. M. Delgado-López, C. Martínez-Benito, C. Ruiz-Perez, D. Colangelo, F. Oltolina, M. Prat and J. Gómez-Morales, Cryst. Growth Des., 2016, 1, 145–153 Search PubMed.
- C. Zhang, J. Yang, Z. Quan, P. Yang, C. Li, Z. Hou and J. Lin, Cryst. Growth Des., 2009, 9(6), 2725–2733 CAS.
- N. Döbelin and R. Kleeberg, J. Appl. Crystallogr., 2015, 48, 1573–1580 CrossRef PubMed.
- S. Giordano, C. Ponzetto, M. F. Di Renzo, C. S. Cooper and P. M. Comoglio, Nature, 1989, 339(6220), 155–156 CrossRef CAS PubMed.
- E. Villa-Moruzzi, S. Lapi, M. Prat, G. Gaudino and P. M. Comoglio, J. Biol. Chem., 1993, 268(24), 18176–18180 CAS.
- A. Zamperone, S. Pietronave, S. Merlin, D. Colangelo, G. Ranaldo, E. Medico, F. Di Scipio, G. N. Berta, A. Follenzi and M. Prat, Stem Cells Dev., 2013, 22(21), 2873–2884 CrossRef CAS PubMed.
- N. Vandecandelaere, C. Rey and C. Drouet, J. Mater. Sci.: Mater. Med., 2012, 23, 2593–2606 CrossRef CAS PubMed.
- A. Grunenwald, C. Keyser, A. M. Sautereau, E. Crubezy, B. Ludes and C. Drouet, J. Archaeol. Sci., 2014, 49, 134–141 CrossRef CAS.
- B. R. Lakshmana, J. Indian Inst. Sci., 1957, 39A, 27–29 Search PubMed.
- C. Rey, C. Combes, C. Drouet and D. Grossin, in Comprehensive Biomaterials, ed. P. Ducheyne, K. E. Healy, D. W. Hutmacher, D. W. Grainger and C. J. Kirkpatrick, Elsevier Science, 1st edn, 2011, ch. 1, pp. 187–221 Search PubMed.
- G. Socrates, Infrared and Raman characteristic group frequencies. Tables and charts, John Wiley and Sons, Ltd, Chichester, 3rd edn, 2001 Search PubMed.
- M. Šupová, Ceram. Int., 2015, 41, 9203–9231 CrossRef.
- A. Al-Kattan, P. Dufour, J. Dexpert-Ghys and C. Drouet, J. Phys. Chem. C, 2010, 114, 2918–2924 CAS.
- E. A. P. De Maeyer and R. M. H. Verbeeck, Bull. Soc. Chim. Belg., 1993, 102(9), 601–609 CrossRef CAS.
- H. ElFeki, J. M. Savariault and A. Ben Salah, J. Alloys Compd., 1999, 287, 114–120 CrossRef CAS.
- I. Hemmilä, S. Dakubu, V.-M. Mukkala, H. Siitaria and T. Lövgrena, Anal. Biochem., 1984, 137, 335–343 CrossRef.
- F. S. Richardson, Chem. Rev., 1982, 82, 541–552 CrossRef CAS.
- R. Ternane, M. Trabelsi-Ayedi, N. Kbir-Ariguib and B. Piriou, J. Lumin., 1999, 81, 165–170 CrossRef CAS.
- A. Al-Katan, V. Santran, P. Dufour, J. Dexpert-Ghys and C. Drouet, J. Biomater. Appl., 2014, 28, 697–707 CrossRef PubMed.
- J. R. Lakowicz, Principles of Fluorescence Spectroscopy, Springer, New York, USA, 3rd edn, 2006 Search PubMed.
- G. G. Guilbault, Practical Fluorescence, CRC Press Book, 2nd edn, 1990 Search PubMed.
- ISO 10993-5 2009 Biological Evaluation of Medical Devices Part 5: Tests for In Vitro Cytotoxicity (International Standard Organization, Geneve, CH).
- M. I. Khan, A. Mohammad, G. Patil, S. A. Naqvi, L. K. Chauhan and I. Ahmad, Biomaterials, 2012, 33, 1477–1488 CrossRef CAS PubMed.
- M. Nedyalkova, B. Donkova, J. Romanova, G. Tzvetkov, S. Madurga and V. Simeonov, Adv. Colloid Interface Sci., 2017, 249, 192–212 CrossRef CAS PubMed.
Footnote |
| † Electronic supplementary information (ESI) available. See DOI: 10.1039/c7ra12536d |
| This journal is © The Royal Society of Chemistry 2018 |

