 Open Access Article
Creative Commons Attribution 3.0 Unported Licence
Cocatalyst designing: a binary noble-metal-free cocatalyst system consisting of ZnIn2S4 and In(OH)3 for efficient visible-light photocatalytic water splitting†
Jinyan Zhaoa,
Xiaoming Yana,
Ning Zhaob,
Xiao Lia,
Bin Lua,
Xuhong Zhang *a and
Haitao Yu*a
aCollege of Chemistry and Materials Science, Hebei Normal University, Shijiazhuang, 050024, China. E-mail: xuhongshd@126.com; haitaoyu@hebtu.edu.cn
bInstitute of Coal Chemistry, Chinese Academy of Sciences, Taiyuan, 030001, China
First published on 29th January 2018
Abstract
A binary noble-metal-free cocatalyst consisting of ZnIn2S4 and In(OH)3 was developed via a facile one-step hydrothermal method. The ZnIn2S4/In(OH)3 modified ZnWO4 nanocomposite exhibited enhanced photocatalytic H2 evolution activity compared to all the related pure samples and binary composite photocatalysts under visible light irradiation. The enhanced photocatalytic hydrogen production activities can be attributed to the synergistic effects of the favorable light trapping ability and efficient spatial charge separation. The photocatalytic hydrogen evolution activity over other semiconductors, such as Zn2SnO4 and TiO2, can also be significantly increased by loading ZnIn2S4/In(OH)3 as a cocatalyst. The results clearly demonstrated that ZnIn2S4/In(OH)3 is discovered as a new class of earth-abundant cocatalyst for water-splitting under visible light irradiation. It is expected that our work could provide a new strategy to improve the visible light response of semiconductors and facilitate their application in water splitting.
Introduction
Photocatalytic water-splitting is a promising approach for the clean, economical, and environmentally benign production of hydrogen by utilizing solar energy.1–8 During the past few decades, many photocatalytic materials, such as sulfide-, oxide- and oxynitride based materials, have been extensively explored for hydrogen generation through splitting water.9–11 However, none of them can meet the requirements for practical large-scale application to photocatalytic H2 evolution under visible light. Hence, the highly efficient visible light photocatalysts for hydrogen production is still highly demanded for practical applications.It is well-known that a cocatalyst plays a significant role in improving both the activity and stability of semiconductor photocatalysts. Noble metals such as Pt, Rh, Au and oxides such as RuO2 are generally used as cocatalysts for photocatalytic hydrogen evolution. However, the above noble-metal based cocatalysts are too scarce and expensive. It is necessary to explore alternative cocatalysts based on inexpensive transition metals to facilitate the up-scaling of renewable H2 production.
Recently, ZnIn2S4 with a suitable band gap (2.06–2.58 eV),12,13 have been demonstrated to be excellent cocatalyst for CdIn2S4 and K2La2Ti3O10 in the photocatalytic hydrogen evolution.14–16 It has been also proved to be an efficient visible-light driven photocatalyst or sensitizer to extend the absorption spectra of some wide-gap photocatalysts from the UV region to the visible region.17,18
Furthermore, the unique 2D layer structure nanostructure of ZnIn2S4 enables its application as an excellent supporting matrix in the construction of heterostructured nanocomposite photocatalysts with high photocatalytic activity.19–22 In addition, it was reported that indium ions can hydrolyze into In(OH)3 when the pH value of the reaction system was above 2.5.23 So it is convenient to obtain ZnIn2S4/In(OH)3 nanocomposite by a simple hydrothermal strategy by adjusting the pH value of the solution. In(OH)3 is an important wide-gap semiconductor material with a direct bandgap of 5.15 eV.23–25 The wide band gap provides photogenerated charge with stronger redox capability, favoring photocatalytic performance. Therefore it is expected that ZnIn2S4/In(OH)3 can be an ideal candidate as a non-noble-metal cocatalyst system for water splitting under visible light irradiation.
Herein, the ZnIn2S4/In(OH)3 modified ZnWO4 nanocomposite was fabricated by a facile three-step hydrothermal strategy. The results revealed that as-prepared ternary ZnIn2S4/In(OH)3/ZnWO4 nanocomposite exhibited enhanced photocatalytic H2-evolution activity than all the related pure samples and binary composite photocatalysts. Based on the experimental results, a possible synergistic mechanism for the enhanced photocatalytic H2 evolution activity was proposed. The photocatalytic hydrogen evolution activity over other semiconductor such as Zn2SnO4![[thin space (1/6-em)]](https://www.rsc.org/images/entities/char_2009.gif) 26 and TiO2,27 can also be significantly increased by loading ZnIn2S4/In(OH)3 as a cocatalyst. The results clearly demonstrated that ZnIn2S4/In(OH)3 is discovered as a new class of earth-abundant cocatalyst for water-splitting under visible light irradiation. It is expected that our work could provide deep insight into design and application of new system with high activity for solar hydrogen generation in the future.
26 and TiO2,27 can also be significantly increased by loading ZnIn2S4/In(OH)3 as a cocatalyst. The results clearly demonstrated that ZnIn2S4/In(OH)3 is discovered as a new class of earth-abundant cocatalyst for water-splitting under visible light irradiation. It is expected that our work could provide deep insight into design and application of new system with high activity for solar hydrogen generation in the future.
Experimental
Preparation of photocatalysts
The preparation of In(OH)3 was similar to that of ZnIn2S4. In a typical procedure, 0.782 g In(NO3)3·4.5H2O was added into the solution. The pH value of the solution was adjusted to 6 by adding 0.2 mol L−1 NaOH. The mixed solution was then transferred into a 100 mL Teflon-lined autoclave and heated at 180 °C for 12 h. The remaining steps are the same as ZnIn2S4.
The synthesis of ZnIn2S4/In(OH)3 is similar to that of ZnIn2S4. All of the experimental conditions are same except the initial pH value. The pH value of the solution was adjusted to 3.5, 4.5 and 5.5 with 0.2 mol L−1 NaOH, respectively. The products synthesized at different pH values were labeled as ZnIn2S4/In(OH)3-3.5, ZnIn2S4/In(OH)3-4.5, ZnIn2S4/In(OH)3-5.5, respectively.
Characterization
The phase structure and crystallinity of the products was measured by X-ray diffraction (XRD) patterns, which were recorded on a Bruker D8 Advance X-ray diffractometer with Cu Kα radiation at 40 kV and 40 mA. The morphology of the samples was detected by field emission scanning electron microscopy (FESEM, Hitachi S-4800) and transmission electronic micrograph (TEM, Hitachi, H-7650). High resolution transmission electron microscopy (HR-TEM) images were collected on a JEM-2100 electron microscope, operated at an acceleration voltage of 200 kV. XPS studies were carried out by means of a VG-ESCALAB250 electronic spectrometer using an Al Kα excitation source (hν = 1486.6 eV). The position of the C 1s peak was taken as a standard (with a banding energy of 284.6 eV). The Brunauer–Emmett–Teller (BET) surface areas (SBET) of the samples were measured by a N2 sorption analyzer (Quantachrome, NOVA 4000e) at a liquid nitrogen temperature. UV-vis diffuse reflectance spectra of the samples were evaluated using a UV-vis spectrophotometer (U-3010, Hitachi, Japan). Photoluminescence (PL) spectra of the samples were performed using an Hitachi F-4600 fluorescence spectrophotometer.Photocatalytic H2-production activity
The photocatalytic hydrogen-production experiment was conducted in a closed gas circulation and evacuation system fitted with a top window Pyrex cell. A 300 W xenon lamp (PLS-SXE300C, Beijing Perfectlight Co. Ltd., China) which was positioned 10 cm away from the solution surface, coupled with a UV cut-off filter (λ > 420 nm) was used to provide the visible light. The focus intensity measured by a spectroradiometer (PM100D, Thorlabs, America) was 0.54 W cm−2. In each run, 0.05 g photocatalyst was dispersed in a 100 mL aqueous solution containing 0.25 M Na2SO3 and 0.35 M Na2S, which served as a sacrificial agent. Before the irradiation with visible light, the suspension was degassed with N2 for 1 h to drive away the O2 in the system. The reaction cell was kept at room temperature with cooling water. The produced H2 was detected using an online gas chromatography (GC7900, N2 carrier, 5 Å molecular sieve column, TCD detector). The reaction was continued for 3 h. The apparent quantum efficiency (QE) was measured by the similar condition, but the light source was changed into high power LED (PLS-LED100B, Beijing Perfectlight Co. Ltd., China). The QE was calculated based on the following equation:Photoelectrochemical measurements
The working electrodes were prepared as follow: 0.05 g of the sample, 0.05 g of polyethyleneglycol (molecular weight 20![[thin space (1/6-em)]](https://www.rsc.org/images/entities/char_2009.gif) 000) and 0.5 mL of ethanol were mixed and ground into the slurry. Then the slurry was evenly coated onto a 2 cm × 1.2 cm F-doped SnO2-coated (FTO) glass electrode by the doctor blade method. The area and the thickness of the coating layer were limited to 1 cm2 and 0.01 mm, respectively. Finally, the prepared electrodes were dried in an oven at 100 °C for 60 min. The measurement of the photocurrent and electrochemical impedance spectroscopy (EIS) were performed on an electrochemical analyzer (CHI660E, Shanghai Chenhua Limited, China) in a standard three-electrode system. In this system, the prepared glass electrodes were used as the working electrodes. Pt wire and Ag/AgCl (saturated 0.3 M KCl) were used as counter electrode and reference electrode, respectively. The three electrodes were connected by the electrolyte of 0.5 M Na2SO4. The source of visible light is a 300 W Xe lamp with a UV cut-off filter (λ > 420 nm). The EIS were tested in the same standard three-electrode system, the phase frequency and amplitude-frequency characteristics were recorded over frequency range from 0.01 Hz to 105 Hz, and then the spectrum was transferred into Nyquist diagram.
000) and 0.5 mL of ethanol were mixed and ground into the slurry. Then the slurry was evenly coated onto a 2 cm × 1.2 cm F-doped SnO2-coated (FTO) glass electrode by the doctor blade method. The area and the thickness of the coating layer were limited to 1 cm2 and 0.01 mm, respectively. Finally, the prepared electrodes were dried in an oven at 100 °C for 60 min. The measurement of the photocurrent and electrochemical impedance spectroscopy (EIS) were performed on an electrochemical analyzer (CHI660E, Shanghai Chenhua Limited, China) in a standard three-electrode system. In this system, the prepared glass electrodes were used as the working electrodes. Pt wire and Ag/AgCl (saturated 0.3 M KCl) were used as counter electrode and reference electrode, respectively. The three electrodes were connected by the electrolyte of 0.5 M Na2SO4. The source of visible light is a 300 W Xe lamp with a UV cut-off filter (λ > 420 nm). The EIS were tested in the same standard three-electrode system, the phase frequency and amplitude-frequency characteristics were recorded over frequency range from 0.01 Hz to 105 Hz, and then the spectrum was transferred into Nyquist diagram.
Results and discussion
Structure and properties characterization
Fig. 1 shows X-ray diffraction (XRD) patterns of as-prepared samples. The results show that the diffraction peaks of the pure ZnIn2S4, pure In(OH)3 and pure ZnWO4 sample are in good agreement with the hexagonal phase of ZnIn2S4 (JCPDS card No. 03-065-2023), the cubic phase of In(OH)3 (JCPDS card No. 76-1464) and monoclinic structure of ZnWO4 (JCPDS card No. 73-0554), respectively. For the as-prepared ternary ZIZ composites, all the ZnIn2S4 and ZnWO4 diffraction peaks were found. The characteristic peaks of In(OH)3 (22.3°, 31.7° and 51.2°) can also be found. When the pH increases during the synthesis of ZnIn2S4/In(OH)3, the characteristic peak of ZnIn2S4 at 21.4° becomes weaker, while the peak of In(OH)3 at 22.3°, 31.7° and 51.2° become stronger. This demonstrates that the increasing pH value can improve the growth of In(OH)3. No traces of other phases were detected, indicating the high purity of the samples and confirming that ZnIn2S4/In(OH)3 and ZnWO4 coupled together successfully and without other phases.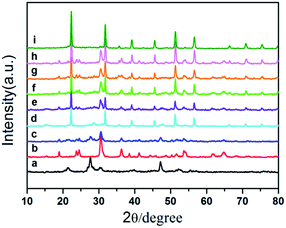 | ||
| Fig. 1 XRD patterns of (a) ZnIn2S4, (b) ZnWO4, (c) ZnIn2S4/ZnWO4, (d) ZnIn2S4/In(OH)3-4.5, (e) ZIZ-3.5, (f) ZIZ-4.5, (g) ZIZ-5.5, (h) In(OH)3/ZnWO4 and (i) In(OH)3. | ||
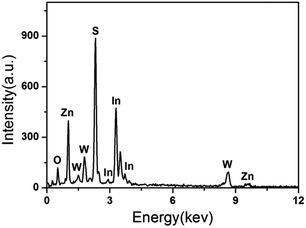
The morphology of the samples was investigated by SEM. Fig. 2a shows the SEM image of the as-prepared ZnIn2S4 at a higher magnification. It is shown that the ZnIn2S4 microsphere has a unique marigold-like spherical superstructure composed of numerous nanosheets. As shown in Fig. 2b, the as-prepared pure In(OH)3 was made up of rectangular blocks with an edge of about 0.7–2 μm. It is also clearly seen that some small nanoparticles are attached to the edge of rectangular blocks, indicating that In(OH)3 rectangular blocks may be formed by the adsorption of small In(OH)3 nanoparticles via an Oswald ripening mechanism.28 As shown in Fig. 2c, the as-prepared ZnWO4 was composed of nanoparticles with a wide size distribution. Fig. 2d and e show the SEM image of the ZIZ-4.5 nanocomposite. It is clearly observed that In(OH)3 cubic blocks and ZnWO4 nanoparticles were attached to the surface of ZnIn2S4 microspheres. Fig. 2f shows the HRTEM images of as prepared ZIZ-4.5 sample. As shown in Fig. 2f, the fringes of 0.33 nm, 0.29 nm and 0.48 nm correspond to the (102), (220) and (100) plane of ZnIn2S4, In(OH)3 and ZnWO4, respectively.29–31 The EDS spectrum (Fig. 3) of the composite clearly confirms the presence of Zn, In, S, O and W elements. From the above results, it can be seen that ZIZ composites with close contact have been successfully fabricated.
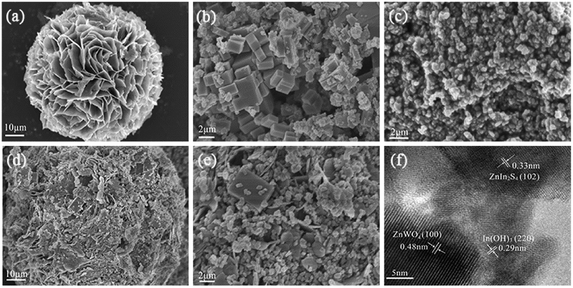 | ||
| Fig. 2 SEM images of (a) ZnIn2S4, (b) In(OH)3, (c) ZnWO4, (d and e) ZIZ-4.5, (f) HRTEM images of ZIZ-4.5. | ||
To characterize the chemical composition of as-prepared ZIZ photocatalyst, X-ray photoelectron spectroscopy (XPS) measurement was used to determine the exact surface state. The XPS survey spectrum confirms that the composite is mainly composed of Zn, In, S, W and O (Fig. 4a). The high-resolution XPS spectra of Zn 2p region of the catalyst was shown in Fig. 4b. The XPS signals of Zn 2p were observed at binding energies at around 1021.9 eV (Zn 2p3/2) and 1044.9 eV (Zn 2p1/2). The high resolution XPS spectra of In 3d region of the catalyst was shown in Fig. 4c. The XPS signals of In 3d were observed at binding energies at around 445.0 eV (In 3d5/2) and 452.6 eV (In 3d3/2), which are in good agreement with the previous works.32 As illustrated in Fig. 4d, the appearance of S 2p3/2 and S 2p1/2 peaks at 161.9 and 163.0 eV can be assigned to the S2− in ZnIn2S4.33 The XPS spectrum in the W 4f region exhibits binding energy at 35.8 eV for W 4f7/2 and 37.9 eV for W 4f5/2 (Fig. 4e), the gap between them is about 2.1 eV, which is close to the value of reference,34 indicating that the W element exhibits in the chemical formation of W6+. The O 1s region can be fitted by three peaks with binding energies of 530.5 eV, 531.5 eV, and 533.5 eV. The peaks at 530.5 eV and 531.5 eV correspond to the lattice oxygen in ZnWO4 and In(OH)3,30,35 respectively. While the peaks at 533.5 eV can be attributed to the oxygen in the adsorbed H2O on the surface of sample. The above results show that the prepared sample is ZIZ.
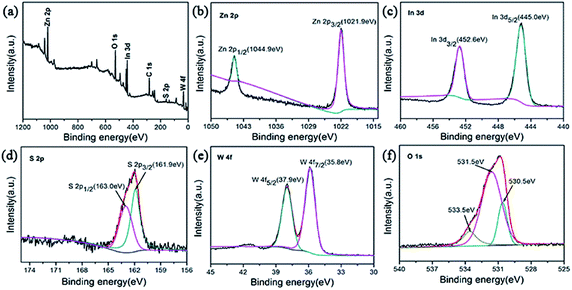 | ||
| Fig. 4 XPS spectra of the ZIZ-4.5 sample: (a) survey, (b) Zn 2p, (c) In 3d, (d) S 2p, (e) W 4f and (f) O 1s. | ||
The nitrogen adsorption–desorption isotherms of ZIZ-4.5, ZnIn2S4, In(OH)3 and ZnWO4 are shown in Fig. 5. The obtained results from the sorption isotherms suggest that all samples exhibit a type IV isotherm with a H3 hysteresis loop according to the IUPAC standard,30,36,37 indicating the existence of a mesoporous structure or slit-like pore. The porous structure parameters of pure ZnIn2S4, In(OH)3, ZnWO4 and ZIZ-4.5 composites are listed in Table 1. The BET surface area (SBET) of the pure ZnIn2S4, In(OH)3, ZnWO4 was 33.730, 13.736, and 11.876 m2 g−1, respectively. The BET surface area of the ZIZ-4.5 nanocomposite was 27.274 m2 g−1, which is lower than that of ZnIn2S4. The reduction of SBET in the ternary sample may be ascribed to the blockage of partial macropores due to the surface covering of In(OH)3 rectangular blocks and ZnWO4 nanoparticles on the bare ZnIn2S4.
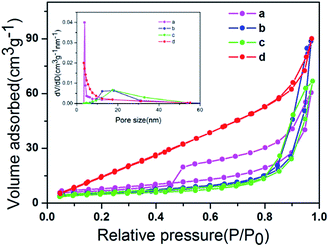 | ||
| Fig. 5 N2 adsorption–desorption isotherms of (a) ZIZ-4.5, (b) ZnIn2S4, (c) In(OH)3 and (d) ZnWO4. The inset is the corresponding BJH pore size distribution plot. | ||
| ZnIn2S4 | In(OH)3 | ZnWO4 | ZIZ-4.5 | |
|---|---|---|---|---|
| BJH pore size (nm) | 3.849 | 17.500 | 18.063 | 3.329 |
| BET surface area (m2 g−1) | 33.730 | 13.736 | 11.876 | 27.274 |
| Pore volume (cm3 g−1) | 0.205 | 0.142 | 0.109 | 0.123 |
The optical absorption properties of as-prepared samples were evaluated by UV-vis diffuse reflection spectra (DRS) measurement (Fig. S1a†). The pristine ZnWO4 showed a narrowed light absorption edge of no more than 380 nm, due to its intrinsic wide band gap.38 The pure In(OH)3 has weak absorption ability, with an absorption edge of ca. 250 nm.24 The pure ZnIn2S4 has a strong absorption in the wavelength ranging from 200 to 550 nm.39 The introduction of ZnIn2S4 increases the light absorption of composite materials in the range of the visible light region. ZIZ-4.5 composite has a strong absorption both in the UV region and visible light region (Fig. S1a†).
The energy level and band gap of the semiconductors play a crucial role in determining their physical properties. The band gap energy of a semiconductor can be calculated by the following formula:
| αhν = A(hν − Eg)n/2 | (1) |
The valence band edge potential and the conduction band edge potential of a semiconductor material can be determined by using the following equation:45,46
| EVB = X − Ee + 0.5Eg | (2) |
| ECB = EVB − Eg | (3) |
Photocatalytic activities
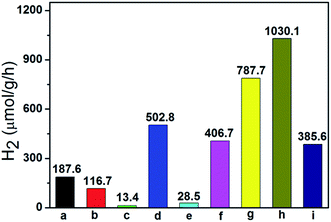
Photocatalytic H2 production experiments were carried out over these as-prepared photocatalysts in the presence of Na2SO3 and Na2S as the sacrificial reagents under visible light irradiation (λ > 420 nm).48 As shown in Fig. 6, pure ZnWO4 (116.7 μmol g−1 h−1), pure In(OH)3 (13.4 μmol g−1 h−1) and pure ZnIn2S4 (187.6 μmol g−1 h−1) show their low photocatalytic activity, respectively. The ternary ZnIn2S4/In(OH)3/ZnWO4 (ZIZ) nanocomposite exhibited enhanced photocatalytic H2 evolution activity as compared to all the related pure samples and binary composite photocatalysts. Especially, ZIZ-4.5 shows the highest photocatalytic activity with a H2 evolution rate of 1030.1 μmol g−1 h−1, which was 8.83 times higher than that of ZnWO4 alone. Moreover, the apparent quantum efficiency (QE) for H2 evolution was examined at 420 nm to further evaluate the photocatalytic activity of ZIZ-4.5. The corresponding QE reached 8.1%, which indicated that the ZIZ-4.5 is a highly-efficient photocatalyst for hydrogen evolution under visible light irradiation. A further increase of pH value will lead to a significant reduction of the photocatalytic H2-evolution rate. With increasing pH value, more ZnIn2S4 transformed into In(OH)3 through the hydrolysis reaction of In3+ ions, which is evidenced from the XRD measurements (Fig. 1e–g). Excessive amount of In(OH)3 particles may cover the active sites on the surface of composite, shield the incident light and act as charge recombination centers.49 In addition, the decrease of ZnIn2S4 can result in the reduction of the utilization of visible light, leading to the decrease of hydrogen production activity.To confirm the stability of our composite catalysts, we performed four consecutive hydrogen evolution runs over ZIZ-4.5 under the same conditions (Fig. S2†).50 Each cycle was performed under visible light irradiation for 3 h. After each run, the reaction system was re-evacuated. The H2 evolution rate after the fourth cycle can keep ca. 91% of the initial rate. This decrease of the H2 evolution rate from 3090 to 2805 μmol g−1 after four cycles could be attributed to the continuous consumption of Na2S and Na2SO3.51 The above results indicate that the prepared ZIZ-4.5 composite has good stability during photocatalytic reactions.
Possible mechanism of photocatalytic H2 evolution
A schematic illustration of the tentative mechanism proposed for the high H2 production activity of the ternary ZIZ composite is shown in Fig. 7. Under visible light illumination, ZnIn2S4 with narrow bandgap energy (2.50 eV in this work) can be easily excited and generate electrons and holes. Normally, these photogenerated electrons and holes recombine rapidly, resulting in a poor H2 evolution activity of pure ZnIn2S4. However, in the ternary ZIZ composite system, since the CB of ZnIn2S4 (−0.93 eV) is more negative than that of In(OH)3 (−0.84 eV) and ZnWO4 (−0.87 eV), the photogenerated electrons in the CB of ZnIn2S4 are transferred to the CB of In(OH)3 and ZnWO4 (Fig. 7), where the electrons can effectively reduce H+ and produce H2 molecules.52 Meanwhile, holes accumulated at the VB of ZnIn2S4 could be consumed by the sacrificial agent (S2−, SO32−).53 Owning to the close contact of ZIZ composite, photo-generated electron can be transferred quickly, so as to extend the charge carriers lifetime and reduce the recombination of electron–hole pairs. Consequently, the high photocatalytic H2-production activity is achieved over the ternary ZIZ composite.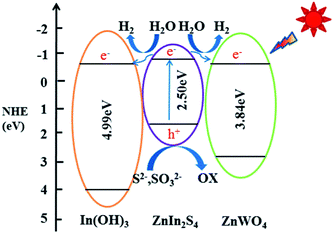 | ||
| Fig. 7 Possible mechanism of the photocatalytic H2-production activity of the ternary ZIZ nanocomposite under visible-light irradiation. | ||
The charge recombination and transfer can be investigated by photoluminescence (PL) spectra. It can also help understanding the fate of photogenerated electrons and holes in semiconductor because PL emission results from the recombination of free carriers.54 The PL spectra of ZIZ-4.5, ZnIn2S4, In(OH)3 and ZnWO4 samples were recorded at room temperature with an excitation wavelength of 215 nm (Fig. S3†). It can be observed that the bare ZnIn2S4 shows a strong peak at about 550 nm, which can be attributed to the direct recombination of the photo-generated electron–hole pairs in ZnIn2S4 nanocrystals. When introducing both ZnWO4 and an optimum concentration of In(OH)3 content, ZIZ nanocomposite exhibited much lower PL emission peak at about 470 nm. The results implied that ZIZ has remarkably enhanced separation efficiency of photo-induced electron–hole pairs, which is qualitatively in good agreement with the trend in photo-activity enhancement.
To further deeply understand the photocatalytic enhancement mechanism for H2 evolution, the transfer and separation of photo-generated charge carriers were also investigated through the photoelectrochemical (PEC) analysis. The transient photocurrent responses of ZnIn2S4, In(OH)3, ZnWO4 and ZIZ-4.5 with typical on–off cycles of intermittent irradiation were measured (Fig. S4a†). Notably, the photocurrent of ZIZ-4.5 sample is much higher than the other samples, confirming the more efficient interfacial mobility and separation of photo-generated electron–hole pairs for the ZIZ-4.5 composite sample. In addition, the electrochemical impedance spectroscopy (EIS) has also been investigated to provide sufficient evidence for the interfacial charge transfer resistance and separation efficiency. The electrochemical impedance spectroscopy (EIS) of these four samples were shown (Fig. S4b†). It is observed that the arc radius in the Nyquist plots of ZIZ-4.5 is much smaller than those of ZnIn2S4, In(OH)3 and ZnWO4, indicating that a more effective separation of photogenerated electron–hole pairs and a faster interfacial charge transfer had occurred on the surface of ZIZ composite. The PL and PEC analysis results are in good accordance with the photocatalytic-activity measurements, which further confirm that introducing ZnIn2S4/In(OH)3 system is an effective way to improve the photocatalytic efficiency of ZnWO4.
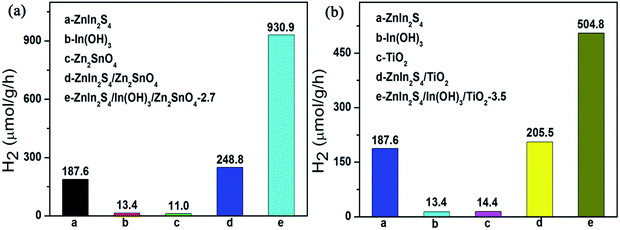
Although the results here obtained certainly open up the possibility to design a noble-metal-free photocatalyst for water splitting, the deposition of the ZnIn2S4/In(OH)3 cocatalyst on other semiconductor is certainly required. As shown in Fig. 8, the photocatalytic H2-production activity of Zn2SnO4 and TiO2 were both tremendously improved by loading the specified amount of ZnIn2S4/In(OH)3 as cocatalyst. It is expected that the combination of ZnIn2S4 and In(OH)3 as a new class of earth-abundant cocatalyst can become a general strategy to improve the H2-evolution activity over various kinds of conventional semiconductors.
Conclusions
In conclusion, the combination of ZnIn2S4 with In(OH)3 formed a new class of earth-abundant cocatalyst for water-splitting under visible light irradiation, which greatly advanced the photocatalytic activity of ZnWO4 promoted by synergetic effects. The roles of ZnIn2S4 and In(OH)3 in boosting the H2 evolution activity of ZnWO4 were revealed. This work could not only provide an excellent candidate for visible-light H2 evolution, but also opens new possibilities to provide insight into the design of new system with high activity for solar hydrogen generation.Conflicts of interest
There are no conflicts to declare.Acknowledgements
We greatly appreciate the support of the National Natural Science Foundation of China (No. 21272054 and 21502040), Natural Science Foundation of Hebei Province (B2016205249 and B2016205211), Science and Technology Research Fund of the Education Department of Hebei Province (No. ZD2015030) and the Startup Foundation of Hebei Normal University (No. L2015B08, L2015B09, L2015k02, L2016Z01).Notes and references
- X. Zhou, J. Jin, X. Zhu, J. Huang, J. Yu, W.-Y. Wong and W.-K. Wong, J. Mater. Chem. A, 2016, 4, 5282–5287 CAS.
- D. Lang, F. Cheng and Q. Xiang, Catal. Sci. Technol., 2016, 6, 6207–6216 CAS.
- Q. Wang, N. An, Y. Bai, H. Hang, J. Li, X. Lu, Y. Liu, F. Wang, Z. Li and Z. Lei, Int. J. Hydrogen Energy, 2013, 38, 10739–10745 CrossRef CAS.
- X. Fang, J. Song, H. Shi, S. Kang, Y. Li, G. Sun and L. Cui, Int. J. Hydrogen Energy, 2017, 42, 5741–5748 CrossRef CAS.
- C.-J. Chang, H.-T. Weng and C.-C. Chang, Int. J. Hydrogen Energy, 2017, 42, 23568–23577 CrossRef CAS.
- G. Bi, J. Wen, X. Li, W. Liu, J. Xie, Y. Fanga and W. Zhang, RSC Adv., 2016, 6, 31497–31506 RSC.
- F. Cheng, H. Yin and Q. Xiang, Appl. Surf. Sci., 2017, 391, 432–439 CrossRef CAS.
- Q. Wang, G. Yun, Y. Bai, N. An, Y. Chen, R. Wang, Z. Lei and W. Shangguan, Int. J. Hydrogen Energy, 2014, 39, 13421–13428 CrossRef CAS.
- J. Ran, J. Zhang, J. Yu, M. Jaroniec and S. Z. Qiao, Chem. Soc. Rev., 2014, 43, 7787–7812 RSC.
- V. J. Babu, S. Vempati, T. Uyar and S. Ramakrishn, Phys. Chem. Chem. Phys., 2015, 17, 2960–2986 RSC.
- S. J. A. Moniz, S. A. Shevlin, D. J. Martin, Z.-X. Guo and J. Tang, Energy Environ. Sci., 2015, 8, 731–759 CAS.
- B. Chai, T. Peng, P. Zeng, X. Zhang and X. Liu, J. Phys. Chem. C, 2011, 115, 6149–6155 CAS.
- Y. Gao, H. Lin, S. Zhang and Z. Li, RSC Adv., 2016, 6, 6072–6076 RSC.
- Y. Yu, G. Chen, G. Wang and Z. Lv, Int. J. Hydrogen Energy, 2013, 38, 1278–1285 CrossRef CAS.
- M. Sun, X. Zhao, Q. Zeng, T. Yan, P. Ji, T. Wu, D. Wei and B. Du, Appl. Surf. Sci., 2017, 407, 328–336 CrossRef CAS.
- W. Cui, D. Guo, L. Liu, J. Hu, D. Rana and Y. Liang, Catal. Commun., 2014, 48, 55–59 CrossRef CAS.
- Y. Li, J. Wang, S. Peng, G. Lu and S. Li, Int. J. Hydrogen Energy, 2010, 35, 7116–7126 CrossRef CAS.
- Y. Chen, J. He, J. Li, M. Mao, Z. Yan, W. Wang and J. Wang, Catal. Commun., 2016, 87, 1–5 CrossRef CAS.
- G. Chen, N. Ding, F. Li, Y. Fan, Y. Luo, D. Li and Q. Meng, Appl. Catal., B, 2014, 160, 614–620 CrossRef.
- N. S. Chaudhari, A. P. Bhirud, R. S. Sonawane, L. K. Nikam, S. S. Warule, V. H. Rane and B. B. Kale, Green Chem., 2011, 13, 2500–2506 RSC.
- L. Shang, C. Zhou, T. Bian, H. Yu, L.-Z. Wu, C.-H. Tung and T. Zhang, J. Mater. Chem. A, 2013, 1, 4552–4558 CAS.
- Y. Gu, Z. Xu, L. Guo and Y. Wan, CrystEngComm, 2014, 16, 10997–11006 RSC.
- J. Liu, G. Chen, Y. Yu, Y. Wu, M. Zhou, W. Zhang, H. Qin, C. Lv and W. Fu, New J. Chem., 2015, 39, 1930–1937 RSC.
- J. Guo, S. Ouyang, H. Zhou, T. Kako and J. Ye, J. Phys. Chem. C, 2013, 117, 17716–17724 CAS.
- S. Chen, X. Yu, H. Zhang and W. Liu, J. Hazard. Mater., 2010, 180, 735–740 CrossRef CAS PubMed.
- T. Yan, H. Liu, M. Sun, X. Wang, M. Li, Q. Yan, W. Xu and B. Du, RSC Adv., 2015, 5, 10688–10696 RSC.
- M. A. Mahadik, P. S. Shinde, M. Cho and J. S. Jang, J. Mater. Chem. A, 2015, 3, 23597–23606 CAS.
- S.-T. Jean and Y.-C. Her, CrystEngComm, 2011, 13, 2324–2330 RSC.
- L. Su, X. Ye, S. Meng, X. Fu and S. Chen, Appl. Surf. Sci., 2016, 384, 161–174 CrossRef CAS.
- L. Xu, C. Wang, X. Zhang, D. Guo, Q. Pan, G. Zhang and S. Wang, Sens. Actuators, B, 2017, 245, 533–540 CrossRef CAS.
- A. Phuruangrat, P. Dumrongrojthanath, S. Thongtem and T. Thongtem, Mater. Lett., 2016, 166, 183–187 CrossRef CAS.
- Y. Xia, Q. Li, K. Lv, D. Tang and M. Li, Appl. Catal., B, 2017, 206, 344–352 CrossRef CAS.
- Y.-J. Yuan, J.-R. Tu, Z.-J. Ye, D.-Q. Chen, B. Hu, Y.-W. Huang, T.-T. Chen, D.-P. Cao, Z.-T. Yu and Z.-G. Zou, Appl. Catal., B, 2016, 188, 13–22 CrossRef CAS.
- J. Bi, L. Wu, Z. Li, Z. Ding, X. Wang and X. Fu, J. Alloys Compd., 2009, 480, 684–688 CrossRef CAS.
- C. Li, Y. Liang, J. Mao, L. Ling, Z. Cui, X. Yang, S. Zhu and Z. Li, Anal. Chim. Acta, 2016, 927, 107–116 CrossRef CAS PubMed.
- W. Yang, D. Chen, H. Quan, S. Wu, X. Luo and L. Guo, RSC Adv., 2016, 6, 83012–83019 RSC.
- Q. Wang, Y. Shi, T. Niu, J. He, H. She and B. Su, J. Sol-Gel Sci. Technol., 2017, 83, 555–566 CrossRef CAS.
- M. Hojamberdiev, K.-I. Katsumata, K. Morita, S. A. Bilmes, N. Matsushita and K. Okada, Appl. Catal., A, 2013, 457, 12–20 CrossRef CAS.
- Q. Li, C. Cui, H. Meng and J. Yu, Chem.–Asian J., 2014, 9, 1766–1770 CrossRef CAS PubMed.
- H. Liu, Z. Jin, Z. Xu, Z. Zhang and D. Ao, RSC Adv., 2015, 5, 97951–97961 RSC.
- N. Tian, H. Huang, Y. Zhang and Y. He, J. Mater. Res., 2014, 39, 641–648 CrossRef.
- M. Bonanni, L. Spanhel, M. Lerch, E. Füglein, G. Müller and F. Jermann, Chem. Mater., 1998, 10, 304–310 CrossRef CAS.
- M. Muruganandham, M. E. T. Sillanpää, R. P. S. Suri, G.-J. Lee, J. J. Wu, B. Ahmad and Y. Kuroda, J. Nanosci. Nanotechnol., 2013, 13, 1639–1648 CrossRef CAS PubMed.
- D. Li, J. Xue and X. Bai, CrystEngComm, 2016, 18, 309–315 RSC.
- X. Yang, W. Xin, X. Yin and X. Shao, Chem. Phys. Lett., 2016, 651, 127–132 CrossRef CAS.
- L. K. Putri, W. J. Ong, W. S. Chang and S. P. Chai, Catal. Sci. Technol., 2016, 6, 744–754 CAS.
- J. Hou, C. Yang, H. Cheng, Z. Wang, S. Jiao and H. Zhu, Phys. Chem. Chem. Phys., 2013, 15, 15660–15668 RSC.
- Q. Xiang, F. Cheng and D. Lang, ChemSusChem, 2016, 9, 996–1002 CrossRef CAS PubMed.
- X. Wang, Z. Feng, D. Fan, F. Fan and C. Li, Cryst. Growth Des., 2010, 10, 5312–5318 CAS.
- L. Korösi, M. Prato, A. Scarpellini, J. Kovács, D. Dömötör, T. Kovács and S. Papp, Appl. Surf. Sci., 2016, 365, 171–179 CrossRef.
- S. A. Bakar and C. Ribeiro, Appl. Surf. Sci., 2016, 377, 121–133 CrossRef CAS.
- J. W. Grebinski, K. L. Hull, J. Zhang, T. H. Kosel and M. Kuno, Chem. Mater., 2004, 16, 5260–5272 CrossRef CAS.
- D. Lang, F. Cheng and Q. Xiang, Catal. Sci. Technol., 2016, 6, 6207–6216 CAS.
- J. Zhang, L. Qi, J. Ran, J. Yu and S. Z. Qiao, Adv. Energy Mater., 2014, 4, 1301925–1301930 CrossRef.
Footnote |
| † Electronic supplementary information (ESI) available: UV-vis image, cyclic H2 production image, PL spectra, and PEC analysis image. See DOI: 10.1039/c7ra12586k |
| This journal is © The Royal Society of Chemistry 2018 |


