 Open Access Article
Creative Commons Attribution 3.0 Unported Licence
Fe–Mn bimetallic oxides-catalyzed oxygen reduction reaction in alkaline direct methanol fuel cells
Yuan Fang a,
Yonghui Wanga,
Fen Wang*a,
Chengyong Shub,
Jianfeng Zhua and
Wenling Wua
aSchool of Materials Science and Engineering, Shaanxi University of Science and Technology, Xi'an 710021, P. R. China. E-mail: wangf@sust.edu.cn
bState Key Laboratory for Mechanical Behavior of Materials, Xi'an Jiaotong University, Xi'an 710049, P. R. China
First published on 26th February 2018
Abstract
Two Fe–Mn bimetallic oxides were synthesized through a facile solvothermal method without using any templates. Fe2O3/Mn2O3 is made up of Fe2O3 and Mn2O3 as confirmed via XRD. TEM and HRTEM observations show Fe2O3 nanoparticles uniformly dispersed on the Mn2O3 substrate and a distinct heterojunction boundary between Fe2O3 nanoparticles and Mn2O3 substrate. MnFe2O4 as a pure phase sample was also prepared and investigated in this study. The current densities in CV tests were normalized to their corresponding surface area to exclude the effect of their specific surface area. Direct methanol fuel cells (DMFCs) were equipped with bimetallic oxides as cathode catalyst, PtRu/C as the anode catalyst and PFM as the electrolyte film. CV and DMFC tests show that Fe2O3/Mn2O3(3![[thin space (1/6-em)]](https://www.rsc.org/images/entities/char_2009.gif) :
:![[thin space (1/6-em)]](https://www.rsc.org/images/entities/char_2009.gif) 1) exhibits higher oxygen reduction reaction (ORR) activity than Fe2O3/Mn2O3(1
1) exhibits higher oxygen reduction reaction (ORR) activity than Fe2O3/Mn2O3(1![[thin space (1/6-em)]](https://www.rsc.org/images/entities/char_2009.gif) :
:![[thin space (1/6-em)]](https://www.rsc.org/images/entities/char_2009.gif) 1), Fe2O3/Mn2O3(1
1), Fe2O3/Mn2O3(1![[thin space (1/6-em)]](https://www.rsc.org/images/entities/char_2009.gif) :
:![[thin space (1/6-em)]](https://www.rsc.org/images/entities/char_2009.gif) 3), Fe2O3/Mn2O3(5
3), Fe2O3/Mn2O3(5![[thin space (1/6-em)]](https://www.rsc.org/images/entities/char_2009.gif) :
:![[thin space (1/6-em)]](https://www.rsc.org/images/entities/char_2009.gif) 1) and MnFe2O4. The much superior catalytic performance is due to its larger surface area, the existence of numerous heterojunction interfaces and the synergistic effect between Fe2O3 and Mn2O3, which can provide numerous catalytic active sites, accelerate mass transfer, and increase ORR efficiency.
1) and MnFe2O4. The much superior catalytic performance is due to its larger surface area, the existence of numerous heterojunction interfaces and the synergistic effect between Fe2O3 and Mn2O3, which can provide numerous catalytic active sites, accelerate mass transfer, and increase ORR efficiency.
1. Introduction
The rapid depletion of fossil fuel and the increase in environmental pollution have driven us to search for sustainable and clean energy resources. Fuel cells have been considered promising power sources owing to their advantage of transforming chemical energy directly into electrical energy.1 At present, direct methanol fuel cells (DMFCs) are obtaining great attention in virtue of their high energy density, environment friendliness and comparatively lower operating temperature.2–5 Furthermore, methanol is convenient and safe for transport and storage, swift to refuel and available at a low price.6 At present, DMFCs have great potential application as a portable power supply or electric vehicle power supply. Nevertheless, the inertial oxygen reduction reaction (ORR) and methanol oxidation reaction (MOR) dynamics and the high cost of noble-based catalysts and proton exchange membrane (PEM) hinder the commercial application of DMFCs.4,7,8Recently, polymer fiber membranes (PFMs) have been demonstrated to be an excellent alternative to PEMs for higher performance liquid fuel cells at a reduced cost in our previous study.9,10 The fibers in PFMs are neutral and possess pores and gaps, which allow molecules, ions, and liquid fuel to transport or move through the PFM freely. Consequently, the cathode catalysts should have both outstanding tolerance for methanol poisoning and excellent stability. The widely used cathode catalysts are Pt or Pt-based metal alloy catalysts, such as Pt–Co,11 Pt–Pd,4 Pt–Ni,12 and Pt–Fe.13 However, these catalysts have both ORR and MOR catalytic activity, leading to a mixed potential at the cathode and poisoning by methanol. In terms of lower cost, a variety of non-Pt catalysts, such as Ru–Se,14 Pd–Ni,15 Pd–Fe,16 Co–Se,17 Fe–N–C,18 Cu–Fe–S,19 and Co–O,20 which display ORR catalytic activity and better methanol tolerance than Pt-based catalysts, also have been researched.
Among them, transition metal (Fe, Co, Ni, Mn, etc.) oxides have gained increasing interest as ORR catalysts in virtue of their high activity, low cost and environmental friendliness.21 In recent years, numerous studies have focused on binary and ternary metal oxides because of their good synergistic effects and good cycle stability. NiCo2O4,22 KMn8O16,23 MnFe2O4,24 and Co–Ni–Te–O25 have higher ORR catalytic activities and methanol tolerance. For example, the catalytic activity of MnFe2O4 is higher than that of Fe2O3 (ref. 26) and Mn2O3.27 Nevertheless, the catalytic activity of the mixed compound of Fe2O3 and Mn2O3 has not been discussed.
In this study, we prepared two Fe–Mn bimetallic oxides, namely, Fe2O3/Mn2O3 and MnFe2O4 by a simple solvothermal method. Fe2O3/Mn2O3 is made up of Fe2O3 and Mn2O3 as confirmed via XRD. MnFe2O4 is a pure phase sample. The as-prepared Fe2O3/Mn2O3 exists in the form of porous nanosheets-self-assembled globular structure. The microspheres are 3–4 μm in diameter and the pore size is about 30 nm. The TEM and HRTEM images show Fe2O3 nanoparticles uniformly dispersed on the Mn2O3 substrate and a distinct heterojunction boundary between Fe2O3 nanoparticles and Mn2O3 substrate. MnFe2O4 has a hierarchical structure, in which the nanoparticles are 20–30 nm in diameter and create self-assembled globular shapes with diameters of 300–500 nm. The alkaline DMFCs were assembled using Fe2O3/Mn2O3 or MnFe2O4 as cathode catalyst, PtRu/C as anode catalyst, and PFM instead of PEM. CV and DMFC performance tests indicate that the ORR catalytic activity of Fe2O3/Mn2O3 is superior to that of MnFe2O4.
2. Experimental section
2.1 Synthesis of Fe2O3/Mn2O3 and MnFe2O4 catalysts
All reagents were analytical grade and used without further purification. All the reagents were purchased from Sinopharm Chemical Reagent Co. Ltd. The anode catalyst PtRu/C (HiSpec 3000) was bought from Johnson Matthey (UK). Multiwalled carbon nanotubes (TNM7, >95%, OD: 30–50 nm, length: 10–20 mm) were obtained from Chengdu Organic Chemicals Co. Ltd (Chengdu, China). They were produced by natural gas catalytic decomposition over a nickel-based catalyst and purified with dilute hydrochloric acid at 80 °C. The PFM (thickness 1/4 159.3 μm) was purchased from the Nippon Kodoshi Corporation.In the synthesis of Fe2O3/Mn2O3, first, 25 mL ethylene glycol (EG) and 0.14 g Tween 80 were dissolved into 25 mL ultrapure water to form a transparent solution. Then, 3 mmol MnSO4·H2O, 9 mmol Fe(NO3)3·9H2O and 30 mmol urea were added to the solution, which was then magnetically stirred at 25 °C for 1 h, forming a red-brown solution. Next, the solution was put into a 100 mL Teflon-lined stainless-steel autoclave, which was then heated at 200 °C for 24 h with continuous rotation. The precipitate was washed by centrifugation with anhydrous ethanol and ultrapure water several times until the pH was 7 and the precursor of Fe2O3/Mn2O3 was obtained by drying it at 80 °C for 12 h. The resultant product was calcined at 800 °C in air for 5 h in a muffle furnace to obtain the Fe2O3/Mn2O3 sample. Fe2O3/Mn2O3 with different Fe/Mn ratios of 1![[thin space (1/6-em)]](https://www.rsc.org/images/entities/char_2009.gif) :
:![[thin space (1/6-em)]](https://www.rsc.org/images/entities/char_2009.gif) 1, 1
1, 1![[thin space (1/6-em)]](https://www.rsc.org/images/entities/char_2009.gif) :
:![[thin space (1/6-em)]](https://www.rsc.org/images/entities/char_2009.gif) 3, 3
3, 3![[thin space (1/6-em)]](https://www.rsc.org/images/entities/char_2009.gif) :
:![[thin space (1/6-em)]](https://www.rsc.org/images/entities/char_2009.gif) 1 and 5
1 and 5![[thin space (1/6-em)]](https://www.rsc.org/images/entities/char_2009.gif) :
:![[thin space (1/6-em)]](https://www.rsc.org/images/entities/char_2009.gif) 1 were prepared for comparison, which were controlled by altering the molar ratio of MnSO4·H2O and Fe(NO3)3·9H2O. The samples were designated as Fe2O3/Mn2O3(1
1 were prepared for comparison, which were controlled by altering the molar ratio of MnSO4·H2O and Fe(NO3)3·9H2O. The samples were designated as Fe2O3/Mn2O3(1![[thin space (1/6-em)]](https://www.rsc.org/images/entities/char_2009.gif) :
:![[thin space (1/6-em)]](https://www.rsc.org/images/entities/char_2009.gif) 1), Fe2O3/Mn2O3(1
1), Fe2O3/Mn2O3(1![[thin space (1/6-em)]](https://www.rsc.org/images/entities/char_2009.gif) :
:![[thin space (1/6-em)]](https://www.rsc.org/images/entities/char_2009.gif) 3), Fe2O3/Mn2O3(3
3), Fe2O3/Mn2O3(3![[thin space (1/6-em)]](https://www.rsc.org/images/entities/char_2009.gif) :
:![[thin space (1/6-em)]](https://www.rsc.org/images/entities/char_2009.gif) 1) and Fe2O3/Mn2O3(5
1) and Fe2O3/Mn2O3(5![[thin space (1/6-em)]](https://www.rsc.org/images/entities/char_2009.gif) :
:![[thin space (1/6-em)]](https://www.rsc.org/images/entities/char_2009.gif) 1), respectively.
1), respectively.
The precursor of MnFe2O4 was synthesized following the same solvothermal method except the raw materials were 2.5 mmol Mn(CH3COO)2·4H2O, 5.0 mmol FeCl3·6H2O, 1.0 g polyethylene glycol (PEG), 3.6 g CH3COONa and 40 mL ethylene glycol (EG). The MnFe2O4 catalyst sample was obtained after calcination at 500 °C in air for 4 h.
2.2 Materials characterization
The structures and compositions of the as-prepared Fe2O3/Mn2O3 and MnFe2O4 were characterized via X-ray diffraction (XRD, D/Max 2200PC, Japan) and high-resolution TEM (HRTEM). The morphological properties were characterized by field emission scanning electron microscopy (FESEM, Hitachi S-4800, Japan) and transmission electron microscopy (TEM, FEI company Tecnai G2 F20) equipped with energy-dispersive spectrometer (EDS). The Brunauer–Emmett–Teller (BET) method was carried out to determine the pore volumes, pore size and the specific surface area distribution of the samples using a surface area and porosimetry system (ASAP 2460, Micromeritics Instrument Corporation, USA). X-ray photoelectron spectroscopy (XPS) measurements (VG Thermo ESCALAB 250 spectrometer) were used to quantitatively analyze the chemical compositions of samples.2.3 Electrochemical measurements
Cyclic voltammetry (CV) and electrochemical impedance spectroscopy (EIS) were measured using an electrochemical workstation (CHI 660E, Chenhua Instruments, Shanghai, China). A standard three-electrode system consisted of the catalyst-modified glassy carbon electrode as the working electrode, Hg/HgO electrode as the reference electrode and the Pt network as the counter electrode. The glassy carbon electrode was modified as follows: 4 mg catalyst, 1 mg CNTs, 0.2 mL distilled water, 0.5 mL absolute ethyl alcohol and 50 μL Nafion solution (5 wt%) were ultrasonically dispersed into a homogeneous suspension for about 1 h; then, the suspension was poured on the glassy carbon electrode surface and dried at room temperature.2.4 Electrode preparation and DMFC measurements
The cathode electrode was a sandwich structure, including catalyst layer, current accumulating matrix and gas diffusion layer. The gas diffusion layer was obtained by mixing 60 wt% acetylene black and 40 wt% polytetrafluoroethylene (PTFE, 30 wt% solution) with ethanol under ultrasonication and pressing the slurry into a thin layer of 0.3–0.5 mm and then treating at 350 °C for 1 h. The catalyst layer was obtained first through mixing 24 mg catalyst, 6 mg CNTs and 6.7 mg 30 wt% PTFE solution into slurry with addition of a certain amount of absolute ethanol; the slurry was pasted on nickel foam (porosity > 95%) and then dried at 80 °C for 2 h. Finally, the cathode was obtained by pressing the catalyst layer on nickel foam and the gas diffusion layer under 2 MPa.The anode was obtained via mixing PtRu/C (60 wt%) and Nafion solution (5 wt%) at a mass ratio of 1![[thin space (1/6-em)]](https://www.rsc.org/images/entities/char_2009.gif) :
:![[thin space (1/6-em)]](https://www.rsc.org/images/entities/char_2009.gif) 1. The anode preparation process is consistent with that of the cathode without the gas diffusion layer. The loading of PtRu/C was 5 mg cm−2.
1. The anode preparation process is consistent with that of the cathode without the gas diffusion layer. The loading of PtRu/C was 5 mg cm−2.
The cathode, PFM and anode were assembled into a fuel cell. At the cathode, the oxygen flow rate was 20 cubic centimeters per minute; the anode aqueous solution was 4 M KOH and 5 M methanol. The structure of PFM-DMFCs was introduced and described in our previous study.9 A battery testing system (Neware Technology Co., Ltd., Shenzhen, China) was used to measure the performance.
3. Results and discussion
3.1 Structural and morphological characterization
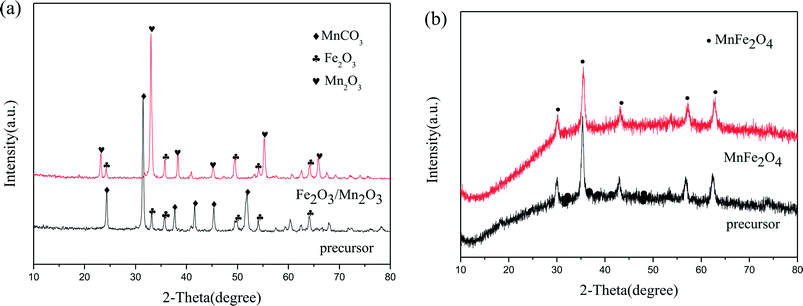
Fig. 1 displays the XRD patterns of Fe2O3/Mn2O3(3![[thin space (1/6-em)]](https://www.rsc.org/images/entities/char_2009.gif) :
:![[thin space (1/6-em)]](https://www.rsc.org/images/entities/char_2009.gif) 1), MnFe2O4 and their precursors. The precursor of Fe2O3/Mn2O3(3
1), MnFe2O4 and their precursors. The precursor of Fe2O3/Mn2O3(3![[thin space (1/6-em)]](https://www.rsc.org/images/entities/char_2009.gif) :
:![[thin space (1/6-em)]](https://www.rsc.org/images/entities/char_2009.gif) 1) can be well indexed to Fe2O3 (JCPDS no. 33-0664) and MnCO3 (JCPDS no. 44-1472). However, the diffraction peaks of Fe2O3/Mn2O3(3
1) can be well indexed to Fe2O3 (JCPDS no. 33-0664) and MnCO3 (JCPDS no. 44-1472). However, the diffraction peaks of Fe2O3/Mn2O3(3![[thin space (1/6-em)]](https://www.rsc.org/images/entities/char_2009.gif) :
:![[thin space (1/6-em)]](https://www.rsc.org/images/entities/char_2009.gif) 1) agree with the standard patterns of Fe2O3 (JCPDS no. 33-0664) and Mn2O3 (JCPDS no. 24-0508). It can be illustrated that Fe2O3/Mn2O3(3
1) agree with the standard patterns of Fe2O3 (JCPDS no. 33-0664) and Mn2O3 (JCPDS no. 24-0508). It can be illustrated that Fe2O3/Mn2O3(3![[thin space (1/6-em)]](https://www.rsc.org/images/entities/char_2009.gif) :
:![[thin space (1/6-em)]](https://www.rsc.org/images/entities/char_2009.gif) 1) is composed of Mn2O3 and Fe2O3 and the formation of Mn2O3 is due to the decomposition of MnCO3 in its precursor. Moreover, the diffraction peaks of MnFe2O4 and its precursor can be well assigned to the standard patterns of MnFe2O4 (JCPDS no. 10-0319).
1) is composed of Mn2O3 and Fe2O3 and the formation of Mn2O3 is due to the decomposition of MnCO3 in its precursor. Moreover, the diffraction peaks of MnFe2O4 and its precursor can be well assigned to the standard patterns of MnFe2O4 (JCPDS no. 10-0319).
FESEM was applied to describe the morphology of Fe2O3/Mn2O3(3![[thin space (1/6-em)]](https://www.rsc.org/images/entities/char_2009.gif) :
:![[thin space (1/6-em)]](https://www.rsc.org/images/entities/char_2009.gif) 1), MnFe2O4 and their precursors. Fig. 2(a) shows that the precursor of Fe2O3/Mn2O3(3
1), MnFe2O4 and their precursors. Fig. 2(a) shows that the precursor of Fe2O3/Mn2O3(3![[thin space (1/6-em)]](https://www.rsc.org/images/entities/char_2009.gif) :
:![[thin space (1/6-em)]](https://www.rsc.org/images/entities/char_2009.gif) 1) exhibits two morphologies, which are nanoparticles and nanostructured bulk, while the Fe2O3/Mn2O3(3
1) exhibits two morphologies, which are nanoparticles and nanostructured bulk, while the Fe2O3/Mn2O3(3![[thin space (1/6-em)]](https://www.rsc.org/images/entities/char_2009.gif) :
:![[thin space (1/6-em)]](https://www.rsc.org/images/entities/char_2009.gif) 1) catalyst exists as sub-sized porous nanosheets-self-assembled globular structure (Fig. 2(b)). The microspheres of Fe2O3/Mn2O3(3
1) catalyst exists as sub-sized porous nanosheets-self-assembled globular structure (Fig. 2(b)). The microspheres of Fe2O3/Mn2O3(3![[thin space (1/6-em)]](https://www.rsc.org/images/entities/char_2009.gif) :
:![[thin space (1/6-em)]](https://www.rsc.org/images/entities/char_2009.gif) 1) are 3–4 μm in diameter and the pore size is about 30 nm. From the XRD analysis results shown in Fig. 1(a), it can be inferred that the formation of nanopores is due to the release of CO2, which comes from MnCO3 decomposition during the calcination process. In particular, mesoporous structure is profitable for the rapid transmission of O2, fuel and electrolyte, which can accelerate the redox reaction rate and improve electrochemical performance.28 Further, the EDS elemental mappings of Fe2O3/Mn2O3(3
1) are 3–4 μm in diameter and the pore size is about 30 nm. From the XRD analysis results shown in Fig. 1(a), it can be inferred that the formation of nanopores is due to the release of CO2, which comes from MnCO3 decomposition during the calcination process. In particular, mesoporous structure is profitable for the rapid transmission of O2, fuel and electrolyte, which can accelerate the redox reaction rate and improve electrochemical performance.28 Further, the EDS elemental mappings of Fe2O3/Mn2O3(3![[thin space (1/6-em)]](https://www.rsc.org/images/entities/char_2009.gif) :
:![[thin space (1/6-em)]](https://www.rsc.org/images/entities/char_2009.gif) 1) (Fig. 2(c)–(f)) were recorded to obtain elemental distribution of Fe, Mn and O in the structure and it could be observed that the three elements are distributed homogeneously. As shown in Fig. 3(a) and (b), MnFe2O4 catalyst and its precursor have similar hierarchical structures. The nanoparticles are 20–30 nm in diameter and exhibit self-assembled globular shapes with diameters of 300–500 nm. Moreover, the EDS elemental mapping of MnFe2O4 clearly indicates that the Fe, Mn and O elements are uniformly distributed (Fig. 3(c)–(f)).
1) (Fig. 2(c)–(f)) were recorded to obtain elemental distribution of Fe, Mn and O in the structure and it could be observed that the three elements are distributed homogeneously. As shown in Fig. 3(a) and (b), MnFe2O4 catalyst and its precursor have similar hierarchical structures. The nanoparticles are 20–30 nm in diameter and exhibit self-assembled globular shapes with diameters of 300–500 nm. Moreover, the EDS elemental mapping of MnFe2O4 clearly indicates that the Fe, Mn and O elements are uniformly distributed (Fig. 3(c)–(f)).
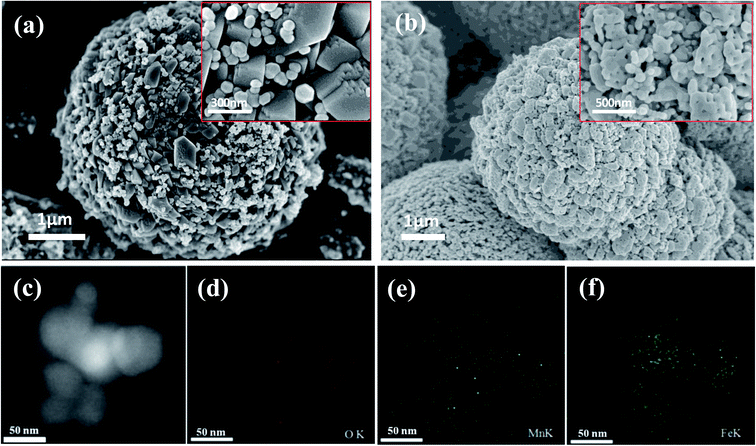 | ||
Fig. 2 FESEM images of (a) the precursor of Fe2O3/Mn2O3(3![[thin space (1/6-em)]](https://www.rsc.org/images/entities/char_2009.gif) : :![[thin space (1/6-em)]](https://www.rsc.org/images/entities/char_2009.gif) 1) and (b) Fe2O3/Mn2O3(3 1) and (b) Fe2O3/Mn2O3(3![[thin space (1/6-em)]](https://www.rsc.org/images/entities/char_2009.gif) : :![[thin space (1/6-em)]](https://www.rsc.org/images/entities/char_2009.gif) 1); EDS elemental mapping images of Fe2O3/Mn2O3 ((c) to (f)). 1); EDS elemental mapping images of Fe2O3/Mn2O3 ((c) to (f)). | ||
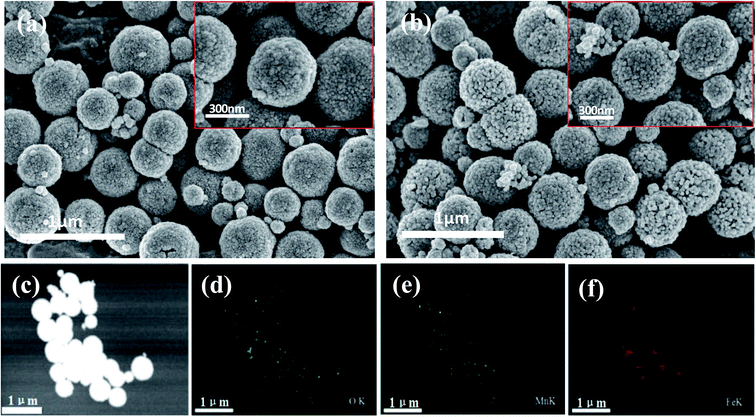 | ||
| Fig. 3 FESEM images of (a) the precursor of MnFe2O4 and (b) MnFe2O4 catalyst; EDS elemental mapping images of MnFe2O4 catalyst ((c) to (f)). | ||
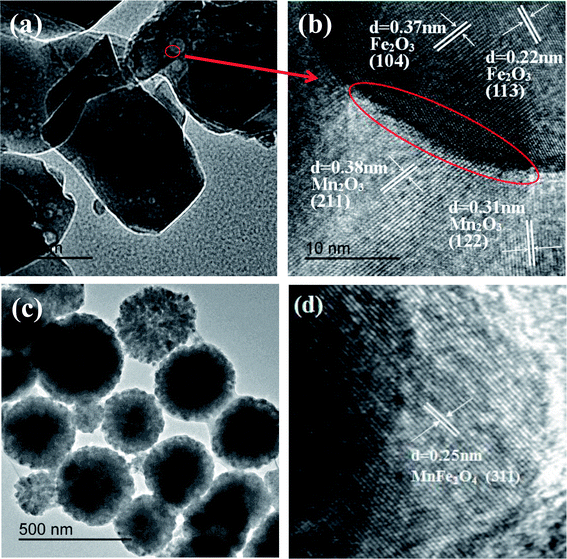
The TEM image of Fe2O3/Mn2O3(3![[thin space (1/6-em)]](https://www.rsc.org/images/entities/char_2009.gif) :
:![[thin space (1/6-em)]](https://www.rsc.org/images/entities/char_2009.gif) 1) (Fig. 4(a)) shows that numerous nanoparticles with diameters of 10–30 nm are uniformly dispersed on the substrate. To better characterize the microstructure, a HRTEM image of Fe2O3/Mn2O3(3
1) (Fig. 4(a)) shows that numerous nanoparticles with diameters of 10–30 nm are uniformly dispersed on the substrate. To better characterize the microstructure, a HRTEM image of Fe2O3/Mn2O3(3![[thin space (1/6-em)]](https://www.rsc.org/images/entities/char_2009.gif) :
:![[thin space (1/6-em)]](https://www.rsc.org/images/entities/char_2009.gif) 1) was obtained (Fig. 4(b)). The nanoparticle has a clear lattice fringe with d-spacing of 0.37 nm and 0.22 nm, corresponding to the Fe2O3 phase (104) and (113) plane, respectively, while that of the substrate is 0.38 nm and 0.31 nm, corresponding to the (211) and (122) plane of Mn2O3, respectively. Therefore, Fe2O3/Mn2O3(3
1) was obtained (Fig. 4(b)). The nanoparticle has a clear lattice fringe with d-spacing of 0.37 nm and 0.22 nm, corresponding to the Fe2O3 phase (104) and (113) plane, respectively, while that of the substrate is 0.38 nm and 0.31 nm, corresponding to the (211) and (122) plane of Mn2O3, respectively. Therefore, Fe2O3/Mn2O3(3![[thin space (1/6-em)]](https://www.rsc.org/images/entities/char_2009.gif) :
:![[thin space (1/6-em)]](https://www.rsc.org/images/entities/char_2009.gif) 1) consists of Fe2O3 and Mn2O3, which is consistent with the XRD results. As shown in Fig. 4(b), a distinct heterojunction boundary between Fe2O3 nanoparticles and Mn2O3 substrate could be detected as shown by the red line. Fig. 4(c) shows that MnFe2O4 exists as nanospheres with diameters of 300–500 nm. The lattice fringe with d-spacing is 0.25 nm, which can be well indexed to the (311) plane of MnFe2O4 phase (Fig. 4(d)).
1) consists of Fe2O3 and Mn2O3, which is consistent with the XRD results. As shown in Fig. 4(b), a distinct heterojunction boundary between Fe2O3 nanoparticles and Mn2O3 substrate could be detected as shown by the red line. Fig. 4(c) shows that MnFe2O4 exists as nanospheres with diameters of 300–500 nm. The lattice fringe with d-spacing is 0.25 nm, which can be well indexed to the (311) plane of MnFe2O4 phase (Fig. 4(d)).
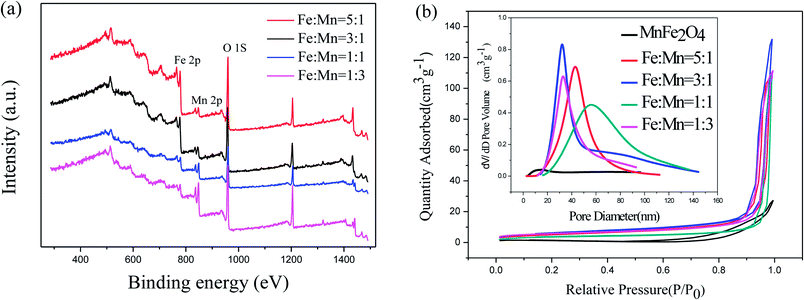
XPS was used to measure the surface chemical composition and confirm the Fe/Mn ratio of the as-prepared Fe2O3/Mn2O3 samples. As shown in Fig. 5(a), the common peaks of Fe 2p, Mn 2p and O 1s are present. The element contents are calculated and summarized in Table 1, illustrating that the results of Fe/Mn ratios are approximately equal to the corresponding experimental values. The N2 adsorption–desorption technique at 77 K was used to investigate specific surface areas and pore structures of the as-prepared samples. The nitrogen adsorption–desorption curves (Fig. 5(b)) manifest a type IV isothermal line with a delay loop-line in the P/P0 range of 0.9–1.0 for Fe2O3/Mn2O3 samples and 0.8–1.0 for MnFe2O4, indicating porous structures. The BET surface areas are 12.390, 19.889, 21.73 and 18.165 m2 g−1 for Fe2O3/Mn2O3(1![[thin space (1/6-em)]](https://www.rsc.org/images/entities/char_2009.gif) :
:![[thin space (1/6-em)]](https://www.rsc.org/images/entities/char_2009.gif) 1), Fe2O3/Mn2O3(1
1), Fe2O3/Mn2O3(1![[thin space (1/6-em)]](https://www.rsc.org/images/entities/char_2009.gif) :
:![[thin space (1/6-em)]](https://www.rsc.org/images/entities/char_2009.gif) 3), Fe2O3/Mn2O3(3
3), Fe2O3/Mn2O3(3![[thin space (1/6-em)]](https://www.rsc.org/images/entities/char_2009.gif) :
:![[thin space (1/6-em)]](https://www.rsc.org/images/entities/char_2009.gif) 1) and Fe2O3/Mn2O3(5
1) and Fe2O3/Mn2O3(5![[thin space (1/6-em)]](https://www.rsc.org/images/entities/char_2009.gif) :
:![[thin space (1/6-em)]](https://www.rsc.org/images/entities/char_2009.gif) 1), while their pore sizes are 55.7, 32.8, 32.8, and 43.7 nm, respectively. MnFe2O4 illustrates the BET surface area and pore size of 3.05 m2 g−1 and 14.4 nm, respectively.
1), while their pore sizes are 55.7, 32.8, 32.8, and 43.7 nm, respectively. MnFe2O4 illustrates the BET surface area and pore size of 3.05 m2 g−1 and 14.4 nm, respectively.
| Fe/Mn ratio | Composition | Fe/Mn | ||
|---|---|---|---|---|
| Fe 2p (at%) | Mn 2p (at%) | O 1s (at%) | ||
| Binding energy | ||||
| 708.00 eV | 639.00 eV | 528.00 eV | ||
1![[thin space (1/6-em)]](https://www.rsc.org/images/entities/char_2009.gif) : :![[thin space (1/6-em)]](https://www.rsc.org/images/entities/char_2009.gif) 1 1 |
3.77 | 4.03 | 92.2 | 0.94 |
1![[thin space (1/6-em)]](https://www.rsc.org/images/entities/char_2009.gif) : :![[thin space (1/6-em)]](https://www.rsc.org/images/entities/char_2009.gif) 3 3 |
2.43 | 7.63 | 89.94 | 0.32 |
3![[thin space (1/6-em)]](https://www.rsc.org/images/entities/char_2009.gif) : :![[thin space (1/6-em)]](https://www.rsc.org/images/entities/char_2009.gif) 1 1 |
9.81 | 2.84 | 87.36 | 3.45 |
5![[thin space (1/6-em)]](https://www.rsc.org/images/entities/char_2009.gif) : :![[thin space (1/6-em)]](https://www.rsc.org/images/entities/char_2009.gif) 1 1 |
12.10 | 2.34 | 85.56 | 5.17 |
3.2 ORR activity and DMFC performance
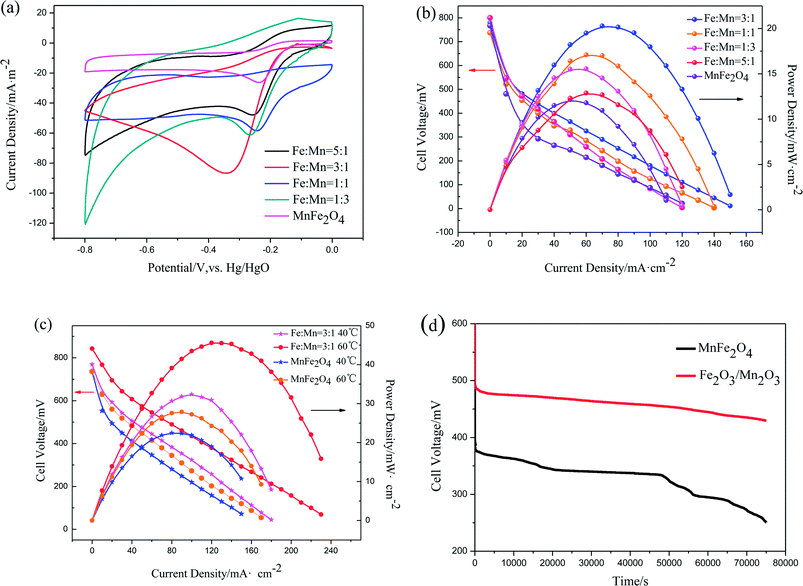
CV tests were performed to describe ORR catalytic activity. The current densities were normalized to their corresponding surface area. Capacitance correction was acquired by subtracting the measured current densities under N2 from those measured under O2 under the same condition. Fig. 6(a) shows the CV curves of Fe2O3/Mn2O3 with different Fe/Mn ratios and MnFe2O4 modified glassy carbon electrodes in O2-saturated 1 M KOH solution. Oxygen reduction peaks of these samples are distinct, demonstrating their ORR catalytic activities. Their oxygen reduction peak current densities and corresponding potentials are summarized in Table 2. The oxygen reduction peak current densities are −58.43, −61.21, −86.7 and −47.9 mA m−2 for Fe2O3/Mn2O3(1![[thin space (1/6-em)]](https://www.rsc.org/images/entities/char_2009.gif) :
:![[thin space (1/6-em)]](https://www.rsc.org/images/entities/char_2009.gif) 1), Fe2O3/Mn2O3(1
1), Fe2O3/Mn2O3(1![[thin space (1/6-em)]](https://www.rsc.org/images/entities/char_2009.gif) :
:![[thin space (1/6-em)]](https://www.rsc.org/images/entities/char_2009.gif) 3), Fe2O3/Mn2O3(3
3), Fe2O3/Mn2O3(3![[thin space (1/6-em)]](https://www.rsc.org/images/entities/char_2009.gif) :
:![[thin space (1/6-em)]](https://www.rsc.org/images/entities/char_2009.gif) 1) and Fe2O3/Mn2O3(5
1) and Fe2O3/Mn2O3(5![[thin space (1/6-em)]](https://www.rsc.org/images/entities/char_2009.gif) :
:![[thin space (1/6-em)]](https://www.rsc.org/images/entities/char_2009.gif) 1), respectively, while the corresponding peak potentials are −0.246, −0.267, −0.348 and −0.257 V. Clearly, Fe2O3/Mn2O3(3
1), respectively, while the corresponding peak potentials are −0.246, −0.267, −0.348 and −0.257 V. Clearly, Fe2O3/Mn2O3(3![[thin space (1/6-em)]](https://www.rsc.org/images/entities/char_2009.gif) :
:![[thin space (1/6-em)]](https://www.rsc.org/images/entities/char_2009.gif) 1) has the highest oxygen-reduction peak current density. As compared MnFe2O4, although the reduction peak potential of Fe2O3/Mn2O3(3
1) has the highest oxygen-reduction peak current density. As compared MnFe2O4, although the reduction peak potential of Fe2O3/Mn2O3(3![[thin space (1/6-em)]](https://www.rsc.org/images/entities/char_2009.gif) :
:![[thin space (1/6-em)]](https://www.rsc.org/images/entities/char_2009.gif) 1) is slightly more negative than that of MnFe2O4 (−0.237 V), the oxygen-reduction peak current density is much greater than that of MnFe2O4 (−26.26 mA m−2). CV results indicate Fe2O3/Mn2O3 exhibits higher ORR activity than MnFe2O4, which have excluded the effect of their specific surface area, demonstrating Fe2O3/Mn2O3 has more active sites probably introduced by heterojunction boundary between Fe2O3 and Mn2O3.
1) is slightly more negative than that of MnFe2O4 (−0.237 V), the oxygen-reduction peak current density is much greater than that of MnFe2O4 (−26.26 mA m−2). CV results indicate Fe2O3/Mn2O3 exhibits higher ORR activity than MnFe2O4, which have excluded the effect of their specific surface area, demonstrating Fe2O3/Mn2O3 has more active sites probably introduced by heterojunction boundary between Fe2O3 and Mn2O3.
| Catalysts | Peak current density (mA m−2) | Peak potential (V) | BET surface area (m2 g−1) | Pmax (mW cm−2) |
|---|---|---|---|---|
Fe2O3/Mn2O3(1![[thin space (1/6-em)]](https://www.rsc.org/images/entities/char_2009.gif) : :![[thin space (1/6-em)]](https://www.rsc.org/images/entities/char_2009.gif) 1) 1) |
−58.43 | −0.246 | 12.390 | 17.09 |
Fe2O3/Mn2O3(1![[thin space (1/6-em)]](https://www.rsc.org/images/entities/char_2009.gif) : :![[thin space (1/6-em)]](https://www.rsc.org/images/entities/char_2009.gif) 3) 3) |
−61.21 | −0.267 | 19.889 | 15.54 |
Fe2O3/Mn2O3(3![[thin space (1/6-em)]](https://www.rsc.org/images/entities/char_2009.gif) : :![[thin space (1/6-em)]](https://www.rsc.org/images/entities/char_2009.gif) 1) 1) |
−86.7 | −0.348 | 21.73 | 20.29 |
Fe2O3/Mn2O3(5![[thin space (1/6-em)]](https://www.rsc.org/images/entities/char_2009.gif) : :![[thin space (1/6-em)]](https://www.rsc.org/images/entities/char_2009.gif) 1) 1) |
−47.9 | −0.257 | 18.165 | 12.88 |
| MnFe2O4 | −26.26 | −0.237 | 3.05 | 12.15 |
The polarization and power density curves of Fe2O3/Mn2O3 with different Fe/Mn ratios and MnFe2O4 used as cathode catalysts in DMFCs are shown in Fig. 6(b). The maximum power densities (Pmax) for these catalysts are 17.09, 15.54, 20.29, 12.88 and 12.15 mW cm−2 for Fe2O3/Mn2O3(1![[thin space (1/6-em)]](https://www.rsc.org/images/entities/char_2009.gif) :
:![[thin space (1/6-em)]](https://www.rsc.org/images/entities/char_2009.gif) 1), Fe2O3/Mn2O3(1
1), Fe2O3/Mn2O3(1![[thin space (1/6-em)]](https://www.rsc.org/images/entities/char_2009.gif) :
:![[thin space (1/6-em)]](https://www.rsc.org/images/entities/char_2009.gif) 3), Fe2O3/Mn2O3(3
3), Fe2O3/Mn2O3(3![[thin space (1/6-em)]](https://www.rsc.org/images/entities/char_2009.gif) :
:![[thin space (1/6-em)]](https://www.rsc.org/images/entities/char_2009.gif) 1), Fe2O3/Mn2O3(5
1), Fe2O3/Mn2O3(5![[thin space (1/6-em)]](https://www.rsc.org/images/entities/char_2009.gif) :
:![[thin space (1/6-em)]](https://www.rsc.org/images/entities/char_2009.gif) 1) and MnFe2O4, respectively. These data indicate that the Fe2O3/Mn2O3-based DMFC is superior to MnFe2O4-based DMFC. As shown in Table 2, Fe2O3/Mn2O3(3
1) and MnFe2O4, respectively. These data indicate that the Fe2O3/Mn2O3-based DMFC is superior to MnFe2O4-based DMFC. As shown in Table 2, Fe2O3/Mn2O3(3![[thin space (1/6-em)]](https://www.rsc.org/images/entities/char_2009.gif) :
:![[thin space (1/6-em)]](https://www.rsc.org/images/entities/char_2009.gif) 1) shows the largest peak current density, BET surface area and Pmax, illustrating its superior ORR activity. Therefore, Fe2O3/Mn2O3(3
1) shows the largest peak current density, BET surface area and Pmax, illustrating its superior ORR activity. Therefore, Fe2O3/Mn2O3(3![[thin space (1/6-em)]](https://www.rsc.org/images/entities/char_2009.gif) :
:![[thin space (1/6-em)]](https://www.rsc.org/images/entities/char_2009.gif) 1) was assigned as Fe2O3/Mn2O3 and used for further studies. Fig. 6(c) shows the temperature effects on the DMFCs' performances. The Pmax of Fe2O3/Mn2O3- and MnFe2O4-based DMFCs are 32.4 and 22.5 mW cm−2 at 40 °C and 45.6 and 27.9 mW cm−2 at 60 °C, respectively. Table 3 compares the Pmax of DMFCs in the literature. In particular, the Fe2O3/Mn2O3-based DMFC achieves the highest Pmax among noble and non-noble metal cathode catalysts of DMFCs.
1) was assigned as Fe2O3/Mn2O3 and used for further studies. Fig. 6(c) shows the temperature effects on the DMFCs' performances. The Pmax of Fe2O3/Mn2O3- and MnFe2O4-based DMFCs are 32.4 and 22.5 mW cm−2 at 40 °C and 45.6 and 27.9 mW cm−2 at 60 °C, respectively. Table 3 compares the Pmax of DMFCs in the literature. In particular, the Fe2O3/Mn2O3-based DMFC achieves the highest Pmax among noble and non-noble metal cathode catalysts of DMFCs.
| Cathode (catalyst loading/mg cm−2) | Anode (catalyst loading/mg cm−2) | Solution | Electrolyte | Temperature/°C | Power density/mW cm−2 |
|---|---|---|---|---|---|
| Pt/C(8)33 | PtRu(5) | KOH | Nafion 211 | 25 | 15 |
| Pt(1)34 | Pt(1) | KOH | PVA–KOH | 90 | 10 |
| Pt(1)35 | PtRu(2) | KOH | PBI/KOH | 90 | 31 |
| Pt(5)36 | PtRu(5) | KOH | PVA/FS | 60 | 39 |
| Pt/C(10)22 | PtRu(6) | KOH | Nafion 211 | 26 | 16 |
| Pt black(1)37 | Pt(0.5) | KOH | Nafion 117 | 60 | 15 |
| 90 | 77 | ||||
| Fe-AApyr(7.4)38 | PtRu(1) | H2SO4 | Nafion 115 | 30 | 6.5 |
| 60 | 18 | ||||
| 90 | 35 | ||||
| Fe–N–C(4.5)39 | PtRu(1) | H2SO4 | Nafion 115 | 90 | 48 |
| Fe-ABZIM(3)40 | PtRu(1) | H2SO4 | Nafion 115 | 60 | 17 |
| MnO(4)41 | PtRu(4) | KOH | Q-PVA/PECH | 25 | 17 |
| MnO2/C(4)42 | PtRu black(4) | KOH | PVA/HAP | 25 | 11 |
| MnO2(4)43 | PtRu(4) | KOH | PVA/HAP | 25 | 11 |
| MnFe2O4(24) (this work) | PtRu/C(5) | KOH | PFM | 20 | 12 |
| 40 | 22 | ||||
| 60 | 28 | ||||
Fe2O3/Mn2O3(3![[thin space (1/6-em)]](https://www.rsc.org/images/entities/char_2009.gif) : :![[thin space (1/6-em)]](https://www.rsc.org/images/entities/char_2009.gif) 1) (24) (this work) 1) (24) (this work) |
PtRu/C(5) | KOH | PFM | 20 | 20 |
| 40 | 32 | ||||
| 60 | 46 |
Stability tests were conducted in galvanostatic discharge by monitoring the voltage of Fe2O3/Mn2O3- and MnFe2O4-based DMFCs. As shown in Fig. 6(d), at a constant current of 10 mA cm−2 at room temperature, the Fe2O3/Mn2O3-based DMFC has much higher cell voltage than MnFe2O4-based DMFC for 75![[thin space (1/6-em)]](https://www.rsc.org/images/entities/char_2009.gif) 000 s. In about 50
000 s. In about 50![[thin space (1/6-em)]](https://www.rsc.org/images/entities/char_2009.gif) 000 seconds, the voltage of MnFe2O4-based DMFC decreases sharply. For the Fe2O3/Mn2O3-based DMFC, no distinct attenuation phenomenon is found, indicating that this cell is quite stable.
000 seconds, the voltage of MnFe2O4-based DMFC decreases sharply. For the Fe2O3/Mn2O3-based DMFC, no distinct attenuation phenomenon is found, indicating that this cell is quite stable.
3.3 ORR mechanism of Fe2O3/Mn2O3
In conclusion, Fe2O3/Mn2O3(3![[thin space (1/6-em)]](https://www.rsc.org/images/entities/char_2009.gif) :
:![[thin space (1/6-em)]](https://www.rsc.org/images/entities/char_2009.gif) 1) exhibits higher ORR activity and superior DMFC performance than MnFe2O4. The first reason is that Fe2O3/Mn2O3(3
1) exhibits higher ORR activity and superior DMFC performance than MnFe2O4. The first reason is that Fe2O3/Mn2O3(3![[thin space (1/6-em)]](https://www.rsc.org/images/entities/char_2009.gif) :
:![[thin space (1/6-em)]](https://www.rsc.org/images/entities/char_2009.gif) 1) has a much larger specific surface area (21.73 m2 g−1) than MnFe2O4 (3.05 m2 g−1), which plays a key role in enhancing ORR activity, providing numerous active sites and accelerating mass-transfer. It is worth noting that although current densities are normalized to their corresponding surface area in the CV tests, Fe2O3/Mn2O3 still demonstrates higher ORR activity than MnFe2O4.
1) has a much larger specific surface area (21.73 m2 g−1) than MnFe2O4 (3.05 m2 g−1), which plays a key role in enhancing ORR activity, providing numerous active sites and accelerating mass-transfer. It is worth noting that although current densities are normalized to their corresponding surface area in the CV tests, Fe2O3/Mn2O3 still demonstrates higher ORR activity than MnFe2O4.
The second reason is due to the existence of the numerous heterojunctions between Fe2O3 and Mn2O3, which provides an intensive internal electric field at the interface of the two oxides and increases the catalytic active sites, electron transfer and ORR efficiency.29,30 EIS was applied to describe the internal resistance of Fe2O3/Mn2O3(3![[thin space (1/6-em)]](https://www.rsc.org/images/entities/char_2009.gif) :
:![[thin space (1/6-em)]](https://www.rsc.org/images/entities/char_2009.gif) 1) and MnFe2O4. As shown in Fig. 7(a), the Nyquist plots of the Fe2O3/Mn2O3(3
1) and MnFe2O4. As shown in Fig. 7(a), the Nyquist plots of the Fe2O3/Mn2O3(3![[thin space (1/6-em)]](https://www.rsc.org/images/entities/char_2009.gif) :
:![[thin space (1/6-em)]](https://www.rsc.org/images/entities/char_2009.gif) 1)- and MnFe2O4-based DMFCs exhibit similar trends. The ohmic resistances (Rs) of the Fe2O3/Mn2O3(3
1)- and MnFe2O4-based DMFCs exhibit similar trends. The ohmic resistances (Rs) of the Fe2O3/Mn2O3(3![[thin space (1/6-em)]](https://www.rsc.org/images/entities/char_2009.gif) :
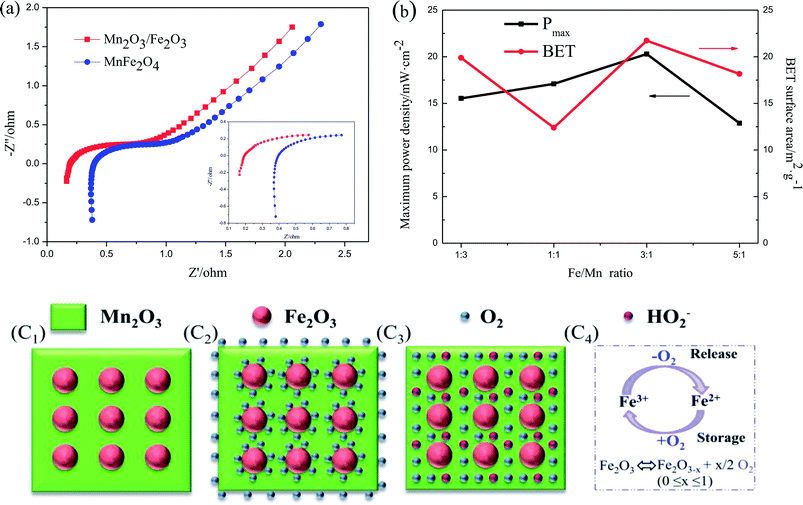
:![[thin space (1/6-em)]](https://www.rsc.org/images/entities/char_2009.gif) 1)- and MnFe2O4-based DMFCs are 0.2 Ω cm−2 and 0.4 Ω cm−2, respectively. Rs values are the ohmic resistances of the total cell from the anode to cathode, including the solution, electrodes and membrane resistances. These two cells differ only in the cathode catalysts; they have the same solution (4 M KOH and 5 M methanol), membrane and anode. Therefore, it is speculated that the lower resistance of Fe2O3/Mn2O3 is owing to the heterojunction providing an intensive internal electric field and increasing the electron transfer. Moreover, the content of heterojunctions between Fe2O3 nanoparticles and Mn2O3 matrix is proportional to the number of Fe2O3 nanoparticles. In other words, with an increase in the Fe/Mn ratio, the density of heterojunctions gradually increases. As shown in Fig. 7(b), on increasing the quantity of heterojunctions, Pmax is gradually improved. However, when the Fe/Mn ratio reaches 5
1)- and MnFe2O4-based DMFCs are 0.2 Ω cm−2 and 0.4 Ω cm−2, respectively. Rs values are the ohmic resistances of the total cell from the anode to cathode, including the solution, electrodes and membrane resistances. These two cells differ only in the cathode catalysts; they have the same solution (4 M KOH and 5 M methanol), membrane and anode. Therefore, it is speculated that the lower resistance of Fe2O3/Mn2O3 is owing to the heterojunction providing an intensive internal electric field and increasing the electron transfer. Moreover, the content of heterojunctions between Fe2O3 nanoparticles and Mn2O3 matrix is proportional to the number of Fe2O3 nanoparticles. In other words, with an increase in the Fe/Mn ratio, the density of heterojunctions gradually increases. As shown in Fig. 7(b), on increasing the quantity of heterojunctions, Pmax is gradually improved. However, when the Fe/Mn ratio reaches 5![[thin space (1/6-em)]](https://www.rsc.org/images/entities/char_2009.gif) :
:![[thin space (1/6-em)]](https://www.rsc.org/images/entities/char_2009.gif) 1, Pmax decreases sharply because numerous Fe2O3 nanoparticles wrap in the Mn2O3 matrix, impeding the Mn2O3 catalytic sites from contacting with O2 and electrolyte. In addition, Fe2O3/Mn2O3(1
1, Pmax decreases sharply because numerous Fe2O3 nanoparticles wrap in the Mn2O3 matrix, impeding the Mn2O3 catalytic sites from contacting with O2 and electrolyte. In addition, Fe2O3/Mn2O3(1![[thin space (1/6-em)]](https://www.rsc.org/images/entities/char_2009.gif) :
:![[thin space (1/6-em)]](https://www.rsc.org/images/entities/char_2009.gif) 1) has smaller specific surface area but higher power density than Fe2O3/Mn2O3(1
1) has smaller specific surface area but higher power density than Fe2O3/Mn2O3(1![[thin space (1/6-em)]](https://www.rsc.org/images/entities/char_2009.gif) :
:![[thin space (1/6-em)]](https://www.rsc.org/images/entities/char_2009.gif) 3), indicating the ORR activity follows the order of Fe/Mn ratio instead of its specific surface area.
3), indicating the ORR activity follows the order of Fe/Mn ratio instead of its specific surface area.
The third reason is the synergistic effect between Fe2O3 and Mn2O3 in Fe2O3/Mn2O3. The Fe2O3 particles not only enhance the dispersity of Mn2O3, but also increase the O2 storage capability. Fe2O3 is an n-type semiconductor with a large number of oxygen vacancies. Many reports suggest that Fe2O3 has the outstanding ability of reversibly exchanging O2 through the transformation of Fe3+ and Fe2+.31,32 As shown in Fig. 7(c), Fe2O3 acts as an O2-storage and release site owing to the Fe3+/Fe2+ redox couple. It can store O2 in O2-surplus condition and release it under oxygen deficiency condition. When O2 concentration is sufficient, Fe2O3 captures the surrounding O2 molecules on its surface by oxidation reaction from Fe2+ to Fe3+ as shown in Fig. 7(c2). Moreover, when O2 is insufficient, such as at high current density, the adsorbed O2 on the Fe2O3 surface can release and obtain electrons, thus forming HO2−, which rapidly transfers to adjacent catalytic sites of the Mn2O3 matrix via reduction reaction from Fe3+ to Fe2+ as illustrated in Fig. 7(c3). The rapid supply of excess O2 and HO2− can increase O2 transfer and ORR efficiency in Fe2O3/Mn2O3. Therefore, the synergistic coupling between Fe2O3 and Mn2O3 greatly promotes its superior ORR ability over MnFe2O4. However, excess Fe2O3 will reduce ORR ability owing to its poorer intrinsic ORR activity compared to Mn2O3. Above all, the larger specific surface area, large number of heterojunction interfaces, and excellent synergistic effect of Fe2O3 and Mn2O3 play key roles in the enhanced ORR activity of Fe2O3/Mn2O3.
4. Conclusions
(1) Fe2O3/Mn2O3 and MnFe2O4 were synthesized via a facile template-free solvothermal method. Fe2O3/Mn2O3 exists as sub-size porous nanosheets-self-assembled globular structures. The microspheres are 3–4 μm in diameter and the pore size is about 30 nm. The formation of nanopores is due to the release of CO2, which comes from MnCO3 decomposition during the calcination process. The TEM and HRTEM images show Fe2O3 nanoparticles uniformly dispersed on the Mn2O3 substrate and a distinct heterojunction boundary between Fe2O3 nanoparticles and Mn2O3 substrate. MnFe2O4 has a hierarchical structure, in which the nanoparticles are 20–30 nm in diameter and the self-assembled globular shapes have diameters of 300–500 nm.(2) CV and DMFC performance tests show that Fe2O3/Mn2O3(3![[thin space (1/6-em)]](https://www.rsc.org/images/entities/char_2009.gif) :
:![[thin space (1/6-em)]](https://www.rsc.org/images/entities/char_2009.gif) 1) exhibits higher ORR activity than Fe2O3/Mn2O3(1
1) exhibits higher ORR activity than Fe2O3/Mn2O3(1![[thin space (1/6-em)]](https://www.rsc.org/images/entities/char_2009.gif) :
:![[thin space (1/6-em)]](https://www.rsc.org/images/entities/char_2009.gif) 1), Fe2O3/Mn2O3(1
1), Fe2O3/Mn2O3(1![[thin space (1/6-em)]](https://www.rsc.org/images/entities/char_2009.gif) :
:![[thin space (1/6-em)]](https://www.rsc.org/images/entities/char_2009.gif) 3), Fe2O3/Mn2O3(5
3), Fe2O3/Mn2O3(5![[thin space (1/6-em)]](https://www.rsc.org/images/entities/char_2009.gif) :
:![[thin space (1/6-em)]](https://www.rsc.org/images/entities/char_2009.gif) 1) and MnFe2O4. The Pmax of Fe2O3/Mn2O3(3
1) and MnFe2O4. The Pmax of Fe2O3/Mn2O3(3![[thin space (1/6-em)]](https://www.rsc.org/images/entities/char_2009.gif) :
:![[thin space (1/6-em)]](https://www.rsc.org/images/entities/char_2009.gif) 1)-based DMFCs are 32.4 and 45.6 mW cm−2 at 40 and 60 °C, respectively. The results indicated that the as-prepared Fe2O3/Mn2O3 catalysts achieved the highest Pmax among noble and non-noble metal cathode catalysts of DMFCs.
1)-based DMFCs are 32.4 and 45.6 mW cm−2 at 40 and 60 °C, respectively. The results indicated that the as-prepared Fe2O3/Mn2O3 catalysts achieved the highest Pmax among noble and non-noble metal cathode catalysts of DMFCs.
(3) The much superior catalytic performance of Fe2O3/Mn2O3 is due to its larger surface area, the existence of numerous heterojunction interfaces and the synergistic effect between Fe2O3 and Mn2O3, which can provide numerous catalytic active sites, accelerate mass transfer, and increase ORR efficiency. It is worth noting that Fe2O3 acts as an O2-storage and release site owing to the Fe3+/Fe2+ redox couple. In addition, the synergistic effect between Fe2O3 and Mn2O3 greatly promotes its ORR properties.
Conflicts of interest
There are no conflicts to declare.Acknowledgements
This work was supported by the National Natural Science Foundation of China (51472153, 51572158), the Doctoral Starting up Foundation of Shaanxi University of Science and Technology (2016BJ-75) and the Graduate Innovation Fund of Shaanxi University of Science and Technology.Notes and references
- J. Galindodelarosa, N. Arjona, A. Morenozuria, E. Ortizortega, M. Guerrabalcázar, J. Ledesmagarcía and L. G. Arriaga, Biosens. Bioelectron., 2017, 92, 117 CrossRef CAS PubMed.
- X. Ren, P. Zelenay, S. Thomas, J. Davey and S. Gottesfeld, J. Power Sources, 2000, 86, 111–116 CrossRef CAS.
- L. Li and Y. Xing, J. Phys. Chem. C, 2007, 111, 2803–2808 CAS.
- K. G. Nishanth, P. Sridhar, S. Pitchumani and A. K. Shuklab, J. Electrochem. Soc., 2011, 158, B871 CrossRef CAS.
- J. G. Liu, T. S. Zhao, R. Chen and C. W. Wong, Electrochem. Commun., 2005, 7, 288–294 CrossRef CAS.
- Y. T. Hong, H. L. Chang, H. S. Park, K. A. Min, H. J. Kim, Y. N. Sang and Y. M. Lee, J. Power Sources, 2008, 175, 724–731 CrossRef CAS.
- B. Gurau, R. Viswanathan, R. Liu, T. J. Lafrenz, K. L. L. And, E. S. Smotkin, E. Reddington, A. Sapienza, B. C. C. And and T. E. Mallouk, J. Phys. Chem. B, 1998, 102, 9997–10003 CrossRef CAS.
- C. Koenigsmann and S. S. Wong, Energy Environ. Sci., 2011, 4, 1161–1176 CAS.
- Y. Fang, X. Yang, L. Wang and Y. Liu, Electrochim. Acta, 2013, 90, 421–425 CrossRef CAS.
- X. Yang, Y. Liu, S. Li, X. Wei, L. Wang and Y. Chen, Sci. Rep., 2012, 2, 567 CrossRef PubMed.
- W. Wang, D. Zheng, C. Du, Z. Zou, X. Zhang, B. Xia, H. Yang and D. L. Akins, J. Power Sources, 2007, 167, 243–249 CrossRef CAS.
- H. Yang, W. Vogel, A. Claude Lamy and N. Alonsovante, J. Phys. Chem. B, 2004, 108, 11024–11034 CrossRef CAS.
- W. Chen, J. Kim, A. Shouheng Sun and S. Chen, J. Phys. Chem. C, 2014, 112, 3891–3898 Search PubMed.
- G. Liu, H. Zhang and J. Hu, Electrochem. Commun., 2007, 9, 2643–2648 CrossRef CAS.
- J. Zhao, A. Sarkar and A. Manthiram, Electrochim. Acta, 2010, 55, 1756–1765 CrossRef CAS.
- M. Neergat, V. Gunasekar and R. Rahul, J. Electroanal. Chem., 2011, 658, 25–32 CrossRef CAS.
- P. Nekooi, M. Akbari and M. K. Amini, Int. J. Hydrogen Energy, 2010, 35, 6392–6398 CrossRef CAS.
- W. Yang, S. Chen and W. Lin, Int. J. Hydrogen Energy, 2012, 37, 942–945 CrossRef.
- J. L. Gautier, J. Ortiz, N. Heller-Ling, G. Poillerat and P. Chartier, J. Appl. Electrochem., 1998, 28, 827–834 CrossRef CAS.
- Y. Sa, K. Kwon, J. Cheon, F. Kleitz and S. Joo, J. Mater. Chem. A, 2013, 1, 9992–10001 CAS.
- H. Osgood, S. V. Devaguptapu, H. Xu, J. Cho and G. Wu, Nano Today, 2016, 11, 601–625 CrossRef CAS.
- Y. Liu, C. Shu, Y. Fang, Y. Chen and Y. Liu, J. Power Sources, 2017, 361 Search PubMed.
- Y. Fang, X. Yang, L. Wang and Y. Liu, J. Power Sources, 2014, 267, 33–38 CrossRef CAS.
- C. Si, Y. Zhang, C. Zhang, H. Gao, W. Ma, L. Lv and Z. Zhang, Electrochim. Acta, 2017, 245, 829–838 CrossRef CAS.
- V. Nikolova, P. Iliev, K. Petrov, T. Vitanov, E. Zhecheva, R. Stoyanova, I. Valov and D. Stoychev, J. Power Sources, 2008, 185, 727–733 CrossRef CAS.
- N. Hasanabadi, S. R. Ghaffarian and M. M. Hasani-Sadrabadi, Int. J. Hydrogen Energy, 2011, 36, 15323–15332 CrossRef CAS.
- W. Wang, J. Geng, L. Kuai, M. Li and B. Geng, Chemistry, 2016, 22, 9909 CrossRef CAS PubMed.
- C. Yuan, J. Li, L. Hou, X. Zhang, L. Shen and X. W. Lou, Adv. Funct. Mater., 2012, 22, 4592–4597 CrossRef CAS.
- L. Qiao, X. Wang, X. Sun, X. Li, Y. Zheng and D. He, Nanoscale, 2013, 5, 3037 RSC.
- L. J. Lauhon, M. S. Gudiksen, D. Wang and C. M. Lieber, Nature, 2002, 420, 57–61 CrossRef CAS PubMed.
- L. Zhang, Y. Ni, X. Wang and G. Zhao, Talanta, 2010, 82, 196–201 CrossRef CAS PubMed.
- F. G. Durán, B. P. Barbero, L. E. Cadús, C. Rojas, M. A. Centeno and J. A. Odriozola, Appl. Catal., B, 2009, 92, 194–201 CrossRef.
- C. Shu, X. Yang, Y. Chen, Y. Fang, Y. Zhou and Y. Liu, RSC Adv., 2016, 6, 37012–37017 RSC.
- J. Fu, J. Qiao, X. Wang, J. Ma and T. Okada, Synth. Met., 2010, 160, 193–199 CrossRef CAS.
- H. Hou, G. Sun, R. He, Z. Wu and B. Sun, J. Power Sources, 2008, 182, 95–99 CrossRef CAS.
- S. J. Lue, W. T. Wang, K. P. O. Mahesh and C. C. Yang, J. Power Sources, 2010, 195, 7991–7999 CrossRef CAS.
- V. Baglio, C. D'Urso, D. Sebastián, A. Stassi and A. S. Aricò, Int. J. Hydrogen Energy, 2014, 39, 5399–5405 CrossRef CAS.
- D. Sebastián, V. Baglio, A. S. Aricò, A. Serov and P. Atanassov, Appl. Catal., B, 2016, 182, 297–305 CrossRef.
- n. D. Sebastiã, A. Serov, K. Artyushkova, J. Gordon, P. Atanassov, A. S. Aricã and V. Baglio, ChemSusChem, 2016, 9, 1986–1995 CrossRef PubMed.
- D. Sebastián, A. Serov, K. Artyushkova, P. Atanassov, A. S. Aricò and V. Baglio, J. Power Sources, 2016, 319, 235–246 CrossRef.
- C. C. Yang, J. Appl. Electrochem., 2012, 42, 305–317 CrossRef CAS.
- C. C. Yang, C. T. Lin and S. J. Chiu, Desalination, 2008, 233, 137–146 CrossRef CAS.
- C. C. Yang, S. J. Chiu and C. T. Lin, J. Power Sources, 2008, 177, 40–49 CrossRef CAS.
| This journal is © The Royal Society of Chemistry 2018 |

