 Open Access Article
Clear transparent cellulose nanopaper prepared from a concentrated dispersion by high-humidity drying
Noriyuki Isobe *a,
Takaki Kasuga
 b and
Masaya Nogib
aR&D Center for Marine Biosciences, Japan Agency for Marine-Earth Science and Technology (JAMSTEC), 2-15 Natsushima-cho, Yokosuka 237-0061, Japan. E-mail: isoben@jamstec.go.jp
bThe Institute of Scientific and Industrial Research, Osaka University, Mihogaoka 8-1, Ibaraki, Osaka 567-0047, Japan
First published on 8th January 2018
Abstract
Optically transparent cellulose nanopaper is a promising candidate for flexible device substrates because of its light weight, surface smoothness, and high dimensional stability with respect to temperature. Conventionally, clear transparent nanopaper has been fabricated from cellulose nanofiber dispersions with quite low concentration: less than 0.5 wt%. However, this diluteness leads to several problems, such as huge energy consumption and long operation time for drying. Therefore, nanopaper should be fabricated from a concentrated dispersion to mitigate these problems. In this study, transparent nanopaper was fabricated from cellulose nanofiber dispersions with various concentrations (0.24–1.81 wt%). Optical experiments revealed that the haze of the transparent nanopaper increased monotonically with cellulose nanofiber dispersion concentration, when the cellulose nanofiber dispersion was prepared from holocellulose pulp and conventional over-drying was applied. Based on our insight into the origin of this increase in the haze of transparent nanopaper, we developed high-humidity drying, which successfully produced clear transparent nanopaper from a concentrated dispersion without prolonged drying time.
1. Introduction
Traditional paper – typically prepared by drying of an aqueous dispersion of 15 to 30 μm-wide cellulose fibers called “pulp” – has a white and opaque appearance because cavities present among the fibers give rise to light scattering. In contrast, nanopaper, prepared by drying an aqueous dispersion of 3 to 15 nm-wide cellulose fibers, exhibits highly clear transparency, as evidenced by the low haze of 1–3%. This is because cellulose nanofibers are so densely packed that there are no cavities producing light scattering, either inside the nanopaper or at the surface.1,2 Nanopaper exhibits a low coefficient of thermal expansion comparable to that of glass and higher thermal durability and dielectric constant than conventional plastics, thanks to the high mechanical properties of cellulose nanofibers.1–4 Moreover, nanopaper is lightweight and retains high foldability, similar to conventional paper. These advantageous properties have successfully paved the way toward the application of nanopaper in flexible electronics such as transparent electrodes, organic solar cells, transistors, antenna, and memory.4–10 The starting materials for such clear transparent nanopaper with low haze include holocellulose pulp, 2,2,6,6-tetramethylpiperidine-1-oxyl (TEMPO)-mediated oxidized pulp, and carboxymethylated pulp.11–15 Among them, clear transparent nanopaper from holocellulose pulp is one of the most promising candidates for flexible electronic device substrates because of the high thermal resistance.14To realize the commercialization of nanopaper-based flexible electronic devices, however, there remains one problem during processing: the low concentration of the cellulose nanofiber dispersion. In the current process, starting from a low concentration dispersion of less than 0.5 wt%, clear transparent nanopaper can be fabricated by filtration1,8,16,17 or cast-drying,2,10,17 both of which are highly energy- and time-consuming because of the high water load (99.5 wt%) in the cellulose nanofiber dispersion (0.5 wt% cellulose nanofiber). In this context, therefore, the fabrication of clear transparent nanopaper should start from a high concentration dispersion, which will reduce energy and time consumption, leading to the realization of flexible devices based on nanopaper.
Here, the aim of this study is to develop a fabrication process for clear transparent nanopaper from a concentrated cellulose nanofiber dispersion, where the starting material is holocellulose pulp. First, we re-confirmed that the concentration of the nanofiber dispersion is the process-time determining factor during the fabrication of transparent nanopaper. Then, we revealed that the nanopaper haze and the drying time are dependent on the dispersion concentration. Finally, based on our insight into the origin of this increase in the haze of transparent nanopaper, we developed a novel drying protocol, high-humidity drying, that successfully produced clear transparent nanopaper from a concentrated dispersion without prolonged drying time.
2. Experimental
2.1. Cellulose pulp
Holocellulose pulp was prepared according to a previous study.14 First, 40 g of wood chips of Japanese cedar (Cryptomeria japonica) was dewaxed in a mixture of acetone/water (900 ml/100 ml) at room temperature overnight with gentle stirring. Then, the chips were delignified in an acetic anhydride/hydrogen peroxide mixture (500 ml/500 ml) at 90 °C for 2 h. Finally, the delignified pulp was washed thoroughly with distilled water.2.2. Nanofibrillation and nanopaper
Disintegration of cellulose pulp into nanofiber was performed using a water-jet nanofibrillation system.2,14,15 Here, 2000 g of pulp slurry (pulp content: 0.5 wt%) was homogenized by a high-pressure water jet system (Star Burst, HJP-25008, Sugino Machine Co., Ltd.) equipped with a ball-collision chamber. The injected slurry was repeatedly passed through a small nozzle with a diameter of 0.15 mm under a high pressure of 245 MPa. After 50 passes through this nozzle, a 0.24 wt% cellulose nanofiber water dispersion was obtained. The dispersion was condensed to various concentrations up to 1.8 wt% using a rotary evaporator (EYLA SB1200, Tokyo Rikakikai). The condensed dispersion was degassed using a centrifugal mixer (ARV-310, Thinky Corp., Japan) at 2000 rpm for 3 min under vacuum and then at 200 rpm for 2 min under ambient pressure. The conditioned dispersion was cast evenly on an acrylic plate with an applicator. Subsequent oven-drying at 55 °C under 25% (DVS402, Yamato) or 80% (SH-641, Espec) relative humidity (R.H.) overnight gave transparent or translucent cellulose nanopaper with thicknesses of 12 ± 2 μm for haze measurement and 20 μm for photographs. As an additional nanopaper preparation protocol, a 1.3 wt% cellulose nanofiber water dispersion was diluted to 0.24 wt%, and subjected to oven-drying at 55 °C or 100 °C under 25% R.H. (DVS402, Yamato). In addition, to monitor the change in weight of the cellulose nanofiber water dispersion during oven-drying, 10 g of a 1.6 wt% cellulose nanofiber water dispersion was oven-dried on an evaporating dish and the weight was recorded at given time intervals.2.3. Characterizations
The haze of cellulose nanopaper was measured using a haze meter (HZ-V3, Suga Test Instruments Co., Ltd.). The zeta potential of the as-prepared 0.24 wt% cellulose nanofiber dispersion was measured using a zeta potential analyzer (ELSZ-2000, Otsuka Electronics Co., Ltd.).3. Results and discussion
Despite the water-retention capacity of cellulosic fibers, 150 cm3 of the pulp fiber dispersion with a pulp concentration of 2 wt% (Fig. 1a) was easily vacuum-filtered for less than 1 min, giving paste-like substance with the pulp content of 27 wt% (Fig. 1b). Even when this filtered pulp was squashed using fingers, no water drops came out. The traditional paper is manufactured by drying such highly condensed wet pulp, and thus the fabrication terminates quickly with low cost. In contrast, upon the disintegration of 15 to 30 μm-wide pulp fibers into 3 to 15 nm-wide nanofibers, the water-retention capacity and viscosity became higher and accordingly dewettability became poorer; even upon an extensive vacuum-filtration for 60 min on 150 cm3 of cellulose nanofiber dispersion with nanofiber concentration of only 0.2 wt% (Fig. 1c and e), the concentration still remained low (2.3 wt%), and its appearance was gel-like (Fig. 1d). As mentioned above, there are two methods for transparent nanopaper preparation: filtration and cast-drying of nanofiber dispersion, both of which are applicable to low-concentration dispersions (less than 0.5 wt%).17 In turn, a high-concentration dispersion allows only cast-drying as a suitable process for nanopaper preparation because the filtration of the gel-like dispersion (Fig. 1d) consumes too much operation time. In this study, therefore, the cast-drying method was chosen to fabricate transparent nanopaper from highly concentrated cellulose nanofiber dispersions, and the transparency of nanopaper and drying time were evaluated. | ||
| Fig. 1 (a) 2 wt% pulp fiber dispersion, (b) 27 wt% pulp, (c) 0.2 wt% cellulose nanofiber dispersion, (d) 2.3 wt% cellulose nanofiber, and (e) flow behavior of 0.2 wt% cellulose nanofiber dispersion. | ||
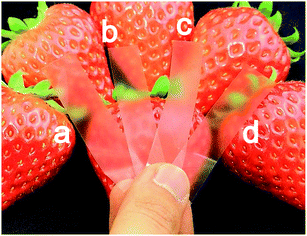
When a highly concentrated dispersion of 1.3 wt% was oven-dried at 55 °C, the lower water content shortened the drying time but the nanopaper became hazy transparent (Fig. 2a). When the highly concentrated dispersion was diluted to 0.24 wt% and then oven-dried at 55 °C, the added water prolonged the drying time and, even worse, the appearance remained highly hazy (Fig. 2b). To shorten the drying time, the diluted dispersion of 0.24 wt% was oven-dried at 105 °C. As a result, the drying time was shortened, but the transparency was the haziest (Fig. 2c). These results demonstrate that the use of a highly concentrated dispersion as a starting material poses a difficulty: clear transparent nanopaper cannot be prepared without prolonged drying time. However, when the highly concentrated dispersion of 1.3 wt% was subjected to high-humidity drying, namely drying at 55 °C under a highly humid atmosphere of 80% R.H., clear transparent nanopaper was obtained with minimal prolongation of drying time (Fig. 2d). These results suggest that the starting concentration of the dispersion and atmospheric humidity during drying strongly influence the nanopaper haze and drying time. In the next section, we quantitatively discuss the associated mechanism by discussing the detailed results.
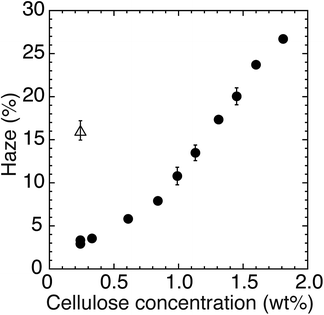
To clarify the impact of the concentration of the nanofiber dispersion on the nanopaper haze, 0.24–1.81 wt% cellulose nanofiber dispersions were oven-dried at 55 °C and 25% R.H., after which the haze of the obtained nanopaper with thicknesses of 12 ± 2 μm was measured (Fig. 3 solid circles). After drying the 0.24 wt% dispersion, a clear transparent nanopaper with a low haze of 3.1% was obtained. This low haze is likely to result from the homogeneity of the starting dispersion. The zeta potential of the 0.24 wt% dispersion was −21.9 ± 0.2 mV, indicating that cellulose nanofibers were isolated individually in the dispersion.18 Consequently, the homogeneously isolated nanofibers could tightly pack with each other through the drying process, leading to the homogeneous packing without micrometric cavities producing light scattering inside the nanopaper.19–21 When the concentration of the dispersion is increased, however, cellulose nanofibers tend to form inhomogeneous aggregates in the dispersion.22,23 This aggregation hindered the tight packing of nanofibers, and consequently the cavities were produced between the nanofiber aggregations after drying, leading to the haziness of nanopaper. For example, the nanopaper produced from 1.60 wt% dispersions exhibited a high haze of 23.7%. Despite this inconvenience, however, the high-concentration dispersion had an advantage in the fabrication of nanopaper: shorter drying time. The low concentration of the 0.24 wt% dispersion required a long drying time of 10–12 h to obtain 12 ± 2 μm-thick nanopaper because of the large water volume. When the high-concentration dispersion was used, the total amount of dispersion necessary to prepare a nanopaper with the same thickness was greatly reduced. As a result, 1.60 wt% cellulose nanofiber dispersions took only 5 h to dry. To summarize, the highly concentrated dispersion dried faster, but the haze of the resulting nanopaper became worse.
Cellulose nanofibers were individually isolated in the low-concentration dispersion, while they formed inhomogeneous aggregations in the high-concentration dispersion. To disintegrate the aggregations, a dilution by water was tested: 1.6 wt% cellulose nanofiber dispersion was diluted to 0.24 wt%, and was subjected to oven-drying at 55 °C under 25% R.H. The dilution decreased the nanopaper haze from 23.7% to 16.1% (Fig. 3 open triangles), indicating that additional water allowed partial disintegration of aggregations, leading to packing of cellulose nanofibers with less cavities. By the dilution, however, the drying time increased from 5 h to 10–12 h. When the drying temperature was elevated up to 105 °C for quick removal of the water, the transparent nanopaper became hazier, as mentioned above. To moderate the aggregations in the high-concentration dispersion, therefore, the addition of too much water should be avoided. The addition of a minimum amount of water will be suitable to make low-haze transparent nanopaper from a high-concentration dispersion without prolonged drying time.
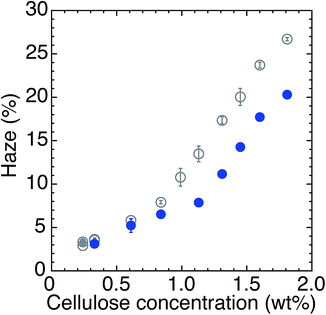
Therefore, as a source of minimum additional water, increased atmospheric humidity during drying, from 25% R.H. to 80% R.H., was selected, while keeping the drying temperature at 55 °C. This is because during drying process the evaporation and condensation of water vapor take place at the same time,24,25 and the condensation rate can be increased by increasing humidity.26 Fig. 4 shows the haze of transparent nanopaper fabricated under 25% R.H. (solid circles) and 80% R.H. (open circles) at 55 °C. Using a low-concentration dispersion (less than 1 wt%), the haze of the nanopaper was almost the same, regardless of atmospheric humidity, either 25% or 80% R.H. However, using a high-concentration dispersion (greater than 1 wt%), the high humidity of 80% R.H. decreased the haze by 5–6% compared with that of 25% R.H. Because these dispersions were not diluted by additional water as in the above-mentioned protocol, the drying time under 80% R.H. was almost equal to that under 25% R.H.; prolonged drying time was only one hour at a maximum. Specifically, the increase in drying humidity from 25% R.H. to 80% R.H. adds a minimal amount of water to the dispersion by the condensation of vapor, which is necessary for the partial disintegration of the nanofiber aggregations present in high-concentration dispersions.
 | ||
| Fig. 4 Haze of transparent nanopaper (12 μm thick) by drying at 55 °C and under 25% R.H. (open circles) and at 55 °C and under 80% R.H. (solid circles). | ||
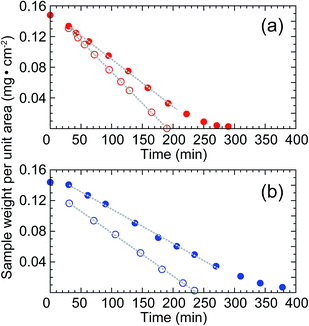
We propose that high-humidity drying added the minimum amount of water required to the high-concentration nanofiber dispersion during the drying period. To confirm this drying mechanism, the weight losses of the 1.6 wt% cellulose nanofiber dispersion and pure water without nanofibers (0 wt% cellulose nanofiber dispersion) were monitored during drying at 55 °C under 25% R.H. or 80% R.H. (Fig. 5). In pure water, the entire surface was covered with water, while in the cellulose nanofiber dispersion, the surface was partially covered with cellulose nanofibers. The cellulose nanofibers on the surface blocked water evaporation from the dispersion surface. Thus, the weight loss of the dispersion was slower than that of pure water, regardless of atmospheric humidity (Fig. 5a and b). By analyzing this observation quantitatively, here we explain how the increase in drying humidity served to moderate the nanofiber aggregations in the high-concentration dispersion.
The occupancy of water at the surface of the cellulose nanofiber dispersion during drying can be derived from the weight of constant evaporation of water per unit time, i.e., the constant-rate drying.27 The rate of drying was determined from the slope of the weight loss during the period of constant-rate drying (dotted lines in Fig. 5a and b). In the 1.6 wt% cellulose nanofiber dispersion, the rate of drying was 0.62 mg cm−2 min−1 under 25% R.H. and 0.45 mg cm−2 min−1 under 80% R.H. In pure water, the rate of drying was 0.81 mg cm−2 min−1 under 25% R.H. and 0.56 mg cm−2 min−1 under 80% R.H. As described above, the cellulose nanofiber dispersion had a smaller evaporating surface than pure water without cellulose nanofibers because of surface blockage by cellulose nanofibers. Based on this, when the 1.6 wt% cellulose nanofiber dispersion was dried at 55 °C under 25% R.H., the water occupancy at the surface was:
| 0.62/0.81 × 100 = 76% | (1) |
When the 1.6 wt% cellulose nanofiber dispersion was dried at 55 °C under 80% R.H., the water occupancy at the surface was:
| 0.45/0.56 × 100 = 80% | (2) |
Therefore, these results show that under high-humidity drying, more water was present on the surface of the cellulose nanofiber dispersion compared with low-humidity drying. High-humidity drying increased the water proportion at the surface of the dispersion by increased rate of condensation of water vapor, and the increased amount of water partially disintegrated the nanofiber aggregations in the high-concentration dispersion, as the conventional dilution protocol did. However, because high-humidity drying added the minimum required amount of water, the drying time was not remarkably prolonged.
4. Conclusions
Because the cellulose nanofiber dispersions is highly viscous, cast-drying is preferable to prepare transparent nanopaper. Cellulose nanofibers prepared from holocellulose pulp tend to form inhomogeneous aggregations in higher concentrations of cellulose nanofiber dispersions. Therefore, when the dispersion concentration was increased from 0.24 wt% to 1.81 wt%, the haze of the obtained nanopaper increased from 3.1% to 26.7%, in spite of the shortened drying time. To disintegrate the nanofiber aggregations present in the dispersions, dilution of a high-concentration dispersion was tested. However, using the diluted dispersion, the haze of the nanopaper was not lowered remarkably, and the drying time was drastically increased. In contrast, when the high-concentration nanofiber dispersion was subjected to high-humidity drying, the water proportion at the surface of the dispersion increased, and consequently the nanofiber aggregations were partly disintegrated. As a result, high-humidity drying can realize the preparation of low-haze transparent nanopaper without prolonged drying time. This new technique, high-humidity drying, demonstrated the effectiveness in the nanopaper preparation from highly concentrated dispersion, and will pave the way toward the commercialization of nanopaper-based flexible electronic devices.Conflicts of interest
There are no conflicts to declare.Acknowledgements
This work was financially supported by JSPS KAKENHI Grant Number JP26220908 (to M. N.) from the Japan Society for the Promotion of Science (JSPS) and the JST-Mirai program Grant Number 17843656 (to M. N.) from Japan Science and Technology Agency (JST).References
- M. Nogi, S. Iwamoto, A. N. Nakagaito and H. Yano, Adv. Mater., 2009, 21, 1595–1598 CrossRef CAS.
- M. Nogi, C. Kim, T. Sugahara, T. Inui, T. Takahashi and K. Suganuma, Appl. Phys. Lett., 2013, 102, 181911–181914 CrossRef.
- T. Saito, R. Kuramae, J. Wohlert, L. A. Berglund and A. Isogai, Biomacromolecules, 2013, 14, 248–253 CrossRef CAS PubMed.
- T. Inui, H. Koga, M. Nogi, N. Komoda and K. Suganuma, Adv. Mater., 2015, 27, 1112–1116 CrossRef CAS PubMed.
- H. Zhu, Z. Fang, C. Preston, Y. Li and L. Hu, Energy Environ. Sci., 2014, 7, 269–287 CAS.
- Z. Fang, H. Zhu, C. Preston and L. Hu, Transl. Mater. Res., 2014, 1, 15004 CrossRef.
- Y. Fujisaki, H. Koga, Y. Nakajima, M. Nakata, H. Tsuji, T. Yamamoto, T. Kurita, M. Nogi and N. Shimidzu, Adv. Funct. Mater., 2014, 24, 1657–1663 CrossRef CAS.
- H. Koga, M. Nogi, N. Komoda, T. T. Nge, T. Sugahara and K. Suganuma, NPG Asia Mater., 2014, 6, e93 CrossRef CAS.
- K. Nagashima, H. Koga, U. Celano, F. Zhuge, M. Kanai, S. Rahong, G. Meng, Y. He, J. De Boeck, M. Jurczak, W. Vandervorst, T. Kitaoka, M. Nogi and T. Yanagida, Sci. Rep., 2014, 4, 1–7 Search PubMed.
- M. Nogi, M. Karakawa, N. Komoda, H. Yagyu and T. T. Nge, Sci. Rep., 2015, 5, 17254 CrossRef CAS PubMed.
- T. Saito, Y. Nishiyama, J. L. Putaux, M. Vignon and A. Isogai, Biomacromolecules, 2006, 7, 1687–1691 CrossRef CAS PubMed.
- S. Takaichi, T. Saito, R. Tanaka and A. Isogai, Cellulose, 2014, 21, 4093–4103 CrossRef CAS.
- L. Wågberg, G. Decher, M. Norgren, T. Lindström, M. Ankerfors and K. Axnäs, Langmuir, 2008, 24, 784–795 CrossRef PubMed.
- H. Yagyu, T. Saito, A. Isogai, H. Koga and M. Nogi, ACS Appl. Mater. Interfaces, 2015, 7, 22012–22017 CAS.
- H. Yagyu, S. Ifuku and M. Nogi, Flexible Printed Electron., 2017, 2, 14003 CrossRef.
- H. Fukuzumi, T. Saito, T. Iwata, Y. Kumamoto and A. Isogai, Biomacromolecules, 2009, 10, 162–165 CrossRef CAS PubMed.
- M. Zhao, F. Ansari, M. Takeuchi, M. Shimizu, T. Saito, L. A. Berglund and A. Isogai, Nanoscale Horiz., 2018, 3, 28–34 RSC.
- H. A. Lieberman, M. M. Rieger and G. S. Banker, Pharmaceutical Dosage Form: Disperse System, Marcel Dekker, NY, 1989, vol. 2 Search PubMed.
- R. Xiong, Y. Han, Y. Wang, W. Zhang, X. Zhang and C. Lu, Carbohydr. Polym., 2014, 113, 264–271 CrossRef CAS PubMed.
- J. Cao, X. Sun, C. Lu, Z. Zhou, X. Zhang and G. Yuan, Carbohydr. Polym., 2016, 149, 60–67 CrossRef CAS PubMed.
- M.-C. Hsieh, H. Koga, K. Suganuma and M. Nogi, Sci. Rep., 2017, 7, 41590 CrossRef PubMed.
- K. Uetani and H. Yano, Biomacromolecules, 2011, 12, 348–353 CrossRef CAS PubMed.
- K. Uetani and H. Yano, ACS Macro Lett., 2012, 1, 651–655 CrossRef CAS.
- M. Matsumoto and S. Fujikawa, Microscale Thermophys. Eng., 1997, 1, 119–126 CrossRef CAS.
- M. Matsumoto, K. Yasuoka and Y. Kataoka, Fluid Phase Equilib., 1995, 104, 431–439 CrossRef CAS.
- V. Chakarov, A. Scheludko and M. Zembalat, J. Colloid Interface Sci., 1983, 92, 35–42 CrossRef CAS.
- G. W. Scherer, J. Am. Ceram. Soc., 1990, 73, 3–14 CrossRef CAS.
| This journal is © The Royal Society of Chemistry 2018 |


