 Open Access Article
Creative Commons Attribution 3.0 Unported Licence
Core–shell structured Ag@C nanocables for flexible ferroelectric polymer nanodielectric materials with low percolation threshold and excellent dielectric properties†
Zhihui Chen,
Hengfeng Li *,
Guangyou Xie and
Ke Yang
 *
*
School of Materials Science and Engineering, Central South University, Changsha 410083, China. E-mail: lihf@csu.edu.cn; ykhch@163.com
First published on 15th December 2017
Abstract
Uniform core–shell structured Ag@C nanocables (Ag@C-NC) with high aspect ratio (>600) were synthesized by a one-step hydrothermal method, and their PVDF nanocomposites were prepared by a solution casting method. The crystallization properties, thermal stability and dielectric properties of the resulting Ag@C-NC/PVDF nanocomposites were fully investigated. Because of the presence of the carbonaceous shell, the Ag@C-NC exhibits strong interfacial adhesion with the PVDF matrix, leading to a low percolation threshold and low dielectric loss of the resulting nanocomposites. Near the percolation threshold (fc < 5.49 vol%), high dielectric constant and low dielectric loss were simultaneously achieved in the Ag@C-NC/PVDF nanocomposites. For instance, at 1 kHz, the nanocomposites with 6.45 vol% loading of Ag@C-NC possess a dielectric constant of 295 and a dielectric loss of 0.083. More importantly, the dielectric properties of the resulting Ag@C-NC/PVDF nanocomposites exhibit weak frequency dependence and miniscale temperature dependence.
1. Introduction
The demand of high dielectric constant materials has been increasing significantly, because of rapid growth of high-performance electronic components and electrical equipment, such as embedded capacitors, energy storage devices and actuators.1–6 Compared to conventional ceramic-based dielectric materials, polymer composites possess the merits of easy processing, good flexibility, light weight, and low cost that has become mainstream in the microelectronics industry in recent years.7–9 Thus, flexible polymer nanocomposites with a high dielectric constant are highly desirable and indispensable for practical applications.10–12Previous efforts have revealed two ways for achieving high dielectric constant polymer nanocomposites.13 The more traditional route is introducing high dielectric constant ceramic fillers, such as BaTiO3, PbZrO3, and CaCu3Ti4O12 into the polymer matrix. However, the high loading (usually over 50 vol%) of ceramic fillers required for enhancing dielectric constant, inevitably causes the problems of aggregation and heterogeneity of the ceramic fillers in the polymer matrix, deteriorating the characteristics such as high dielectric loss and poor mechanical properties. Furthermore, the enhancement on dielectric constant is usually low.14–16 Another route focuses on dispersing conductive fillers such as graphene, carbon nanotubes (CNTs), and metal nanoparticles, into polymer matrix to achieve percolative systems.14,17,18 As the loading of the conductive fillers increases in the vicinity of the percolation threshold, where the conductive fillers interconnect to form a continuous conducting path or network, the dielectric constant of the percolative polymer nanocomposites can be remarkably enhanced. Nevertheless, in this approach, the dielectric loss of these percolative polymer nanocomposites increases simultaneously at a fast rate, because of the insulation–conduction transition near the percolation threshold, imposing considerable difficulty and challenge in achieving reproducible and stable products for practical applications.19,20
In recent years, the conductor–insulator core–shell structured nanoparticles have been used as ideal fillers to fabricate percolative polymer nanocomposites with stable high dielectric constant and low dielectric loss.14,21–24 The conductor core is used to enhance the dielectric constant because of the interfacial polarization (namely, Maxwell–Wagner–Sillars effect), and the insulator shell serves as a dielectric interlayer to effectively reduce the dielectric loss through blocking the electron transfer between the adjacent conductor cores.20,25,26 For instance, Dang et al. integrated the Ag@TiO2 core–shell nanoparticles into the PVDF, achieving a dielectric constant of approximately 32 at 100 Hz and a relatively low dielectric loss.27 Zhang et al. successfully prepared Zn@ZnO/PVDF nanocomposites with a dielectric constant as high as 60, while dielectric loss was maintained at 0.07.28 Shen and coworkers utilized Ag@C-nanoparticles as fillers to significantly improve the dielectric constant of the polymer nanocomposites with a low dielectric loss.14 In spite of this, relatively high loading of fillers (>20 vol%) is still needed to just achieve threshold percolation network in these polymer composites, inevitably limiting the characteristics of composites, such as low flexibility and poor mechanical properties.29 Toward these shortcomings, much promising work has been launched in recent years based on the use of high aspect ratio fillers.30–33 Unlike the spherical counterparts, the benefits of using high aspect ratio conductive fillers are two-fold, i.e., (i) high aspect ratio conductive fillers can form conductive paths more easier in the composites, and thus enable the composites with a lower percolation threshold and (ii) their unique morphology also enable the surface energy greatly reduced, thus preventing them from agglomeration inside polymer matrix.34 This fundamental discovery has inspired many researchers to use high aspect ratio fillers to prepare polymer nanocomposites with improved dielectric properties.35
In this study, inspired by the structure of coaxial cable, high aspect ratio core–shell structured Ag@C-NC were prepared and integrated in the PVDF matrix. The interfacial adhesion between the Ag@C-NC and fluoro-polymer matrix was significantly enhanced by the carbonaceous shell. Importantly, the Ag@C-NC can more easily form a percolative network in the PVDF matrix because of their high aspect ratio.
2. Experimental
2.1 Materials
Silver nitrate (AgNO3) was provided by Shanghai Fine Chemical Materials Institute (China). Cetyltrimethyl ammonium bromide (CTAB), D-glucose and N,N-dimethylformamide (DMF) were purchased from Sinopharm Chemical (China). Polyvinylidene fluoride (PVDF) was supplied by Sigma-Aldrich.2.2 Synthesis of Ag@C nanocables
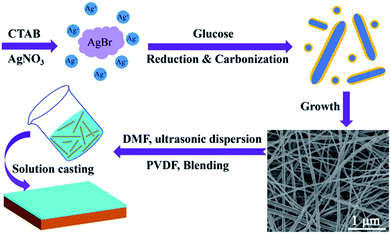
Ag@C-NC were synthesized under hydrothermal conditions.36 In a typical procedure, 0.0051 g of AgNO3 was dissolved in 60 mL deionized water, followed by adding 0.0195 g of glucose into the solution. Next, to that solution, 0.6558 g of CTAB was added slowly under vigorous stirring. The color of the mixed solution gradually turned light yellow, the resultant solution was transferred to 100 mL Teflon-lined autoclave, then put it in an oven at 180 °C for 24 h. The products were washed repeatedly with deionized water and absolute ethanol, the Ag@C-NC was collected by centrifugation.2.3 Preparation of Ag@C-NC/PVDF films
Ag@C-NC/PVDF nanocomposite films were prepared by the solution cast method. A certain amount of PVDF was first dissolved in DMF and stirred for 4 h at 60 °C. At the same time, a desired amount of Ag@C-NC was also dispersed in 15 mL DMF by sonication for 10 min. Then, the two solutions were mixed and stirred vigorously at 80 °C for 10 h. Afterwards, the solution was cast onto a polished glass, horizontally installed in a vacuum oven and then heated to 60 °C for 12 h for evaporating the solvent. The resulted films were annealed at 130 °C for 6 h, affording nanocomposites with an average thickness in the range 40–60 μm. The volume fractions of the fillers were determined from the weight fractions by using the density values. The Ag@C-NC contents of nanocomposites were fixed at 3, 6, 9, 12, 15, 18, 21 wt%, corresponding to volume concentration of 1.06, 2.17, 3.24, 4.29, 5.38, 6.45 and 7.66 vol%, respectively. The volume content (ϕvol) of Ag@C-NC can be determined from the following equation:where ϕwt represents the Ag@C-NC weight concentration, ρAg@C-NC and ρPVDF are the density of Ag@C-NC (6.1 g cm−3) and PVDF (1.74 g cm−3), respectively. The densities of the as-prepared Ag@C-NC were estimated to be about 6.1 g cm−3, by using the densities of silver core (10.5 g cm−3) and the carbonaceous shell (1.5 g cm−3), and the geometric sizes of the core and the shell.
2.4 Characterization
The crystal structure of the Ag@C-NC and nanocomposites were examined by X-ray diffraction (XRD, Rigaku D-Max/2550VB+) equipped with Cu Kα radiation (λ = 1.5418 Å). The morphology and microstructure of the samples were observed by transmission electron microscopy (TEM, JEM-2010, Japan) operated at an accelerating voltage at 200 kV. Fourier-transform infrared (FT-IR) spectra were recorded using a FTIR spectrophotometer (Nicolet 6700) under attenuated total reflection-infrared (ATR-IR) mode. Scanning electron microscopy (SEM) images of the samples were taken on a field-emission scanning electron microscope (JEM-6390, JEOL, Japan) under controlled voltage. The UV-vis absorption spectrum of the Ag@C-NC was recorded on Shimadzu UV-2450 spectrophotometer. Raman spectroscopy Renishaw RM1000 (Gloucestershire, UK) were used to characterize the chemical element composition of Ag@C-NC. Thermogravimetric analysis (TGA) of the nanocomposite films was performed using a NETZSCH STA 449 instrument with a heating rate of 10 °C min−1 under nitrogen flow (20 mL min−1). The crystallization and melting behavior of the nanocomposite films were investigated by differential scanning calorimetry (DSC) (DSC-200, NETZSCH, Germany) analysis. The dielectric and electrical responses were measured using a precision impedance analyzer (Keysight E4990A) with the frequency range 102–107 Hz.3. Results and discussion
3.1 Characterization of Ag@C nanocables
The silver nanocables coated with a layer of carbonaceous shell were prepared by the hydrothermal method as illustrated in Scheme 1. Fig. 1a shows the UV-vis spectrum of the Ag@C-NC suspension in water, exhibiting a main peak at 386 nm and a shoulder peak at 360 nm, corresponding to the optical fingerprint of Ag nanocables. In the X-ray diffraction patterns of the Ag@C-NC (Fig. 1b), there are four peaks at the 2θ values of 38.12, 44.32, 65.54, and 77.38° in the range from 10° to 80°, attributed to the (111), (200), (220), and (311) characteristic peaks respectively of the face-centered silver lattice of Ag (0). An additional broad peak at the 2θ value of approximately 25° is attributed to the amorphous carbon, indicating that silver nanocable incorporated with amorphous carbon. The silver lattice constant calculated from this XRD pattern was 4.085 Å, highly coincide with the literature value of 4.086 Å (JCPDS card file no. 04-0783).37 It is noteworthy that the intensity ratio between (111) and (200) peaks shows a relatively high value of 3.82 (the theoretical value is 2.5), which indicating an enrichment of (111) crystalline planes. In other words, the growth rate of the crystal along the (111) crystal plane was faster than those of the other crystal planes, and thus one-dimensional structural Ag@C-NC were successfully obtained. The carbonaceous shell in Ag@C-NC were investigated by FTIR spectroscopy, as shown in Fig. 1c. A few functional groups such as –OH, C–O, and C![[double bond, length as m-dash]](https://www.rsc.org/images/entities/char_e001.gif) C were observed on the carbonaceous shell, which provided better compatibility between the silver nanocable and the polymer matrix. There are two strong peaks at 1597 and 1378 cm−1 in the Raman spectra (Fig. 1d), which are ascribed to the crystalline graphite and in-plane vibrations of the disordered amorphous carbon, respectively. In addition, the curve showed two weak peaks at 2936 and 232 cm−1, attributed to the asymmetric stretching vibration of –CH– and the stretching vibrations of Ag–O, respectively.
C were observed on the carbonaceous shell, which provided better compatibility between the silver nanocable and the polymer matrix. There are two strong peaks at 1597 and 1378 cm−1 in the Raman spectra (Fig. 1d), which are ascribed to the crystalline graphite and in-plane vibrations of the disordered amorphous carbon, respectively. In addition, the curve showed two weak peaks at 2936 and 232 cm−1, attributed to the asymmetric stretching vibration of –CH– and the stretching vibrations of Ag–O, respectively.
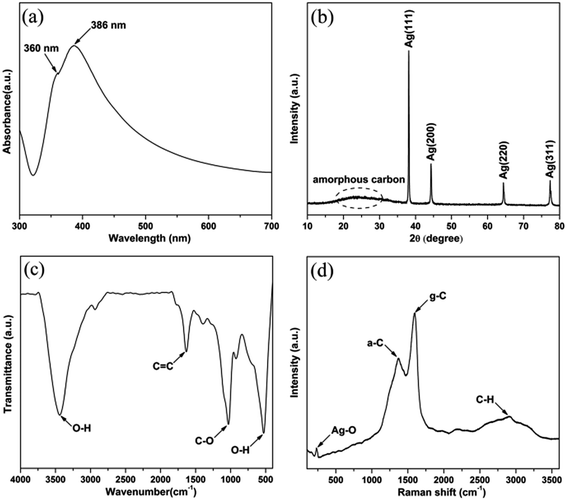 | ||
| Fig. 1 (a) UV-vis spectra, (b) X-ray diffraction pattern, (c) FTIR spectrum, (d) Raman spectra of the Ag@C-NC. | ||
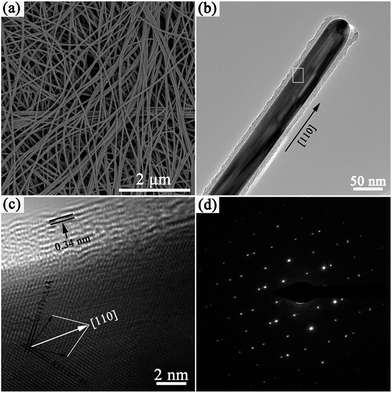
The morphologies and sizes of the Ag@C-NC were observed by SEM and TEM. As shown in Fig. 2a, slim Ag@C-NC show excellent flexibility, indicating potential processability for subsequent nanodevice fabrication. The Ag@C-NC exhibit a high aspect ratio (>600) with an average length of 46.5 μm and an average diameter of approximately 72 nm. The TEM image of a single nanocable in Fig. 2b shows that the product consists of a silver core of about 50 nm in diameter and a carbonaceous shell of about 10 nm in thickness. The high-resolution transmission electron microscopy (HRTEM) image of an individual Ag@C-NC was showed in Fig. 2c. Both of the two sets of spacing of the silver lattice planes are 2.4 Å, consistent with the literature value of 2.36 Å for the Ag {111} planes. The normal directions of the Ag (111) and Ag (11![[1 with combining macron]](https://www.rsc.org/images/entities/char_0031_0304.gif) ) planes (two black arrows in Fig. 2c) indicated that the Ag nanocable core grew along the [110] direction. The layer distance of the outer carbonaceous shell is approximately 0.34 nm, coincide with the standard layer distance of graphite.38 The SAED pattern (Fig. 2d) recorded from the Ag nanocable core consists of two sets of spots, revealing that the Ag nanocable core is a twin crystal.
) planes (two black arrows in Fig. 2c) indicated that the Ag nanocable core grew along the [110] direction. The layer distance of the outer carbonaceous shell is approximately 0.34 nm, coincide with the standard layer distance of graphite.38 The SAED pattern (Fig. 2d) recorded from the Ag nanocable core consists of two sets of spots, revealing that the Ag nanocable core is a twin crystal.
3.2 Microstructure of Ag@C-NC/PVDF nanocomposites
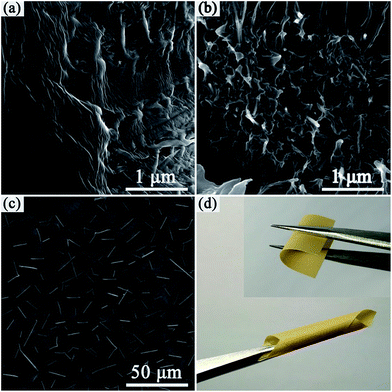
The freeze-fractured cross section of the nanocomposite films was observed by SEM, as shown in Fig. 3a, the neat PVDF film showed a smooth and dense homogeneous microstructure. Ag@C nanocables are clearly observed in the Ag@C-NC/PVDF nanocomposites (see Fig. 3b), which are uniformly dispersed and embedded in the PVDF matrix. SEM image of top surface of Ag@C-NC/PVDF nanocomposites with 7.66 vol% Ag@C-NC is shown in Fig. 3c, where a large number of high aspect ratio Ag@C-NC were observed and with no obvious agglomeration. The bottom surface SEM images of the Ag@C-NC/PVDF nanocomposites (see Fig. S1†) further confirm that the Ag@C-NC was well dispersed inside the nanocomposites. Since all the silver nanocables are coated by carbonaceous shells, the hydroxyl groups in the carbonaceous shells can form powerful dipole–dipole interactions with the fluorine atoms of PVDF. Thus, the Ag@C-NC maintained excellent dispersion and compatibility in the PVDF matrix. Furthermore, the outstanding microstructural integrity combined with low loading of Ag@C-NC endows the Ag@C-NC/PVDF nanocomposites with excellent flexibility. As shown in Fig. 3d, the Ag@C-NC/PVDF nanocomposites with 7.66 vol% of Ag@C-NC is capable of being bent and rolled.3.3 Crystal structure of Ag@C-NC/PVDF nanocomposites
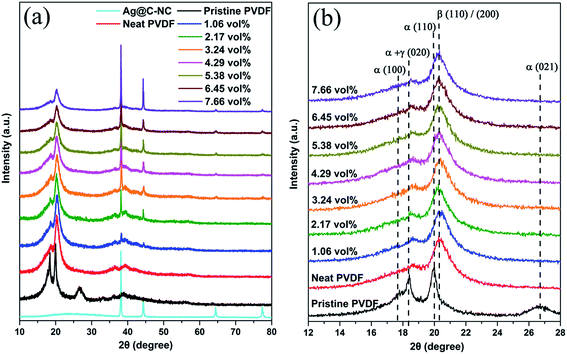
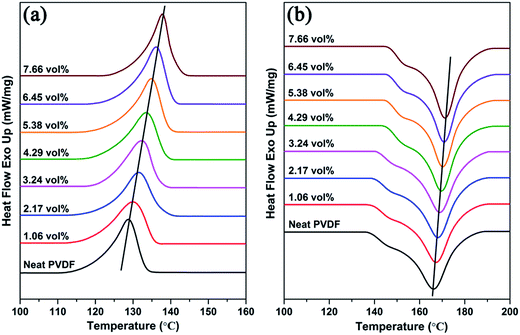
Since the PVDF is a semi-crystalline polymer, the effect of the addition of Ag@C-NC on the phases and crystallinity of the polymer matrix were investigated by XRD and ATR-FTIR. Earlier studies have demonstrated that the PVDF mainly has four crystalline phases (α, β, γ, and δ), and the ferroelectric β phase is more desirable in many applications due to its large dipolar moment. The X-ray diffraction patterns of the neat PVDF, and Ag@C-NC/PVDF nanocomposites with different loading are shown in Fig. 4. The XRD pattern of Ag@C-NC is also shown at the bottom for comparison. The characteristic diffraction peaks of Ag@C-NC can be observed in the nanocomposites with different loading of Ag@C-NC. All of the Ag@C-NC/PVDF nanocomposites had a strong peak at 20.26°, corresponding to the ferroelectric β phase. There are no changes in the diffraction peak position of PVDF in the Ag@C-NC/PVDF nanocomposites with different loading, implying that the filler of Ag@C-NC has no effect on the crystalline phases of the PVDF. The same conclusion was drawn from the ATR-FTIR spectra of Ag@C-NC/PVDF nanocomposites with different loading (Fig. S2†).The DSC heating and cooling curves of neat PVDF and the Ag@C-NC/PVDF nanocomposites are plotted in Fig. 5, the corresponding data are listed in Table 1. As displayed in Fig. 5a, the crystallization temperature (Tc) for all the Ag@C-NC/PVDF nanocomposites are higher than that of the neat PVDF and continually increases with increasing loading of Ag@C-NC. These elevated crystallization temperature (Tc) can be explained by considering the effect of Ag@C-NC accelerating the crystallization rate of PVDF. The presence of substantial polar functional groups in the outer carbonaceous shell of Ag@C-NC, which is very beneficial for the nucleation for PVDF. Therefore, enhancing the degree of mass crystallinity (Xc) of the nanocomposites by the addition of Ag@C-NC.
| Sample | Tm (°C) | Tc (°C) | ΔHm (J g−1) | Xc (%) |
|---|---|---|---|---|
| Neat PVDF | 166.3 | 128.3 | 50.13 | 47.92 |
| 1.06 vol% | 167.4 | 130.4 | 52.25 | 49.96 |
| 2.17 vol% | 168.2 | 131.7 | 53.56 | 51.21 |
| 3.24 vol% | 168.9 | 132.4 | 54.76 | 52.35 |
| 4.29 vol% | 169.5 | 133.5 | 56.70 | 54.21 |
| 5.38 vol% | 170.2 | 134.7 | 58.33 | 55.76 |
| 6.45 vol% | 170.8 | 136.3 | 59.66 | 57.04 |
| 7.66 vol% | 171.2 | 137.7 | 60.51 | 57.85 |
As shown in Fig. 5b, the melting temperature (Tm) of the Ag@C-NC/PVDF nanocomposites increased monotonically as the loading of Ag@C-NC increased, indicating that the Ag@C-NC affect the melting behavior of PVDF. Another noteworthy aspect during the melting process of these nanocomposites is the multi-melting phenomenon, which has been observed in DSC curves of many semi-crystalline polymers, has attracted a variety of theoretical and experimental investigations.39 The possible origin of this phenomenon may be ascribed to (i) melting, re-crystallization, and re-melting during the heating process; (ii) variation in morphology (such as lamellar thickness, distribution, perfection, or stability); (iii) physical aging or/and relaxation of the rigid amorphous fraction; (iv) different molecular weight species and so on.40
3.4 Thermal stability of Ag@C-NC/PVDF nanocomposites
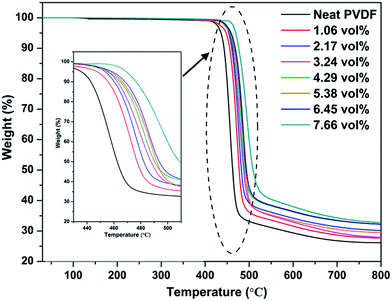
The thermal stability of the Ag@C-NC/PVDF nanocomposites was evaluated with TGA measurement, and the corresponding degradation curves were shown in Fig. 6. Both the degradation curves of the neat PVDF and Ag@C-NC/PVDF nanocomposites exhibit similar tendency. On the other hand, compared to the neat PVDF, the degradation behavior of Ag@C-NC/PVDF nanocomposites show a remarkable hysteresis and their degradation curves shift to higher temperatures. The T10% (defined as the temperature at 10% weight loss) of the neat PVDF is 442.5 °C, whereas those of the Ag@C-NC/PVDF nanocomposites gradually increase with the loading of Ag@C-NC. This observation demonstrated that the introduction of Ag@C-NC in PVDF caused better thermal stability, and was attributed to the following factors: (i) good thermal transmission property and homogeneous dispersion of Ag@C-NC effectively reduce the decomposition rate of the nanocomposites; (ii) the strong interaction between the PVDF chains and the polar groups in the surface of Ag@C-NC restrict the movements of PVDF chains and thus enhance the thermal stability of the PVDF.3.5 Dielectric properties of Ag@C-NC/PVDF nanocomposites
The dielectric constant, dielectric loss, and electrical conductivity of all the samples as a function of frequency at room temperature are shown in Fig. 7. For the Ag@C-NC/PVDF nanocomposites, their dielectric constants show weak frequency dependence in the whole frequency range, which caused by the lagging effects of polarization with the external electrical field. Furthermore, the dielectric constant of the Ag@C-NC/PVDF nanocomposites increases with increasing loading of Ag@C-NC. The increment in the dielectric constant was ascribed to the formation of microcapacitor and the enhancement of interfacial polarization in the Ag@C-NC/PVDF nanocomposites, often occurring in the dielectric composites with conductive fillers. Fig. 7b shows that all the Ag@C-NC/PVDF nanocomposites exhibit relatively low dielectric loss in a wide frequency range (100 Hz to 100 kHz). The nanocomposite with 6.45 vol% of Ag@C-NC exhibits a relatively high dielectric constant (295) at a frequency of 1 kHz, the dielectric loss is only 0.083, which is much smaller than most of the data reported previously at the same dielectric constant. The low value of dielectric loss was ascribed to the carbonaceous shells, which function as a dielectric layer to curb the leakage of current resulted from the direct contact of silver nanocables. Furthermore, the dielectric loss of Ag@C-NC/PVDF nanocomposites are gradually comparable to that of the neat PVDF at high frequency range (1–10 MHz) with a relaxation, which is related to the glass transition relaxation of PVDF. Fig. 7c shows the effects of frequency on the electrical conductivity of the Ag@C-NC/PVDF nanocomposites, the electrical conductivity of all samples shows a strong dependence of frequency at the whole frequency range, and meanwhile the electrical conductivity of the nanocomposites increases with increasing loading of Ag@C-NC. For example, the neat PVDF is completely insulated with an electrical conductivity of 1.01 × 10⁻⁹ S m−1 at the frequency of 1 kHz, while the Ag@C-NC/PVDF nanocomposites with 7.66 vol% Ag@C-NC exhibits an electrical conductivity of 7.43 × 10⁻⁷ S m−1 at the same frequency. However, all the Ag@C-NC/PVDF nanocomposites show significantly low electrical conductivity, suggesting that all the nanocomposites are still insulated. The excellent electrical insulativity is beneficial to maintain the dielectric loss at a relatively low level, because it avoids the leakage current in the composites. As described before, the carbonaceous shells of Ag@C-NC can effectively suppress the leakage current inside the composites, thus enable the Ag@C-NC/PVDF nanocomposites possess relatively low electrical conductivity and dielectric loss. | ||
| Fig. 7 Dependence of (a) dielectric constant, (b) dielectric loss, and (c) electrical conductivity on frequency of Ag@C-NC/PVDF nanocomposites. | ||
Fig. 8a show variations of dielectric constant with the volume fraction of the Ag@C-NC for the nanocomposites at 1 kHz. The dielectric constants of the Ag@C-NC/PVDF nanocomposites increase gradually with increasing the Ag@C-NC loading, but it increases dramatically when the Ag@C-NC loading approached to 5.38 vol%. The dielectric constant of the nanocomposites with 6.45 vol% Ag@C-NC achieves a value of 295, which is about 32 times higher than that of neat PVDF. The variations of the dielectric constant are in good accordance with the following power law:
 | (1) |
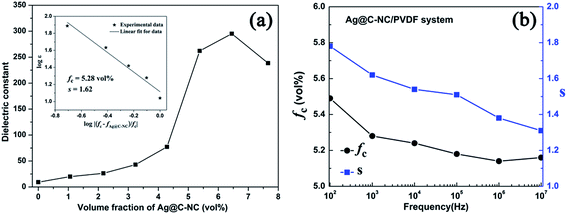 | ||
| Fig. 8 (a) Variations of dielectric constant with the volume fraction of the Ag@C-NC for Ag@C-NC/PVDF nanocomposites at 1 kHz. Inset figure shows the fitting curve using eqn (1). (b) The fitting constant fc and s of eqn (1) using dielectric constant at different frequencies versus the frequency used. | ||
The effect of frequency on the fitting results were also studied from 100 Hz to 10 MHz. It is found that both the fitting constant fc and s change with the frequency selected as shown in Fig. 8b. From Fig. 8b, one can find that the fitting constant fc is in the range from 5.16 vol% to 5.49 vol%, while the fitting constant s is in the range from 1.31 to 1.78. Those results illustrate that the percolation threshold of the Ag@C-NC/PVDF nanocomposites in a wide range of frequency is still low (fc < 5.49 vol%), and the fitting constant s is also reasonable.41,42
Temperature dependence of the dielectric constant and dielectric loss of the Ag@C-NC/PVDF nanocomposites at 1 kHz is shown in Fig. 9. The dielectric constant and dielectric loss of all nanocomposites slightly increased with increasing temperature as shown in Fig. 9a, owing to an induction of polarization at high temperatures. Fig. 9b shows a clear increase in the dielectric loss with increasing temperature for all nanocomposites and also for neat PVDF. An increase in temperature increases the molecular polarization of PVDF and the conductivity of the Ag core in Ag@C-NC, leading to the increase in conductivity, and hence the dielectric loss of the Ag@C/PVDF nanocomposites.
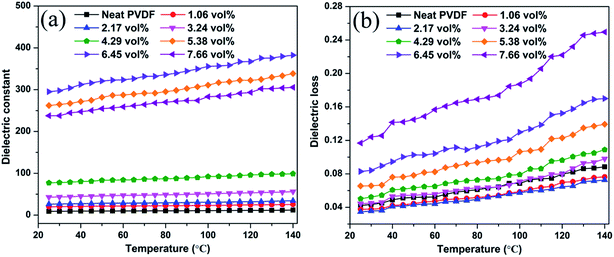 | ||
| Fig. 9 Temperature dependence of (a) the dielectric constant and (b) dielectric loss of Ag@C-NC/PVDF nanocomposites at 1 kHz. | ||
To further study the temperature dependence of the dielectric properties, a temperature coefficient (Temp-Coef) is defined as:
 | (2) |
4. Conclusions
Uniform core–shell structured Ag@C-NC with high aspect ratio (>600) were synthesized by a one-step hydrothermal method, and their nanocomposites with PVDF were prepared by the solution casting method. The carbonaceous shells were introduced onto the surface of Ag nanocables, improving the compatibility between the Ag@C-NC and the PVDF matrix and ensure low dielectric loss of the constructed threshold percolation network in the polymer matrix. The effect of the Ag@C-NC on the phase transformation of the crystalline PVDF was not so obvious. The thermal stability of Ag@C-NC/PVDF nanocomposites enhanced with the addition of Ag@C-NC. The low percolation threshold (fc < 5.49 vol%) obtained for the Ag@C-NC/PVDF nanocomposites attributed to the high aspect ratio of the core-shell structured Ag@C-NC. The Ag@C-NC/PVDF nanocomposites showed a dielectric constant of 295 and a dielectric loss of 0.084 at 1 kHz for 6.45 vol% loading of Ag@C-NC. More importantly, the as-prepared dielectric nanocomposites displayed weak frequency dependence and miniscale temperature dependence. Therefore, the resulting Ag@C-NC/PVDF nanocomposites exhibit high potential application in the electronic and electric industry such as printed circuit boards. This work also opens up a new route for preparing flexible nanocomposites with low percolation threshold and excellent dielectric properties.Conflicts of interest
There are no conflicts to declare.Acknowledgements
The authors gratefully acknowledge supports from the National Natural Science Foundation of China (No. 51573209).References
- Z. M. Dang, J. K. Yuan, S. H. Yao and R. J. Liao, Adv. Mater., 2013, 25, 6334–6365 CrossRef CAS PubMed.
- L. Huang, P. Zhu, G. Li, D. Lu, R. Sun and C. Wong, J. Mater. Chem. A, 2014, 2, 18246–18255 CAS.
- X. Huang and P. Jiang, Adv. Mater., 2015, 27, 546–554 CrossRef CAS PubMed.
- C. Li, S. Yu, S. Luo, W. Yang, Z. Ge, H. Huang, R. Sun and C.-P. Wong, RSC Adv., 2016, 6, 36450–36458 RSC.
- H. Tang and H. A. Sodano, Nano Lett., 2013, 13, 1373–1379 CrossRef CAS PubMed.
- Q. M. Zhang, H. Li, M. Poh, F. Xia, Z. Y. Cheng, H. Xu and C. Huang, Nature, 2002, 419, 284–287 CrossRef CAS PubMed.
- Q. Li, L. Chen, M. R. Gadinski, S. Zhang, G. Zhang, H. Li, A. Haque, L.-Q. Chen, T. Jackson and Q. Wang, Nature, 2015, 523, 576–579 CrossRef CAS PubMed.
- Z. Pan, J. Zhai and B. Shen, J. Mater. Chem. A, 2017, 5, 15217–15226 CAS.
- Y. Shen, Y. Lin and Q. M. Zhang, MRS Bull., 2015, 40, 753–759 CrossRef CAS.
- H. Jiang, P. S. Lee and C. Li, Energy Environ. Sci., 2013, 6, 41–53 CAS.
- J. Li, P. Khanchaitit, K. Han and Q. Wang, Chem. Mater., 2010, 22, 5350–5357 CrossRef CAS.
- C. Wu, L. Fang, X. Huang and P. Jiang, ACS Appl. Mater. Interfaces, 2014, 6, 21026–21034 CAS.
- Prateek, V. K. Thakur and R. K. Gupta, Chem. Rev., 2016, 116, 4260–4317 CrossRef CAS PubMed.
- Y. Shen, Y. H. Lin and C. W. Nan, Adv. Funct. Mater., 2007, 17, 2405–2410 CrossRef CAS.
- L. Xie, X. Huang, C. Wu and P. Jiang, J. Mater. Chem., 2011, 21, 5897–5906 RSC.
- Y. Thakur, B. Zhang, R. Dong, W. Lu, C. Iacob, J. Runt, J. Bernholc and Q. M. Zhang, Nano Energy, 2017, 32, 73–79 CrossRef CAS.
- W. Tong, Y. Zhang, Q. Zhang, X. Luan, Y. Duan, S. Pan, F. Lv and Q. An, Carbon, 2015, 94, 590–598 CrossRef CAS.
- Z. M. Dang, M. S. Zheng and J. W. Zha, Small, 2016, 12, 1688–1701 CrossRef CAS PubMed.
- C. Wu, X. Huang, L. Xie, X. Wu, J. Yu and P. Jiang, J. Mater. Chem., 2011, 21, 17729–17736 RSC.
- Y. Shen, Y. Lin, M. Li and C. W. Nan, Adv. Mater., 2007, 19, 1418–1422 CrossRef CAS.
- J. Fu, Y. Hou, Q. Wei, M. Zheng, M. Zhu and H. Yan, J. Appl. Phys., 2015, 118, 235502 CrossRef.
- M. Zhu, X. Huang, K. Yang, X. Zhai, J. Zhang, J. He and P. Jiang, ACS Appl. Mater. Interfaces, 2014, 6, 19644–19654 CAS.
- J. Fu, Y. Hou, M. Zheng, Q. Wei, M. Zhu and H. Yan, ACS Appl. Mater. Interfaces, 2015, 7, 24480–24491 CAS.
- X. Kuang, Z. Liu and H. Zhu, J. Appl. Polym. Sci., 2013, 129, 3411–3416 CrossRef CAS.
- W. Zhou, Z. Wang, L. Dong, X. Sui and Q. Chen, Composites, Part A, 2015, 79, 183–191 CrossRef CAS.
- Z.-M. Dang, J.-K. Yuan, J.-W. Zha, T. Zhou, S.-T. Li and G.-H. Hu, Prog. Mater. Sci., 2012, 57, 660–723 CrossRef CAS.
- Z.-M. Dang, S.-S. You, J.-W. Zha, H.-T. Song and S.-T. Li, Phys. Status Solidi A, 2010, 207, 739–742 CrossRef CAS.
- Y. Zhang, Y. Wang, Y. Deng, M. Li and J. Bai, ACS Appl. Mater. Interfaces, 2012, 4, 65–68 CAS.
- K. Yang, X. Huang, L. Fang, J. He and P. Jiang, Nanoscale, 2014, 6, 14740–14753 RSC.
- Z. Pan, L. Yao, J. Zhai, D. Fu, B. Shen and H. Wang, ACS Appl. Mater. Interfaces, 2017, 9, 4024–4033 CAS.
- H. Tang, Y. Lin and H. A. Sodano, Adv. Energy Mater., 2013, 3, 451–456 CrossRef CAS.
- H. Luo, J. Roscow, X. Zhou, S. Chen, X. Han, K. Zhou, D. Zhang and C. R. Bowen, J. Mater. Chem. A, 2017, 5, 7091–7102 CAS.
- L. Wang, X. Piao, H. Zou, Y. Wang and H. Li, Appl. Phys. A: Mater. Sci. Process., 2015, 118, 243–248 CrossRef CAS.
- Y. Song, Y. Shen, H. Liu, Y. Lin, M. Li and C.-W. Nan, J. Mater. Chem., 2012, 22, 16491–16498 RSC.
- D. A. V. D. Ende, S. E. V. Kempen, X. Wu, W. A. Groen, C. A. Randall and S. V. D. Zwaag, J. Appl. Phys., 2012, 111, 124107 CrossRef.
- C. Chen, B. H. R. Suryanto, C. Zhao, X. Jiang and A. Yu, Small, 2015, 11, 3557–3567 CrossRef CAS PubMed.
- F. Zhen, T. Kaibin, L. Shuijin and L. Tanwei, Nanotechnology, 2006, 17, 3008 CrossRef.
- A. K. Geim, Science, 2009, 324, 1530–1534 CrossRef CAS PubMed.
- M. Pyda and B. Wunderlich, J. Polym. Sci., Part B: Polym. Phys., 2000, 38, 622–631 CrossRef CAS.
- T. Liu and J. Petermann, Polymer, 2001, 42, 6453–6461 CrossRef CAS.
- L. Zhang, Z. Liu, X. Lu, G. Yang, X. Zhang and Z. Y. Cheng, Nano Energy, 2016, 26, 550–557 CrossRef CAS.
- L. Zhang, S. Chen, S. Yuan, D. Wang, P.-H. Hu and Z.-M. Dang, Appl. Phys. Lett., 2014, 105, 052905 CrossRef.
- X. Shan, L. Zhang, X. Yang and Z. Y. Cheng, J. Adv. Ceram., 2012, 1, 310–316 CrossRef CAS.
Footnote |
| † Electronic supplementary information (ESI) available. See DOI: 10.1039/c7ra12686g |
| This journal is © The Royal Society of Chemistry 2018 |


