 Open Access Article
Au-doped Li1.2Ni0.7Co0.1Mn0.2O2 electrospun nanofibers: synthesis and enhanced capacity retention performance for lithium-ion batteries
Bin Yue,
Xinlu Wang ,
Jinxian Wang
 *,
Jing Yao,
Xinru Zhao,
Hongbo Zhang,
Wensheng Yu,
Guixia Liu
 and
Xiangting Dong
Key Laboratory of Applied Chemistry and Nanotechnology at Universities of Jilin Province, Changchun University of Science and Technology, Changchun 130022, China. E-mail: wjx87@sina.com
First published on 23rd January 2018
Abstract
The Au-doped Li1.2Ni0.7Co0.1Mn0.2O2 (Au = 0%, 1%, 2%, 3%, 4%) nanofibers are successfully prepared by electrospinning technology. The impact of Au doping on the structure, morphology and electrochemical properties of samples is studied in detail. The X-ray diffraction patterns demonstrate that appropriate Au-doping does not significantly change the structure of Li1.2Ni0.7Co0.1Mn0.2O2. Scanning electron microscope images revealed the electrospun nanofibers have uniform particle size in the range of 300–400 nm. The optimum doping amount of Au is 2% in Li1.2Ni0.7Co0.1Mn0.2O2 to obtain high discharge capacity and excellent capacity retention. Electrochemical impedance spectroscopy test results elucidated that the LNCMA-2% cell has excellent Li+ electrical conductivity and lower charge transfer resistance. The results show that stable structure with good particle contact of the Au-doped cathode materials can enhance electrochemical properties, which can be interpreted as an important inhibition of phase transitions and increased charge transfer impedance during cycling.
1. Introduction
Lithium-ion batteries (LIBs) are extensively utilized as electrochemical power sources for industrial applications, particularly in the field of electric vehicles (EVs) and hybrid electric vehicles (HEVs) owing to their significant electrochemical behavior. Research and development for high capacity, low price and safe cathode materials is critical for LIBs to meet the demands of potential applications. Due to the imperfections of LiCoO2, such as high cost and toxicity of cobalt, LiMnO2 and LiNiO2 have drawn increasing attention as natural substitutes. However, they are hard to synthesize due to the fact that their structure is precarious during the annealing process. In addition, phase transition easily takes place during charge–discharge process, resulting in poor cyclic retention.1 Therefore, the layered oxide LiMO2 (M = Mn, Ni, Co), which has been explored in detail, is considered as one of the most promising substitutions of cathode materials2–12 owing to its adequate resources, lower toxicity, and low cost.13,14 However, the poor capacity retention at a high operating voltage of >4.3 V or high current density restricts its application; also, the mechanism of capacity fading has not been systematically and comprehensively understood.15 Accordingly, further research to increase both Ni content and the cutoff voltage to more than 4.5 V is being carried out to improve the energy density of cathodes.16–19 Ni-rich LiNixCoyMn1−x−yO2 electrodes display excellent discharge capacity. The discharge capacity increases on increasing the Ni content, but the detrimental thermal instability was attributed to the higher Ni2+ amount in Ni-rich materials. The cathode could be partially transformed into an electrochemically inactive NiO-like phase or spinel structure because of volumetric changes20,21 ascribed to the migration of the Ni cations from the transition metal (TM) layers to the lithium layers. In addition, the increased formation of NiO phase leads to capacity fading. The undesired changes of volume could be responsible for the pulverization of the active materials, which were detached from the secondary particles, leading to the increase in cell impedance.22,23 Moreover, there are several intrinsic problems with the Ni-rich LiNixCoyMn1−x−yO2 that need to be solved. The electrodes always suffer from low discharge capacity and inferior rate performance due to low electric and ionic conductivity and poor capacity retention arising from the dissolution of Mn during long-term cycling.24 Consequently, their application in practical LIBs has been impeded by these defects. To compensate for the above problems of LiNixCoyMn1−x−yO2, numerous studies have been performed to optimize similar materials using new synthesis methods, coatings and substitutes for Ni, Mn, or Co, oxides, phosphates, carbon and fluorides have been used for surface modification and proved to be an effective way to hinder dissolution of transition metals and undesired reactions between cathode and electrolyte.25–31 The coated layer could suppress the undesired surface side reactions and enhance the cyclic stability of layered oxides. However, the thickness of the coating layer must be carefully controlled to avoid hindering the active Li diffusion responsible for heavy coating layers. Moreover, the electrochemical properties can be enhanced by doping ions,32–34 which can prevent structure transformations and enhance the diffusivity of electrons and lithium ions in the cathode materials. A number of elements such as Ti,35 Cr,36 Mg,37,38 K,39 Ru,40 Al,41 Fe,42 Zn,43 Si,44 Ga,45 Mo,46,47 Ce,48 and F49 have been reported for partial substitution of Ni, Mn, or Co to improve electrochemical performance of the cathode materials. However, to the best of our knowledge, research on the electrochemical performance of electrode-active materials doped by precious metals (Pt, Au, and Ag) is seldom reported.Herein, we focused on substituting Au for Mn, to explore whether Au doping has any impact on this process. Au is incorporated into Li1.2Ni0.7Co0.1Mn0.2O2 by a novel approach of electrospinning technology. The effectiveness of Au substitutions on the structure, morphology and electrochemical characterizations of Li1.2Ni0.7Co0.1Mn0.2O2 was investigated in detail.
2. Experimental
2.1. Materials
Lithium nitrate (LiNO3, AR, 99%, Aladdin Chemistry Co. Ltd., China), nickel nitrate (Ni(NO3)2·6H2O, AR, 99%, Aladdin Chemistry Co. Ltd., China), cobalt nitrate (Co(NO3)2·6H2O, AR, 99%, Aladdin Chemistry Co. Ltd., China), manganese nitrate (Mn(NO3)2, AR, 50%, Aladdin Chemistry Co. Ltd., China), and gold acid tetrahydrate (AuCl3·HCl·4H2O, AR, 99%, Aladdin Chemistry Co. Ltd., China) were used as the starting materials. Acetylene black, polyvinylidene fluoride (PVDF) and N-methyl-2-pyrrolidone (NMP) were bought from Sinopharm Chemical Reagent Co. Ltd. All chemicals were of analytical grade and used without further purification.2.2. Preparation of Au-doped Li1.2Ni0.7Co0.1Mn0.2O2
Li, Ni, Co and Mn nitrate salts and Au chlorate were dissolved in dimethylformamide (DMF) and mixed with aqueous solution of polyvinylpyrrolidone (PVP) according to the cationic ratio of Li![[thin space (1/6-em)]](https://www.rsc.org/images/entities/char_2009.gif) :
:![[thin space (1/6-em)]](https://www.rsc.org/images/entities/char_2009.gif) Ni
Ni![[thin space (1/6-em)]](https://www.rsc.org/images/entities/char_2009.gif) :
:![[thin space (1/6-em)]](https://www.rsc.org/images/entities/char_2009.gif) Co
Co![[thin space (1/6-em)]](https://www.rsc.org/images/entities/char_2009.gif) :
:![[thin space (1/6-em)]](https://www.rsc.org/images/entities/char_2009.gif) Mn
Mn![[thin space (1/6-em)]](https://www.rsc.org/images/entities/char_2009.gif) :
:![[thin space (1/6-em)]](https://www.rsc.org/images/entities/char_2009.gif) Au = 1.2
Au = 1.2![[thin space (1/6-em)]](https://www.rsc.org/images/entities/char_2009.gif) :
:![[thin space (1/6-em)]](https://www.rsc.org/images/entities/char_2009.gif) 0.7
0.7![[thin space (1/6-em)]](https://www.rsc.org/images/entities/char_2009.gif) :
:![[thin space (1/6-em)]](https://www.rsc.org/images/entities/char_2009.gif) 0.1
0.1![[thin space (1/6-em)]](https://www.rsc.org/images/entities/char_2009.gif) :
:![[thin space (1/6-em)]](https://www.rsc.org/images/entities/char_2009.gif) 0.2
0.2![[thin space (1/6-em)]](https://www.rsc.org/images/entities/char_2009.gif) :
:![[thin space (1/6-em)]](https://www.rsc.org/images/entities/char_2009.gif) X (X = 0%, 1%, 2%, 3%, and 4%), which was used to prepare nanofibers. The Li1.2Ni0.7Co0.1Mn0.2O2 samples doped with different Au content were marked as LNCMA-X%, where X% represented the atom percent of AuCl3·HCl·4H2O. The precursor solution was put into a syringe. A flat piece of aluminum foil was placed about 10–12 cm away from the needle and was used as a fiber collector. A positive direct current (DC) voltage was applied between the needle and the collector to form stable continuous fibers. Then, the pristine fibers were put in a furnace and annealed at 700 °C for 10 h with a 2 °C min−1 heating and 2 °C min−1 cooling rate.
X (X = 0%, 1%, 2%, 3%, and 4%), which was used to prepare nanofibers. The Li1.2Ni0.7Co0.1Mn0.2O2 samples doped with different Au content were marked as LNCMA-X%, where X% represented the atom percent of AuCl3·HCl·4H2O. The precursor solution was put into a syringe. A flat piece of aluminum foil was placed about 10–12 cm away from the needle and was used as a fiber collector. A positive direct current (DC) voltage was applied between the needle and the collector to form stable continuous fibers. Then, the pristine fibers were put in a furnace and annealed at 700 °C for 10 h with a 2 °C min−1 heating and 2 °C min−1 cooling rate.
2.3. Characterization methods
The crystal structure of the as-prepared materials was studied by powder X-ray diffractometry (XRD, Dandong Tongda TD-3000) with Cu Kα (40 kV, 30 mA) radiation (λ = 1.5406 Å) over the range of 10–90° at a scanning speed of 0.02° s−1. The particle morphology and size of the as-prepared products were characterized by a scanning electron microscope (SEM, JMS-7610F, JEOL, Japan) and a transmission electron microscope (TEM, FEI Tecnai G2 S-Twin, 200 kV). Element mapping images obtained using an energy dispersive X-ray spectrometer (EDS, Hitachi S-4800, 10 kV) were used to clarify the distribution of the element. The surface elemental properties of the selected products were analyzed via XPS (VGESCALAB MKII, Al Kα).2.4. Electrochemical measurements
The electrochemical characterization of the Au-doped Li1.2Ni0.7Co0.1Mn0.2O2 was carried out by assembling 2032-type coin cells. The electrode was prepared by mixing active material powders with 10 wt% super-P carbon black and 10 wt% polyvinylidene fluoride (PVDF) binder; N-methyl pyrrolidone (NMP) was used as solvent. The obtained slurry was uniformly coated onto Al foil and dried in a vacuum oven at 100 °C for 24 h. The electrode was pressed and punched into round disks of 15 mm in diameter. Electrochemical cells consisted of an active material working electrode and a lithium foil counter electrode separated by a Celgard 2400 microporous membrane. The electrolyte solution was 1 mol L−1 LiPF6 in a mixture of ethylene carbonate (EC), dimethyl carbonate (DMC) and ethylene methyl carbonate (EMC) in a 1![[thin space (1/6-em)]](https://www.rsc.org/images/entities/char_2009.gif) :
:![[thin space (1/6-em)]](https://www.rsc.org/images/entities/char_2009.gif) 1
1![[thin space (1/6-em)]](https://www.rsc.org/images/entities/char_2009.gif) :
:![[thin space (1/6-em)]](https://www.rsc.org/images/entities/char_2009.gif) 1 volume ratio. The cell assembly was carried out in an Ar-filled glove box with both oxygen and moisture content below 1 ppm. Galvanostatic charge/discharge characteristics of the samples were tested using a battery testing system (NEWARE Co. Ltd., Shenzhen, China) with a voltage window of 2.0–4.8 V vs. Li/Li+ for setting current rates. Electrochemical impedance spectroscopy (EIS) measurements were conducted on an electrochemical workstation (CHI760D, Shanghai Chenhua Co. Ltd). The AC perturbation signal was 5 mV and the frequency range was from 100 kHz to 0.01 Hz. Impedance data analyses were performed using the electrochemical impedance software Zview.
1 volume ratio. The cell assembly was carried out in an Ar-filled glove box with both oxygen and moisture content below 1 ppm. Galvanostatic charge/discharge characteristics of the samples were tested using a battery testing system (NEWARE Co. Ltd., Shenzhen, China) with a voltage window of 2.0–4.8 V vs. Li/Li+ for setting current rates. Electrochemical impedance spectroscopy (EIS) measurements were conducted on an electrochemical workstation (CHI760D, Shanghai Chenhua Co. Ltd). The AC perturbation signal was 5 mV and the frequency range was from 100 kHz to 0.01 Hz. Impedance data analyses were performed using the electrochemical impedance software Zview.
3. Results and discussion
3.1. Structure and morphology characterization of LNCMA-X%
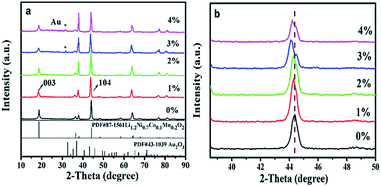
Fig. 1 shows the XRD patterns of LNCMA-X%. The diffraction peaks for non-doped material were indexed to the hexagonal α-NaFeO2 layered structure (R![[3 with combining macron]](https://www.rsc.org/images/entities/char_0033_0304.gif) m space group). In the doped samples, the main patterns are consistent with the undoped layered structure. However, the gold elemental phase (as marked by asterisks) appears due to the heavy doping amount, providing evidence that Au has been partially inserted into as-prepared samples. The crystal structure does not change distinctly with a small amount of Au-doping. Furthermore, with an increase of Au doping level, the main peaks located at about 44° shift to the lower angle direction as shown in Fig. 1b. The diffraction peaks of LNCMA-X% shifted to slightly lower degree due to the larger ion radius of Au3+ (0.85 Å). The relative intensity of the diffraction peaks strengthened with the increase of Au doping level. In addition, the lattice parameters α, c, c/α and V calculated by using MDI Jade 6.0 software are presented in Table 1. The lattice parameter α is related to the change in transition metal ionic size. Since the ion radius of Ni2+ (0.69 Å) and atomic radius of Au3+ (0.85 Å) are larger than those of Ni3+ (0.56 Å) and Mn4+ (0.53 Å), the lattice parameter α increases with an increase in Au doping level. However, the valence of Ni could partly change from Ni2+ (0.69 Å) to Ni3+ (0.56 Å).50 It could result in the slight change of the lattice parameter α. The lattice parameter c is related to the transition metal ion radius, lattice strain and cation mixing; it does not increase monotonically with the increase in Au doping level. The lattice parameter α, c and unit cell volumes with the degree of substitutions also in response to the incorporation of the Au into as-prepared samples. The increase of intensity ratio of I(003)/I(104) indicates that the amount of Ni in the Li site decreases with Au doping level less than or equal to 2%.51,52 Since the ionic size of Ni2+ (0.69 Å) is similar to that of Li+ (0.76 Å), it is possible that Li might occupy the transition metal site in addition to the Li site; hence, the degree of cation mixing is increased. However, redundant Li plays a critical role in suppressing cation mixing. It is thought that a great portion of excess Li is contained in the crystal. This indicates that redundant Li suppresses Ni occupation of the Li site. The results appear to indicate the suppression of phase transformation by controlling the amount of Ni in the Li layer. Redundant Li is primarily thought to occupy the Li site and potentially the surface of cathode. The high c/α value also indicates small cation mixing and good ordering of the transition metal ions in the transition metal layer. It is believed that the enlargement of c and cell volume and the stable hierarchical nanostructure lead to excellent electrochemical properties of LNCMA-2% (Table 2).
m space group). In the doped samples, the main patterns are consistent with the undoped layered structure. However, the gold elemental phase (as marked by asterisks) appears due to the heavy doping amount, providing evidence that Au has been partially inserted into as-prepared samples. The crystal structure does not change distinctly with a small amount of Au-doping. Furthermore, with an increase of Au doping level, the main peaks located at about 44° shift to the lower angle direction as shown in Fig. 1b. The diffraction peaks of LNCMA-X% shifted to slightly lower degree due to the larger ion radius of Au3+ (0.85 Å). The relative intensity of the diffraction peaks strengthened with the increase of Au doping level. In addition, the lattice parameters α, c, c/α and V calculated by using MDI Jade 6.0 software are presented in Table 1. The lattice parameter α is related to the change in transition metal ionic size. Since the ion radius of Ni2+ (0.69 Å) and atomic radius of Au3+ (0.85 Å) are larger than those of Ni3+ (0.56 Å) and Mn4+ (0.53 Å), the lattice parameter α increases with an increase in Au doping level. However, the valence of Ni could partly change from Ni2+ (0.69 Å) to Ni3+ (0.56 Å).50 It could result in the slight change of the lattice parameter α. The lattice parameter c is related to the transition metal ion radius, lattice strain and cation mixing; it does not increase monotonically with the increase in Au doping level. The lattice parameter α, c and unit cell volumes with the degree of substitutions also in response to the incorporation of the Au into as-prepared samples. The increase of intensity ratio of I(003)/I(104) indicates that the amount of Ni in the Li site decreases with Au doping level less than or equal to 2%.51,52 Since the ionic size of Ni2+ (0.69 Å) is similar to that of Li+ (0.76 Å), it is possible that Li might occupy the transition metal site in addition to the Li site; hence, the degree of cation mixing is increased. However, redundant Li plays a critical role in suppressing cation mixing. It is thought that a great portion of excess Li is contained in the crystal. This indicates that redundant Li suppresses Ni occupation of the Li site. The results appear to indicate the suppression of phase transformation by controlling the amount of Ni in the Li layer. Redundant Li is primarily thought to occupy the Li site and potentially the surface of cathode. The high c/α value also indicates small cation mixing and good ordering of the transition metal ions in the transition metal layer. It is believed that the enlargement of c and cell volume and the stable hierarchical nanostructure lead to excellent electrochemical properties of LNCMA-2% (Table 2).
| Samples | α (Å) | c (Å) | c/α | V (Å3) |
|---|---|---|---|---|
| X = 0% | 2.88609 | 14.1614 | 4.907 | 102.15 |
| X = 1% | 2.88456 | 14.17844 | 4.915 | 102.22 |
| X = 2% | 2.88011 | 14.18542 | 4.925 | 102.85 |
| X = 3% | 2.87354 | 14.24917 | 4.959 | 101.9 |
| X = 4% | 2.88254 | 14.18702 | 4.921 | 102.09 |
| Sample | Re (Ω) | Rct (Ω) | σ (Ω s−0.5) | D (cm2 s−1) | i° (mA cm2) |
|---|---|---|---|---|---|
| X = 0% | 7.62 | 152.53 | 80.73 | 3.99 × 10⁻¹³ | 1.68 × 10⁻¹⁴ |
| X = 1% | 8.79 | 163.05 | 70.48 | 5.24 × 10⁻¹³ | 1.58 × 10⁻¹⁴ |
| X = 2% | 5.5 | 97.73 | 40.39 | 1.59 × 10⁻¹² | 2.63 × 10⁻¹⁴ |
| X = 3% | 7.1 | 140.17 | 50.98 | 1.00 × 10⁻¹² | 1.83 × 10⁻¹⁴ |
| X = 4% | 7.28 | 174.47 | 66.32 | 5.92 × 10⁻¹³ | 1.47 × 10⁻¹⁴ |
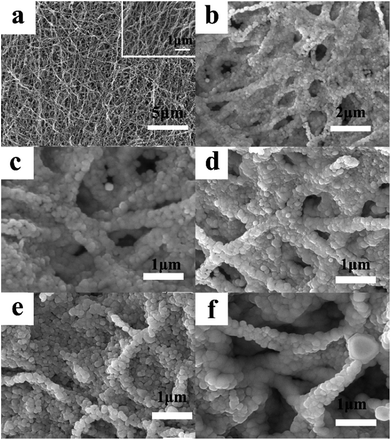
The SEM images of LNCMA-X% are illustrated in Fig. 2. It can be observed from the low magnification image (Fig. 2a) that the non-substituted nanofibers are rather homogeneous in thickness. High magnification photographs (Fig. 2b–f) show that the nanofibers exhibited smooth surfaces with numerous homogenous nano-sized primary particles loosely agglomerated and arranged in the lines, which are supposed to be the nanofibers. Among these oxides, the particle size of LNCMA-2% is smaller than others. Au doping effectively controls the crystal growth. Such morphology of nanofibers is expected to accelerate electrolyte penetration into the electrode, inhibit the surface reactivity between the electrode and the electrolyte, provide a shortcut for Li+ diffusion in the active materials and decrease the dissolution of Mn. Hence, it is expected that the electrochemical performance of LNCMA-2%, especially rate capabilities, can be enhanced due to Au doping.
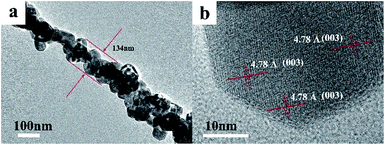
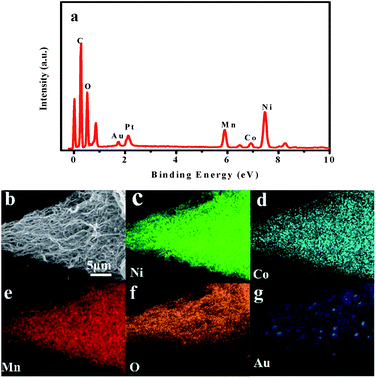
Fig. 3 shows the TEM images of the as-prepared LNCMA-2% products. As shown in Fig. 3a, the sample retains the nanofiber structure with a diameter of 134 nm after annealing. Moreover, the fiber is composed of nanoparticles with higher crystallization, which is in agreement with the SEM images. The high-resolution TEM (HRTEM) image (Fig. 3b) reveals the crystalline features of the nanoparticles. The clear fringes with interplanar spacing of approximately 4.78 Å correspond to the (003) lattice planes of Li1.2Ni0.7Co0.1Mn0.2O2, consistent with the XRD result (Fig. 1a). In order to confirm the element distribution of LNCMA-X%, the energy dispersive spectrum (EDS) was measured. The EDS images of LNCMA-2% clearly show the presence of O, Ni, Co, Mn, and Au in the prepared materials as illustrated in Fig. 4a. In addition, EDS elemental mapping (Fig. 4b–g) confirmed the homogenous and co-existent distribution of Ni, Co, Mn, O, and Au across the entire nanostructure. Furthermore, the chemical composition and electronic state of elements on the surface of the LNCMA-2% sample was revealed by X-ray photoelectron spectra (XPS). As shown in Fig. 5, the fitted Ni 2p level shows two peaks at 856.1 and 873.7 eV, which can be assigned to Ni2+ 2p3/2 and 2p1/2,53 respectively. Satellite peaks appear at 860.4 and 879.1 eV due to shake-up processes of Ni2+ 2p3/2 and Ni2+ 2p1/2, respectively.53,54 The peaks at 780.0 and 796.4 eV are assigned to Co2+ 2p3/2 and 2p1/2, respectively.55,56 The peaks at 641.0 and 653.7 eV are assigned to Mn3+ 2p3/2 and 2p1/2, respectively, which can be confirmed in the oxidation of air.57,58 It can be observed from Fig. 5e that the Au3+ 4f spectrum exhibits the characteristic peaks at 4f7/2 (83.8 eV) and 4f5/2 (89.5 eV), and the binding energy at 84.0 eV and 88.8 eV is assigned to the metallic Au trapped in the LNCMO layer. The different Au–O species cannot be distinguished based on XPS spectra from the Au-4f region.59–61 This result indicates that Au is directly bound to O in LNCMOA. The spectrum of the O 1s region is depicted in Fig. 5f and has two peaks at 528.9 and 531.0 eV, which correspond to Ni–O bond.62–64 Clearly, the above analysis indicates the co-existence of Co–O, Ni–O, Mn–O, and Au–O in this product.
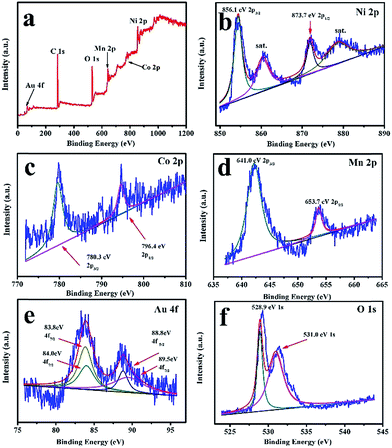 | ||
| Fig. 5 XPS spectra and corresponding fitting curves of LNCMA-2% nanofibers. (a) Survey spectrum, (b) Ni 2p, (c) Co 2p, (d) Mn 2p, (e) Au 4f, (f) O 1s. | ||
3.2. Electrochemical performance of LNCMA-X%
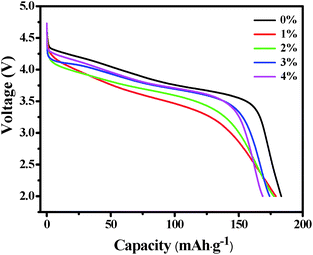
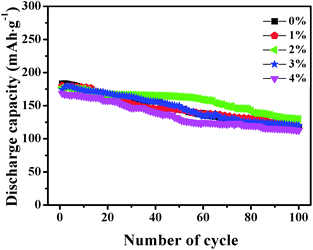
Fig. 6 shows the initial discharge profiles of LNCMA-X% cathodes. The cells were charged and discharged at a current density of 0.2C. The LNCMA-0%, LNCMA-1%, LNCMA-2%, LNCMA-3% and LNCMA-4% display discharge capacities of 183.243, 179.088, 177.441, 174.142 and 168.032 mA h g−1, respectively. The first discharge capacities of Au-doped samples are lower than that of non-doped material. The discharge capacity of the LNCMA-4% is the least. The decrease in discharge capacity in Au-doped samples is attributed to the fact that Ni in the Li layer disrupts Li diffusion. The voltage decrease is quite smooth before the rapid drop at about 3.7 V. First, since the high valence state is more stable than the low valance state, it may be stable at a high charge state. Second, the ratio of Ni2+ to Ni3+ increases with the Au substitution. Therefore, the Ni valence of Au-doped cathode materials is lower than that of non-substituted cathode materials, and this improves electrochemical stability. The stable structures provide a favorable pathway for fast lithium kinetics.65 Moreover, long platforms of discharge curves are associated with electrode stability. Furthermore, an optimized Au amount may suppress the formation of solid electrolyte interface (SEI) film, and the charge transfer resistance may reduce after activation at the beginning of the cycling. This is consistent with the results obtained in the subsequent EIS tests.Fig. 7 shows the cycle capabilities of LNCMA-X% electrodes at 0.2C in the voltage range of 2.0–4.8 V. The capacity retentions after 100 cycles for samples with various levels of Au-doping are 64.2%, 67.5%, 75.2%, 69.1% and 67%. The impact of the Au substitution on the cycle capabilities of Li1.2Ni0.7Co0.1Mn0.2O2 is complicated. Generally, the reversible capacities of Au-doped Li1.2Ni0.7Co0.1Mn0.2O2 increase at X less than 2%. The excellent cycle capability of Au-doped materials could be attributed to the formation of stronger Au–O bonds, which increases the structure stability of the electrode against HF attack. For samples with X ≥ 2%, excess Au doping reduces the utilization of active material.
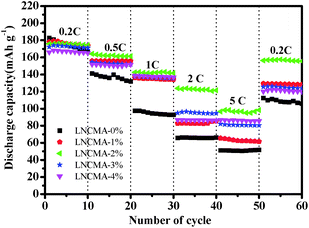
Fig. 8 exhibits the rate capabilities of the LNCMA-X% cathode. The assembled cells were tested at 0.2C discharge rate for the first 10 cycles and then at discharge rate from 0.5 to 5C. Again, the LNCMA-2% displays a better performance and delivers a reversible capacity of 174 mA h g−1 at discharge rate of 0.2C after 10 cycles. When the current densities are increased, only a small decrease in capacity is observed. In particular, after LNCMA-2% undergoes discharge up to 5C, the cathode still delivers a reversible discharge capacity of 96.0 mA h g−1. A high reversible capacity of 156.4 mA h g−1 at 0.2C for LNCMA-2% can be achieved even at a high discharge rate of 5C after 50 cycles.
Both the capacity retention decrease and rate capability property suggest that the excess Au doping severely deteriorates the electrochemical performance, which is probably attributed to the formation of a precarious interface structure resulting from the nonequivalent substitution. In addition, the charge transfer becomes slower resulting from the incorporation of highly conductive Au in charge–discharge process, thus leading to excellent electrochemical properties. Therefore, an optimum amount of Au substitution of 2% in Li1.2Ni0.7Co0.1Mn0.2O2 could enhance the combination performance of cathodes and excellent discharge capacity and good capacity retention can be obtained.
In order to further explore the impact of Au-doping and investigate the kinetic process of lithium insertion–extraction, the assembled cells were characterized using EIS. As shown in Fig. 9, each of the impedance spectra of LNCMA-X% electrodes includes three regions.66,67 The intercept of the plot with the Z′ axis in the high frequency region is ascribed to the electrolyte resistance (Re). The semicircle in the medium frequency region reflects the charge transfer resistance (Rct) for Li+ ion migration through the interface between the surface layer and the electrolyte.68
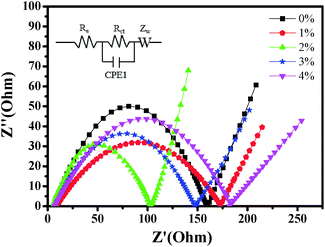 | ||
| Fig. 9 Impedance spectra of the LNCMA-X% at open circuit voltage. Inset: equivalent circuit corresponding to the impedance diagrams. | ||
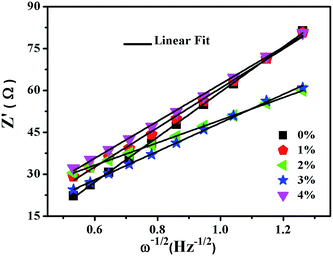
As shown in Fig. 10, the sloping line in the low frequency area is attributed to Warburg impedance (Zw).69 The value of Rct for LNCMA-2% is 97.73 Ω; this electrode displays the lowest charge transfer resistance. The result demonstrates that the Li+ has excellent diffusion performance. It shows that Au-doping has an efficacious effect on restraining the increase in charge transfer impedance of the cathode during cycling. The lower the charge transfer resistance, the higher the electrochemical performance. The small increment in Rct can be explained as follows: on one hand, the appropriate Au-doping stabilizes the structure of the sample and suppresses dissolution of metal ions. On the other hand, the formation of better SEI film accelerates Li-ion diffusion from surface layer to the electrolyte.70 The EIS results again prove the beneficial effect of Au modification on layered Li1.2Ni0.7Co0.1Mn0.2O2.
4. Conclusions
The Au-doped Li1.2Ni0.7Co0.1Mn0.2O2 (Au = 0%, 1%, 2%, 3%, and 4%) cathode materials were successfully prepared by a sample electro-spinning technique. The impact of Au doping on the structure, morphology and electrochemical performances of the resultant products was studied in detail. The optimal amount of Au-doped content is 2% in Li1.2Ni0.7Co0.1Mn0.2O2. The small nanoparticles can flexibly adapt to the volume expansion during the Li-ion insertion/extraction process, which contributes to enhance the structure stability and shorten the diffusion distance of Li-ion. The improvement of electrochemical properties of the LNCMA-2% can be attributed to strengthening the surface structure to hinder the dissolution of metal ions and improving the conductivity of the samples. In addition, this improvement can be due to a higher Li+ diffusion coefficient and smaller charge-transfer resistance for the LNCMA-2%.Conflicts of interest
There are no conflicts of interest to declare.Acknowledgements
This research has been supported by the Natural Science Foundation of Jilin Province (No. 20170101128JC), the Science and Technology Research Project of the Education Department of Jilin Province during the 13th 5 year plan period (No. 2016-359), the Youth Foundation of Changchun University of Science and Technology (No. XQNJJ-2014-13, XJJLG-2014-10), and the Science and Technology Planning Project of Changchun City (No. 2013064).References
- B. Markovsky, A. Rodkin, Y. S. Cohen, O. Palchik, L. Mikhael, D. Aurbach, H. J. Kim and M. Schmidt, J. Power Sources, 2003, 119, 504–510 CrossRef.
- J. Q. Deng, L. J. Xi, L. H. Wang and Z. M. Wang, J. Power Sources, 2012, 198, 251–257 CrossRef.
- S. K. Martha, J. Nanda, G. M. Veith and N. J. Dudney, J. Power Sources, 2012, 216, 179–186 CrossRef CAS.
- H. Zheng, T. Li, X. Song, G. Liu and V. Battaglia, J. Power Sources, 2012, 208, 52–57 CrossRef CAS.
- S. J. Shi, Y. J. Mai, Y. Y. Tang and C. D. Gu, Electrochim. Acta, 2012, 77, 39–46 CrossRef CAS.
- P. Manikandan, M. V. Ananth, T. P. Kumar, M. Raju, P. Periasamy and K. Manimaran, J. Power Sources, 2011, 196, 10148–10155 CrossRef CAS.
- H. M. Wu, J. P. Tu, Y. F. Yuan, J. Y. Xiang, X. T. Chen, X. B. Zhao and G. S. Cao, J. Electroanal. Chem., 2007, 608, 8–14 CrossRef CAS.
- A. M. A. Hashem, A. E. Abdel-Ghany, A. E. Eid, J. Trottier, K. Zaghib, A. Mauger and C. Julien, J. Power Sources, 2011, 196, 8632–8637 CrossRef CAS.
- Y. J. Gu, Y. B. Chen, H. Q. Liu, Y. M. Wang, C. L. Wang and H. K. Wu, J. Alloys Compd., 2011, 509, 7915–7921 CrossRef CAS.
- H. G. Kim, S. T. Myung, J. K. Lee and Y. K. Sun, J. Power Sources, 2011, 196, 6710–6715 CrossRef CAS.
- G. R. Li, X. Feng, Y. Ding, S. H. Ye and X. P. Gao, Electrochim. Acta, 2012, 78, 308–315 CrossRef CAS.
- Y. Bentaleb, I. Saadoune, K. Maher, L. Saadi, K. Fujimoto and S. Ito, J. Power Sources, 2010, 195, 1510–1515 CrossRef CAS.
- Y. W. Lee, J. K. Oh, H. S. Kim, J. K. Lee, S. B. Han, W. ChoiJ and K. W. Park, J. Power Sources, 2010, 195, 5896–5901 CrossRef CAS.
- X. Zhang, A. Mauger, Q. Lu, H. Groult and L. Perrigaud, Electrochim. Acta, 2010, 55, 6440–6449 CrossRef CAS.
- Y. Xia and M. Yoshio, J. Power Sources, 1995, 57, 24–28 CrossRef.
- A. Kraytsberg and Y. Ein-Eli, Adv. Energy Mater., 2012, 2, 922–939 CrossRef CAS.
- B. L. Ellis, K. T. Lee and L. F. Nazar, Chem. Mater., 2010, 22, 691–714 CrossRef CAS.
- N. S. Choi, Z. Chen, S. A. Freunberger, X. D. Ji, Y. Sun, K. Amine, G. Yushin and L. F. Nazar, Angew. Chem., 2012, 51, 9994–10024 CrossRef CAS PubMed.
- H. T. Kim, J. S. Park, S. K. Chang, S. D. Choi, J. H. Ryu and H. K. Song, Adv. Energy Mater., 2012, 2, 860–872 CrossRef.
- J. Xiao, N. A. Chernova and M. S. Whittingham, Chem. Mater., 2010, 22, 1180–1185 CrossRef CAS.
- S. Muto, K. Tatsumi, Y. Kojima, H. Oka, H. Kondo, K. Horibuchi and Y. Ukyo, J. Power Sources, 2012, 205, 449–455 CrossRef CAS.
- S. Muto, K. Tatsumi, Y. Ukyo, O. Chikaaki, I. Yuichi, K. Yasuhito, T. Yoji, U. Yoshio, T. Kazuyoshi and M. Shunsuke, J. Electrochem. Soc., 2009, 156, A371–A377 CrossRef CAS.
- Y. Shin and A. Manthiram, ChemInform, 2003, 34, 2954–2961 Search PubMed.
- V. Aravindan, J. Gnanaraj, Y. S. Lee and S. Madhavi, J. Mater. Chem. A, 2012, 1, 3518–3539 RSC.
- W. Feng, W. Meng, Y. Su and S. Chen, Electrochim. Acta, 2009, 54, 6803–6807 CrossRef.
- X. Huang, Q. Q. Qiao, Y. Y. Sun, F. Li, Y. L. Wang and S. H. Ye, J. Solid State Electrochem., 2015, 19, 805–812 CrossRef CAS.
- S. J. Shi, J. P. Tu, Y. J. Mai, M. Y. Zhang, C. D. Gu and X. l. Wang, Electrochim. Acta, 2012, 63, 112–117 CrossRef CAS.
- Y. J. Kang, J. H. Kim, S. W. Lee and Y. K. Sun, Electrochim. Acta, 2005, 50, 4784–4791 CrossRef CAS.
- S. H. Lee, B. K. Koo, J. C. Kim and K. M. Kim, J. Power Sources, 2008, 184, 276–283 CrossRef CAS.
- J. T. Lee, F. M. Wang, C. S. Cheng, C. C. Li and C. H. Lin, Electrochim. Acta, 2010, 55, 4002–4006 CrossRef CAS.
- J. Zhang, Y. J. Xiang, Y. Yu, S. Q. Xie, G. S. Jiang and C. Chen, J. Power Sources, 2004, 132, 187–194 CrossRef CAS.
- M. Ménétrier, J. Bains, L. Croguennec, A. Flambard, E. Bekaert, C. Jordy, P. Biensan and D. Claude, J. Solid State Chem., 2008, 181, 3303–3307 CrossRef.
- W. Feng, W. Meng, Y. Su and S. Chen, J. Power Sources, 2010, 195, 2900–2904 CrossRef.
- H. Xiang and Z. Peng, Electrochim. Acta, 2011, 56, 7088–7091 CrossRef.
- A. Mahmoud, I. Saadoune, J. M. Amarilla and R. Hakkou, Electrochim. Acta, 2011, 56, 4081–4086 CrossRef CAS.
- G. Singh, R. Thomas, A. Kumar and R. S. Katiyar, J. Electrochem. Soc., 2012, 159, A410 CrossRef CAS.
- D. Wang, Y. Huang, Z. Huo and L. Chen, Electrochim. Acta, 2013, 107, 461–466 CrossRef CAS.
- W. Luo, F. Zhou, X. Zhao, Z. H. Lu, X. H. Li and J. R. Dahn, Chem. Mater., 2010, 22, 1164–1172 CrossRef CAS.
- Q. Li, G. Li, C. Fu, D. Luo, J. M. Fan and L. P. Li, ACS Appl. Mater. Interfaces, 2014, 6, 10330 CAS.
- B. Song, M. O. Lai and L. Lu, Electrochim. Acta, 2012, 80, 187–195 CrossRef CAS.
- Y. Weng, S. Xu, G. Huang and C. Jiang, J. Hazard. Mater., 2013, 246–247, 163 CrossRef CAS PubMed.
- K. K. Lee, W. S. Yoon, K. B. Kim, K. Y. Lee and S. T. Hong, J. Power Sources, 2001, 97, 321–325 CrossRef.
- G. T. K. Fey, J. G. Chen, V. Subramanian and T. Osaka, J. Power Sources, 2002, 112, 384–394 CrossRef CAS.
- S. H. Na, H. S. Kim and S. I. Moon, Solid State Ionics, 2005, 176, 313–317 CrossRef CAS.
- J. H. Chang, W. S. Eom, M. L. Sang, W. I. Cho and H. Jang, J. Power Sources, 2005, 144, 214–219 CrossRef.
- S. H. Park, S. W. Oh and Y. K. Sun, J. Power Sources, 2005, 146, 622–625 CrossRef CAS.
- L. Q. Wang, L. F. Jiao, H. T. Yuan, J. Guo, M. Zhao, H. X. Li and Y. M. Wang, J. Power Sources, 2006, 162, 1367–1372 CrossRef CAS.
- R. Vidu, C. Plapcianu and C. Bartha, Ind. Eng. Chem. Res., 2014, 53, 7829–7839 CrossRef CAS.
- M. Kageyama, D. Li, K. Kobayakawa, Y. Sato and Y. S. Lee, J. Power Sources, 2006, 157, 494–500 CrossRef CAS.
- H. Konishi, M. Yoshikawa and T. Hirano, J. Power Sources, 2013, 244, 23–28 CrossRef CAS.
- W. Li, J. N. Reimers and J. R. Dahn, Phys. Rev. B: Condens. Matter Mater. Phys., 1992, 46, 3236–3246 CrossRef CAS.
- L. Croguennec, I. Saadoune and A. Rougier, Electrochim. Acta, 1999, 45, 243–253 CrossRef.
- A. N. Mansour, Surf. Sci. Spectra, 1994, 3, 239 CrossRef CAS.
- A. M. Venezia, R. Bertoncello and G. Deganello, Surf. Interface Anal., 1995, 23, 239 CrossRef CAS.
- N. S. McIntyre, D. D. Johnston, L. L. Coatsworth, R. D. Davidson and J. R. Brown, Surf. Interface Anal., 1990, 15, 265 CrossRef CAS.
- C. V. Schenck, J. G. Dillard and J. W. Murray, J. Colloid Interface Sci., 1983, 95, 398 CrossRef CAS.
- W. H. Chen, Y. Y. Li, J. J. Zhao, F. F. Yang, J. M. Zhang, Q. Z. Shi and L. W. Mi, RSC Adv., 2016, 6, 58173–58181 RSC.
- B. J. Tan, K. J. Klabunde and P. M. A. Sherwood, J. Am. Chem. Soc., 1991, 113, 855 CrossRef CAS.
- C. Xu, T. Sritharan, S. G. Mhaisalkar, M. Srinivasan and S. Zhang, Appl. Surf. Sci., 2007, 253, 6217–6221 CrossRef CAS.
- V. D. Putten and R. Zanoni, Phys. Lett. A, 1995, 208, 345 CrossRef.
- J. J. Pireaux, M. Liehr, P. A. Thiry, J. P. Delrue and R. Caudano, Surf. Sci., 1984, 141, 221 CrossRef CAS.
- M. S. K. Oku, H. J. M. Tokuda and K. S. K. Hirokawa, J. Electron Spectrosc. Relat. Phenom., 1991, 4, 201–211 CrossRef.
- E. E. Khawaja, M. A. Salim, M. A. Khan, F. F. Al-Adel, G. D. Khattak and Z. Hussain, J. Non-Cryst. Solids, 1989, 110, 33 CrossRef CAS.
- A. M. Venezia, R. Bertoncello and G. Deganello, Surf. Interface Anal., 1995, 23, 239 CrossRef CAS.
- Y. Hu, Y. Zhou, J. Wang and Z. Shao, Mater. Chem. Phys., 2011, 129, 296–300 CrossRef CAS.
- K. M. Shaju, G. V. S. Rao and B. V. R. Chowdari, Electrochim. Acta, 2004, 49, 1565–1576 CrossRef CAS.
- K. M. Shaju, G. V. S. Rao and B. V. R. Chowdari, J. Electrochem. Soc., 2004, 151, A1324–A1332 CrossRef CAS.
- J. Li, C. Cao, X. Xu, Y. Zhu and R. Yao, J. Mater. Chem. A, 2013, 1, 11848–11852 CAS.
- Y. Cho, P. Oh and J. Cho, Nano Lett., 2013, 13, 1145–1152 CrossRef CAS PubMed.
- D. Li, Y. Kato, K. Kobayakawa, H. Noguchi and Y. Sato, J. Power Sources, 2006, 160, 1342–1348 CrossRef CAS.
| This journal is © The Royal Society of Chemistry 2018 |

