 Open Access Article
Pressurized carbonization of mixed plastics into porous carbon sheets on magnesium oxide†
Jiali Maab,
Jie Liu *b,
Jiangfeng Song*a and
Tao Tang*b
aDepartment of Chemistry, College of Science, North University of China, Taiyuan 030051, China. E-mail: jfsong0129@gmail.com
bState Key Laboratory of Polymer Physics and Chemistry, Changchun Institute of Applied Chemistry, Chinese Academy of Sciences, Changchun 130022, China. E-mail: liujie@ciac.ac.cn; ttang@ciac.ac.cn
First published on 10th January 2018
Abstract
Conversion of waste thermoplastics into porous carbons has attracted wide attention due to the requirement of recycling of large quantities of municipal solid waste. This work reports the preparation of porous carbon sheets on magnesium oxide from mixed thermoplastics including polyethylene, polypropylene, polystyrene, polyvinyl chloride, and polyethylene terephthalate in a closed autoclave at 500 °C. The influence of the weight ratio of magnesium oxide to mixed plastics on the yield and textural properties of the carbon was examined. The morphology and structure of the porous carbon were also characterized. The maximum BET surface area was 713 m2 g−1 at a weight ratio of MgO/polymer of 4 and the maximum pore volume was 5.27 cm3 g−1 at a weight ratio of MgO/polymer of 6. The reaction mechanism was explored by analyzing the product distribution and composition of gas and liquid at different reaction times. Aromatics were the main source for the growth of carbon. Model experiments of carbonization of different aromatics were conducted to evaluate the carbonization reactivity of aromatics. Polycyclic aromatic hydrocarbons, especially acenes, produced more carbon.
Introduction
Polyethylene (PE), polypropylene (PP), polystyrene (PS), polyvinyl chloride (PVC), and polyethylene terephthalate (PET) are the main constituents of plastic waste in municipal solid waste. The plastic waste accounts for about 8% of the total municipal solid waste by weight and about 18% by volume.1 The quantity of plastic waste is continuously increasing all over the world. Only 15–20% of waste plastics can be mechanically recycled and most plastic wastes are treated by landfill and incineration, although thermoplastics can be recycled repeatedly by melt processing.2 Most plastic wastes are commingled and contaminated, making it difficult to separate relatively pure polymers from mixed plastic wastes. Therefore, upcycling of mixed plastic wastes into value-added products such as fuel,3 syngas,4 and carbon nanomaterials5–7 has attracted more attention owing to a drastic increase in plastic wastes.Thermoplastics consist mostly of carbon, thus these plastic wastes provide an abundant carbon source for the production of carbon as well. Carbon nanotubes,8–10 carbon spheres,11,12 multi-layered graphene,13 and porous carbons14,15 have been prepared from PP,8,9,13 PE,10 PS,16 PVC,17,18 PET,19 polyurethane (PU),20 polycarbonate (PC),21 PET–polyacrylonitrile (PAN) blend,22 and mixed plastics.11,15 Conversion of these cheap precursors into porous carbon (activated carbon) with high surface area and pore volume would not only produce useful products, but also help to reduce the ever-growing plastic waste.
Physical activation, chemical activation and hard template method have been employed to produce porous carbon using various thermoplastics as carbon precursor. Physical activation commonly includes steam activation23 and carbon dioxide activation.24,25 Qiao et al. heated PVC in two stages under nitrogen to prepare chlorine free PVC based pitch.17 The obtained pitch was spun, stabilized in air, carbonized in argon and activated using steam at 900 °C for 30–90 minutes to obtain activated carbon fiber. The yield of activated carbon fiber was about 4–8% of the initial PVC mass and the surface area of activated carbon fiber was 1096–2096 m2 g−1. Bratek et al. carbonized PET at 825 °C and obtained about 22% of carbon.26 The obtained carbon was then activated under CO2 at 900–940 °C for different times. The surface area of the porous carbon reached 1830 m2 g−1 at 940 °C for 5 hours, which shows the importance of the activation temperature and time. Chemical activation involves the activation reaction between precursors and activating agents. Zinc chloride (ZnCl2), phosphoric acid (H3PO4) or potassium hydroxide (KOH) was the most commonly used reagent. Lian et al. carbonized PET, PVC, and tire rubber at 600 °C and then activated carbon by ground KOH under nitrogen at 850 °C for 90 or 120 minutes.27 The surface area of activated carbon from PET and PVC was 2831 and 2666 m2 g−1, respectively. However, the surface area of activated carbon from tire rubber was only 399 m2 g−1. Soleimani et al. directly mixed PET with the chemical agent solution of H3PO4, H2SO4, ZnCl2, and KOH.28 KOH and H3PO4 developed higher microporosity for the activated carbon. Hard-template method is another technique to prepare porous carbon from plastics, which involves carbonization of the composite of polymer and template, and subsequent template dissolution using hydrochloric acid or hydrofluoric acid.29 The morphology of the carbon replicates that of inorganic template. MgO,30 silica,31 organically-modified montmorillonite,13 and molecular sieves such as MCM-41 (ref. 32) and SBA-15 (ref. 33) have been used as hard templates. MgO is mostly used because it can be easily removed by a non-corrosive acid and recycled. Morishita et al. prepared nanoporous carbon from various carbon precursors, including polyvinyl alcohol, PET, polyimide, and coal tar pitch.30 MgO, magnesium acetate, magnesium citrate, magnesium gluconate and magnesium hydroxyl carbonate were employed as MgO precursor. They found that the size and volume of mesopores depend on the size of MgO, while the size and volume of micropores may be determined by carbon precursor.
Although a lot of studies have been done on the conversion of plastics into porous carbon, few studies focused on the studies using mixed plastics as feedstock, which represent the main composition in municipal solid waste. In previous studies, mixed plastics including PP, PE, PS, PET, and PVC have been converted into carbon nanosheets on organically modified montmorillonite, and then activated using KOH to produce porous carbon nanosheets.34 The porous carbon nanosheets exhibited high specific surface area (1734 m2 g−1) and large pore volume (2.441 cm3 g−1). However, the purification of the obtained porous carbon nanosheets involves removal of montmorillonite by hydrofluoric acid, which is dangerous, tedious and time consuming. MgO is an appropriate template for converting mixed plastics into carbon because it can not only be easily removed by a diluted non-corrosive acid but also absorb HCl produced by decomposition of PVC. Porous carbon sheets and hollow carbon shells have also been synthesized using PS as carbon source on MgO at 700 °C and atmospheric atmosphere, but the maximum yield of porous carbon was only 15 wt%.35 The low yield of carbon is due to slow reaction rate of degraded products of PS on MgO.
The use of an autoclave reactor could promote secondary reactions, which will improve the production of carbon. Herein, we describe the pressurized carbonization of mixed plastics consisting of PP, HDPE, LDPE, PS, PET and PVC into porous carbon to overcome the low yields of atmospheric pyrolysis on MgO template. The process involves carbonization of mixed plastics on a commercial sheet MgO at 500 °C in a closed reactor under nitrogen. The yield, morphology, phase structure, and texture properties of the as obtained porous carbon nanosheets were characterized. The reaction mechanism was explored by analyzing the product distribution and composition of gas and liquid products at different reaction time. This simple approach provides a new potential way to transform waste plastics into value-added porous carbons, which have potential applications in the environment protection and energy.
Experimental
Materials
PP powder (trademark T30S) was supplied by Yanan Petrochemical Co., China. HDPE (trademark 5306J) and PET (trademark SB500) pellets were obtained from Sinopec Yangzi Petrochemical Co., Ltd., China. LDPE pellets (trademark 951-050) were supplied by Sinopec Maoming Company. PS pellets (trademark PG-383) were supplied by Zhenjiang Qimei Chemical Co., Ltd., China. PVC powder (trademark PVC1000) was obtained from LG Dagu Chemical Ltd., Tianjin, China. Sheet MgO was purchased from Xilong Chemical Co., Ltd., China. Benzene, methylbenzene, dimethylbenzene, styrene, naphthalene, anthracene, and phenanthrene were purchased from Aldrich. All other chemicals were of analytical-grade quality. All solutions were prepared using deionized water.Carbonization of plastics on MgO in autoclave
MgO was calcined in a muffle furnace at 700 °C for 2 hours and then dried to eliminate the variation of the mass before used. The weight percentage of PP/LDPE/HDPE/PS/PET/PVC in mixed plastics was 24/30/26/13/4/3 according to their real-world composition in thermoplastic wastes. The single or mixed plastics were ground before being used. Single or mixed plastics and MgO were mixed together at a weight ratio of 1![[thin space (1/6-em)]](https://www.rsc.org/images/entities/char_2009.gif) :
:![[thin space (1/6-em)]](https://www.rsc.org/images/entities/char_2009.gif) 1, 1
1, 1![[thin space (1/6-em)]](https://www.rsc.org/images/entities/char_2009.gif) :
:![[thin space (1/6-em)]](https://www.rsc.org/images/entities/char_2009.gif) 2, 1
2, 1![[thin space (1/6-em)]](https://www.rsc.org/images/entities/char_2009.gif) :
:![[thin space (1/6-em)]](https://www.rsc.org/images/entities/char_2009.gif) 4, 1
4, 1![[thin space (1/6-em)]](https://www.rsc.org/images/entities/char_2009.gif) :
:![[thin space (1/6-em)]](https://www.rsc.org/images/entities/char_2009.gif) 6 and 1
6 and 1![[thin space (1/6-em)]](https://www.rsc.org/images/entities/char_2009.gif) :
:![[thin space (1/6-em)]](https://www.rsc.org/images/entities/char_2009.gif) 8, respectively. The mixture was put into an autoclave reactor in the presence of an internal diameter of 40 mm and a thermocouple. The autoclave was flushed using nitrogen. For each experiment, the reactor was heated from room temperature to 500 °C at a heating rate of 20 °C min−1. When the reactor temperature reached 500 °C, carbonization of plastics began and lasted for different reaction times. After carbonization, the reactor was cooled to room temperature rapidly by air cooling. The gaseous products were collected using a sample bag by passing through a cold trap in ice water. Then, the solid residue in the reactor was taken out and subsequently washed off using tetrahydrofuran (THF) to remove oil absorbed on carbon. The resultant residue was then purified using 18 wt% of hydrochloric acid solution to eliminate MgO. The purified carbon was washed using deionized water and ethanol to neutral and finally dried at 110 °C for 12 hours in an oven. The oil in THF was concentrated by rotary evaporation to remove THF and combined with liquid products in cold trap. The obtained carbon sheets were defined as CS-x, where x is the weight ratio of MgO to mixed plastics. The yield of carbon was calculated by dividing the amount of purified carbon product by the amount of polymer. The volume of collected gas was determined by the displacement of water. The mass of the gas was calculated by multiplying the mole percentage and the molar mass of different gases and finally add them together. The yield of liquid products was calculated by the difference assuming 100% mass balance. Each experiment was repeated two times for reproducibility.
8, respectively. The mixture was put into an autoclave reactor in the presence of an internal diameter of 40 mm and a thermocouple. The autoclave was flushed using nitrogen. For each experiment, the reactor was heated from room temperature to 500 °C at a heating rate of 20 °C min−1. When the reactor temperature reached 500 °C, carbonization of plastics began and lasted for different reaction times. After carbonization, the reactor was cooled to room temperature rapidly by air cooling. The gaseous products were collected using a sample bag by passing through a cold trap in ice water. Then, the solid residue in the reactor was taken out and subsequently washed off using tetrahydrofuran (THF) to remove oil absorbed on carbon. The resultant residue was then purified using 18 wt% of hydrochloric acid solution to eliminate MgO. The purified carbon was washed using deionized water and ethanol to neutral and finally dried at 110 °C for 12 hours in an oven. The oil in THF was concentrated by rotary evaporation to remove THF and combined with liquid products in cold trap. The obtained carbon sheets were defined as CS-x, where x is the weight ratio of MgO to mixed plastics. The yield of carbon was calculated by dividing the amount of purified carbon product by the amount of polymer. The volume of collected gas was determined by the displacement of water. The mass of the gas was calculated by multiplying the mole percentage and the molar mass of different gases and finally add them together. The yield of liquid products was calculated by the difference assuming 100% mass balance. Each experiment was repeated two times for reproducibility.
Carbonization of model aromatic compounds
The model aromatic compound (benzene, methylbenzene, dimethylbenzene, styrene, naphthalene, anthracene, and phenanthrene) and MgO were mixed and put into the autoclave reactor. The process was similar to that of carbonization of plastics. The reaction was conducted at 500 °C for 60 minutes. The weight ratio of benzene to MgO was 2![[thin space (1/6-em)]](https://www.rsc.org/images/entities/char_2009.gif) :
:![[thin space (1/6-em)]](https://www.rsc.org/images/entities/char_2009.gif) 1. The weight of other carbon precursors was calculated on the basis of benzene with the same carbon content. The yield of obtained carbon was calculated by dividing the amount of purified carbon product by the amount of carbon in the carbon precursor.
1. The weight of other carbon precursors was calculated on the basis of benzene with the same carbon content. The yield of obtained carbon was calculated by dividing the amount of purified carbon product by the amount of carbon in the carbon precursor.
Characterization
The morphology of the obtained carbon was characterized on a field-emission scanning electron microscope (FESEM, XL30ESEM-FEG). The morphology of the obtained carbon were observed using a transmission electron microscopy (TEM, JEM-1011, an accelerating voltage of 100.0 kV). The phase structures of the obtained carbon were analyzed by X-ray diffraction (XRD) using a D8 advance X-ray diffractometer with Cu Kα radiation operating at 40 kV and 200 mA. The textural properties of obtained carbon were recorded by nitrogen adsorption/desorption at 77 K using a Quantachrome Autosorb-1C-MS analyzer. The specific surface area (SBET) was calculated by means of the Brunauer–Emmett–Teller (BET) method. The total pore volume (Vtotal) was estimated from the amount of nitrogen adsorbed at a relative pressure of ∼0.99. The liquid products were analyzed by gas chromatography-mass spectrometry (GC-MS, AGILENT 5975MSD). The gaseous hydrocarbon were analyzed by a GC (Kechuang, GC 9800) equipped with a FID, using a KB-Al2O3/Na2SO4 column (50 m × 0.53 mm i.d.). H2, CO, CO2, and CH4 were analyzed by a GC (Kechuang, GC 9800) equipped with a TCD, using a packed TDX-01 (1 m) and molecular sieve 5A column (1.5 m).Results and discussion
Carbonization of single and mixed plastics on MgO in autoclave
Fig. 1 shows TG curves of different polymers and the mixtures of MgO and polymer. The decomposition of PP, HDPE, LDPE, PS, and PET occurred in one stage. The maximum decomposition temperature ranged from 410–480 °C. For PP, LDPE, HDPE, and PS, MgO had little effect on the thermal decomposition behavior because the onset and maximum decomposition temperature were almost unchanged in the presence of MgO. The carbon residue with and without MgO was closed to zero, indicating that PP, HDPE, LDPE, and PS are difficult to form carbon. The decomposition of PVC occurred in two stages correspond to progressive dehydrochlorination of the PVC into a conjugated polyene and further pyrolysis to form hydrocarbons respectively. There were still two stages in the curve of MgO/PVC. The residue of the sample containing MgO at 700 °C were higher than that of PVC, which may be due to the reaction between released HCl and MgO. The pyrolysis of PET exhibited two stages after MgO was incorporated.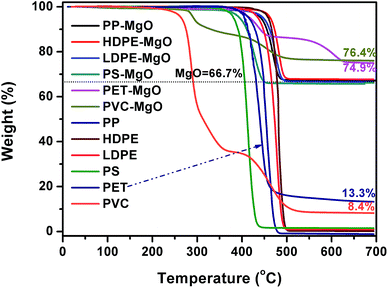 | ||
Fig. 1 TG curves of different polymers and the mixtures of MgO and polymer in nitrogen (mpolymer![[thin space (1/6-em)]](https://www.rsc.org/images/entities/char_2009.gif) : mMgO = 1 : mMgO = 1![[thin space (1/6-em)]](https://www.rsc.org/images/entities/char_2009.gif) : :![[thin space (1/6-em)]](https://www.rsc.org/images/entities/char_2009.gif) 2). 2). | ||
PP, LDPE, HDPE, PS, PVC, and PET was carbonized individually on MgO at MgO/polymer ratio of 6. As shown in Fig. 2, PS produced the highest yield of carbon (27.1 wt%). The yield of carbon from PP, HDPE, and LDPE was a little lower than that from PS. The highest yield of carbon for PS may come from the high yield of aromatic compounds, which tend to form carbon on template.35 The formation mechanism of carbon will be discussed later. PVC produced the lowest yield of carbon of 16.8 wt% because the pyrolysis of PVC generates 38.5 wt% of HCl, which reacts with MgO and forms MgCl2. The yield of carbon for PET was also as low as 17.9 wt%. The reason will also be discussed later. The yield of carbon for mixed plastics was closed to that for PP, LDPE, HDPE, and PS because the mixed plastics contain high level of these four plastics.
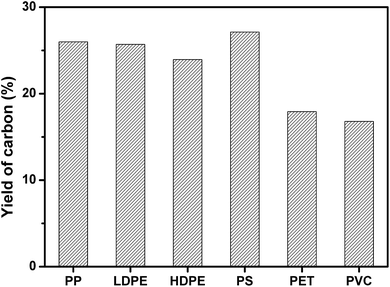 | ||
| Fig. 2 Yield of carbon for the carbonization of different single polymers at a weight ratio of MgO/polymer of 6 on MgO at 500 °C for 1 h in an autoclave reactor. | ||
Fig. 3 shows the yield of carbon prepared at 500 °C and different weight ratios of mixed plastics to MgO at 500 °C for 60 minutes. When the weight ratio of MgO to mixed plastics increased, the yield of carbon increased and reached a maximum at a weight ratio of MgO/plastic of 6. Only a part of degraded products can be transformed into carbon when the mass of MgO is little. More MgO affords more active sites for degraded products to form carbon. The maximum yield of porous carbon sheet was 26.5 wt% relative to polymer and 33.4 wt% relative to carbon in polymer. When the weight ratio of MgO to plastics further increased to 8, the yield of carbon decreased slightly. This trend is similar to that of carbonization of PS on MgO under atmospheric pressure.35 However, the yield of carbon was only 10.8 wt% at a MgO/PS weight ratio of 10 at 700 °C and atmospheric atmosphere, which is far lower than that obtained in autoclave reactor because the reaction rate of degraded products of polymer on MgO is slow. Volatile degradation products of plastics escaped before the carbonization. Nevertheless, they are prevented from leaving in the closed reactor. The sufficient contact promotes the carbonization.
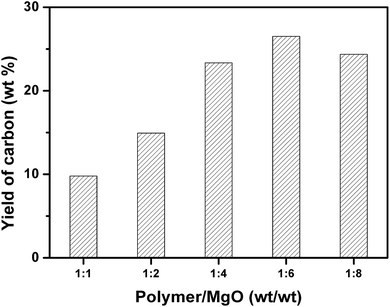 | ||
| Fig. 3 Yield of carbon for the carbonization of mixed plastics in relation to weight ratio of plastic to MgO at 500 °C for 60 minutes in an autoclave reactor. | ||
Morphology, phase structure and textural properties of the porous carbon sheets
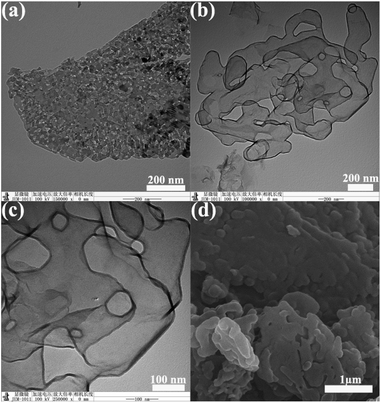
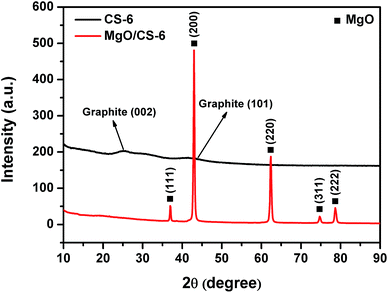
TEM image of MgO is shown in Fig. 4a. TEM and SEM images of CS-6 are shown in Fig. 4b–d. MgO displays a typical flake-like morphology with irregular pores on the surface. From Fig. 4b and c, the obtained carbon exhibited sheet morphology, which resembled the initial morphology of MgO. This is the evidence of role of MgO as a template for the shape controlled growth of nanocarbons. Amorphous carbon was not seen on these images. The SEM image (Fig. 4d) showed that the carbon flakes stacked together.Fig. 5 shows the XRD patterns of CS-6 and MgO/carbon composites. The diffraction peaks at 2θ = 36.9° (111), 42.9° (200), 62.3° (220), 74.6° (311), and 78.6° (222) were attributed to MgO phase, which suggests the unchanged structure of MgO after carbonization. When MgO was removed, the diffraction peaks of MgO disappeared completely and two weak and broad diffraction lines at 2θ = 26.2° and 43° appeared. These two peaks were assigned to the typical graphitic (002) and (101) planes, respectively. The broad peak of the carbon sheet reflected the disorder and irregular arrangement of carbon layers, which agreed well with TEM observation.
The nitrogen sorption isotherms and corresponding pore size distributions of carbon sheets prepared at different MgO/polymer ratios are displayed in Fig. 6a and b, respectively. All isotherms are of type III, which is characteristic of materials with low energy of adsorbent–adsorbate interaction. Type H3 hysteresis has been recognized according to the International Union of Pure and Applied Chemistry (IUPAC) classification, which is indicative of non-uniform slit shaped pores formed by aggregates or agglomerates of particles (plates or edged particles like cubes). For this reason, the pore size distribution of obtained carbons was analyzed by QSDFT equilibrium model. The sharp increase at high relative pressure (P/P0 closed to 1) indicated that existence of macropores, which contribute the high pore volume. From Fig. 6b, the porosity of all the samples was comprised mostly of mesopores at the range of 2–8 nm. The size of the resultant nanopores on carbon was far smaller than that on template. This result suggested that the porosity depend on the assembling of the reactant but not fully replicate the pore shape of the template. Morishita et al.30 demonstrated that the particle size of MgO determines the pore size of the mesopores of carbon. The reactant and MgO were same for different samples in this study. So the pore size distributions were similar for carbons obtained at different weight ratio of MgO to plastics.
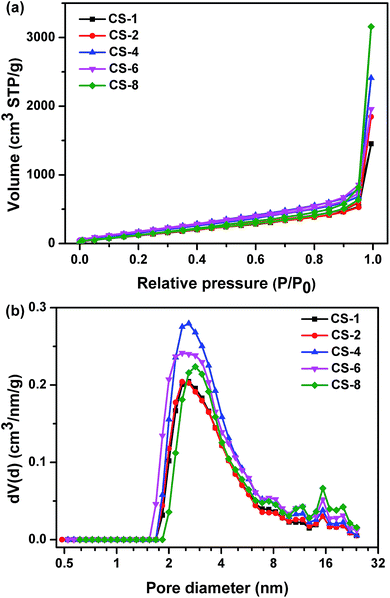 | ||
| Fig. 6 (a) Nitrogen adsorption/desorption isotherms and (b) pore size distributions of carbon sheets obtained at different weight ratios of MgO/polymer at 500 °C for 60 minutes. | ||
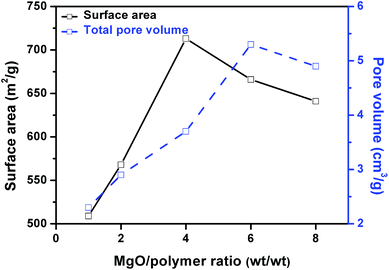
Fig. 7 shows the influence of weight ratio of MgO to mixed plastic on the surface area and pore volume of the obtained carbon. The surface area increased with increasing MgO/polymer ratio up to 4 and after that, the surface area decreased when the MgO/polymer ratio further increased. The maximum surface area of carbon sheet was 713 m2 g−1. This value is lower than that of porous carbon sheets (854 m2 g−1) for the carbonization of PS/MgO. After a certain point, MgO/plastic ratio has a negative effect on the surface area of the carbon. The pore volume exhibited the similar trend but the maximum reached 5.27 cm3 g−1 at a weight ratio of MgO/polymer of 6.
Reaction mechanism
To explore the reaction mechanism, the mixed plastics and MgO were carbonized at reaction time of 0, 30, 60, and 90 min. The reaction of 0 min means that the reaction was stopped when the autoclave reached 500 °C. Fig. 8 shows the product distribution in relation to reaction time at 500 °C and a weight ratio of MgO to plastic of 6. When the reaction temperature reached 500 °C, 42.1 wt% of liquid products, 45.3 wt% of gaseous products, and only 12.6 wt% of porous carbon were produced. The reaction pressure was 0.5 MPa at this point. The plastics were first degraded into liquid and gas during the heating process from 0 to 500 °C, and then the liquid and gas carbonized on template. The slow carbonization is a rate-determining step. When the reaction time increased from 0 to 30 min, liquid declined steeply from 42.1 to 29.8 wt% and carbon increased from 12.6 to 23.5 wt%. The yield of carbon at 30 min increased 1.9 times compared with that at 0 min. At the same time, the yield of gas remained stable. This indicated that liquid products are the main reactants for the formation of carbon during the first 30 minutes. The reaction pressure increased to 1.5 MPa and stabilized after that point. When the reaction time increased from 30 to 60 min, the yield of carbon increased slightly from 23.5 to 26.5 wt% while the yield of gas decreased from 46.7 to 43.1 wt%. The yield of liquid was unchanged. This indicated that gaseous products may involve in the formation of carbon during this period of time. Another possibility is that gas converted into liquid and then liquid produced carbon on MgO. When the reaction time increased from 60 to 90 min, the growth of carbon was closed to stop. Some liquid was produced by secondary reaction between gas and liquid. The effect of reaction time on the composition of liquid and gaseous products were analyzed as follow.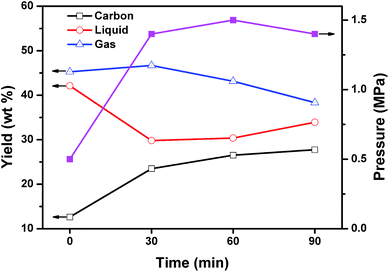 | ||
| Fig. 8 Effect of reaction time on the product distribution and reaction pressure for the carbonization of mixed plastics at 500 °C and a weight ratio of MgO to polymer of 6. | ||
Fig. 9 shows the composition of the gaseous products in relation to reaction time. The gaseous products mainly consisted of H2, CO, CO2, methane, and C2–C5 hydrocarbons including ethane, ethylene, propane, propylene, i-butene, and pentene. The yield of H2 was stable during the whole 90 minutes of reaction. The yield of CO2 and CO was low, which may come from the pyrolysis of PET. Kumagai et al. have reported that terephthalic acid can be selectively converted into benzene and CO2 through deoxygenation of terephthalic acid by the catalysis of CaO.36 The yield of C2–C5 alkenes declined linearly from 62.3 to 7.0 mL g−1 polymer when the reaction time increased from 0 to 60 min, and then increased slightly to 20.4 mL g−1 polymer at 90 min. At the same time, the yield of methane increased from 190.1 to 361.8 mL g−1 polymer until 60 min, and then decreased a little to 328.6 mL g−1 polymer. Methane exhibited a reciprocal relation with alkene as reaction time increased. The yield of C2–C5 alkanes remained almost unchanged during the whole process. These results suggested that C2–C5 alkenes cracked into methane. The calorific value at reaction time of 0, 30, 60, and 90 min was calculated to be 26.6, 23, 22.9 and 21.4 MJ kg−1 plastics respectively, which can be used as fuel to supply the energy of carbonization process.
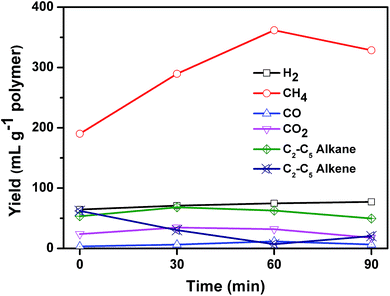 | ||
| Fig. 9 Effect of reaction time on the composition of gas for the carbonization of mixed plastics at 500 °C and a weight ratio of MgO to polymer of 6. | ||
The liquid products from carbonization of mixed plastics on MgO for different reaction time were analyzed using GC-MS. The compounds and the area percentages of the peaks are given in Table S1.† These components were grouped into different classes including aliphatic compounds (C10–C44) and aromatics. Fig. 10 shows the variation in the total concentrations (expressed as area percentages) at different reaction time. The liquid products contained 56.3% of alkenes and 16% aromatics at 0 min. The aliphatic fractions from C10 to C44 accounted for 72.3% of the total chromatographic peak area and most alkenes were α-olefins. These results indicated that polymers like PE and PP first degraded following a random degradation mechanism. The concentrations of alkenes and alkanes decreased rapidly from 72.3% to 16.9% with an increase in reaction time to 30 min, and then leveled off as the reaction progress. The concentrations of monoaromatics (such as benzene), diaromatics (such as naphthalene), and tricyclic aromatics (such as anthracene) all increased during the first 30 min. For example, the concentration of monoaromatics increased from zero to 23.7% and the concentration of diaromatics increased from 9 to 25.2%. Monoaromatics and diaromatics dominated at reaction time of 30 min. This phenomenon indicated that aliphatic compounds with long chains undergo isomerization, dehydrogenation, and aromatization reactions during the first 30 min reaction. When the reaction time increased from 30 to 60 min, the concentration of monoaromatics decreased from 23.7% to zero while the concentration of both diaromatics and PAHs increased. As the reaction time further increased to 90 min, the concentration of naphthalene and its derivates decreased from 29.8 to 2.7% while the concentration of PAHs kept increasing. In conclusion, the decline of aliphatic compounds favored the production of aromatic as the reaction progress. The number of benzene rings became higher at longer reaction time. Aliphatic compounds are hard to deposit on MgO template to produce carbon directly so that aliphatic compounds may be converted into aromatics by cyclization and dehydrogenation reaction, which involves the carbonization reaction as an intermediate.
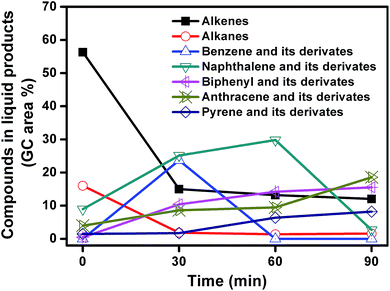 | ||
| Fig. 10 Change in the GC peak area of the different compounds in liquid products from decomposition of MgO and mixed plastics for different reaction time. | ||
The GC-MS results indicate that aromatics may account for the growth of nanocarbon on the template. To further evidence this deduction, model aromatic compounds including benzene, methylbenzene, dimethylbenzene, styrene, naphthalene, anthracene, and phenanthrene were carbonized on MgO in autoclave reactor. Fig. 11 shows the yield of carbon through carbonization of different model aromatic compounds. The yield of carbon using benzene as carbon source was only 0.4 wt%. This result can also explain why the yield of carbon from PET was low (Fig. 2). A lot of benzene were produced during the pyrolysis of PET. As the number of side-chain on benzene increased, the yield of carbon increased. For example, the yield of carbon derived from styrene was 22.5 wt%. Naphthalene and anthracene gave 18.8 and 44.1 wt% of carbon respectively, which may be due to that anthracene is more reactive than naphthalene. The yield of carbon from phenanthrene was lower than 10 wt%, suggesting that acenes produce more carbon on MgO. The number of benzene rings and side chain of the aromatics play an important role for the reaction rate of carbonization. We have reported PAHs are the main carbon sources for the growth of nanocarbon from PS at 700 °C and atmospheric pressure. This conclusion is not contradictory from that of this study because monoaromatics and diaromatics tend to volatile and escape during the heating process without the limitation of autoclave reactor.
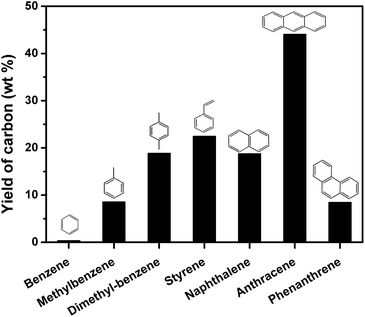 | ||
| Fig. 11 The yield of carbon through carbonization of model aromatic compounds in relation to reaction time in autoclave reactor on sheet MgO at 500 °C for 60 min. | ||
On the basis of the above results and previous works,13,35 a possible bottom-up fabrication of nanocarbons from aromatics was put forward. MgO had little effect on the pyrolysis of PP, LDPE, HDPE, and PS but influenced greatly on the pyrolysis of PVC and PET. PVC first decomposed and released HCl at about 300 °C. The produced HCl was absorbed by MgO because no chloride was detected in the gaseous and liquid products. Thermal decomposition of polyolefins takes place following a random degradation mechanism. These plastics were firstly cracked into carbon, gas, and liquid. The liquid products were dominated by aliphatic compounds with long chain including alkanes and alkenes. As the reaction progress, the aliphatic compounds with long chains transformed into aromatics through cyclization, dehydrogenation, and aromatization reactions. Onwudili et al. reported that cyclization and aromatization of olefins and paraffins from LDPE take place at around 500 °C.37 From GC-MS results and model experiments, most aromatic compounds especially PAHs were the main source for the growth of nanocarbon on MgO. Aromatics deposited and assembled on the surface of MgO by direct dehydrogenation and condensation reaction to form graphene layer, which can be viewed as a large PAH. MgO provides a template for controlling morphology of the carbon.
Conclusions
In this work, pressurized carbonization has been used to produce porous carbon sheets on MgO from mixed plastics consisting of PP, HDPE, LDPE, PS, PET, and PVC at 500 °C. The effect of weight ratio of MgO to mixed plastic on the yield and textural properties of the porous carbons have been investigated. MgO acts as a template for the shape-controlled growth of porous carbon sheet and more MgO promotes the yield of carbon. The maximum yield of porous carbon sheet was 33.4 wt% relative to carbon in polymer at relatively low reaction temperature. The maximum surface area of porous carbon sheets is 713 m2 g−1 at a weight ratio of MgO/mixed plastic of 4 and the maximum pore volume was 5.27 cm3 g−1 at a weight ratio of MgO/polymer of 6. The weight ratio of MgO to plastics has little effect on the pore size distribution of the porous carbon. The influence of reaction time on the product distribution and composition of gas and liquid has been studied to explore the reaction mechanism. The porous carbon is bottom-up fabricated by aromatics from the pyrolysis of mixed plastics. The model test also supports this conclusion and further shows polycyclic aromatic hydrocarbons especially acenes produce more carbon. This simple approach provides a way to transform waste plastics into value-added porous carbons, in accordance with the urgent necessity of waste reduction and sustainability. On the other hand, coproduction of high valuable oil and gas during the carbonization process could raise economic benefit of the whole process. Further research is needed to balance the composition of carbon, oil and gas and improve the quality of each component.Conflicts of interest
There are no conflicts to declare.Acknowledgements
The work was financially supported by the National Natural Science Foundation of China (NSFC 51373171 and 21201155). The work is cofounded by the Natural Science Young Scholars Foundation of Shanxi Province (No. 2012021007-5 and 2013021008-6) and Program for the Top Young Academic Leaders of Higher Learning Institutions of Shanxi and the Innovative Talents of Higher Learning Institutions of Shanxi.References
- J. Scheirs, Polymer recycling: science technology and applications, John Wiley & Sons Ltd., Chichester, 1998 Search PubMed.
- J. Scheirs and W. Kaminsky, Feedstock recycling and pyrolysis of waste plastics: Converting waste plastics into diesel and other fuels, John Wiley & Sons Ltd., Chichester, 2006 Search PubMed.
- K. Hamad, M. Kaseem and F. Deri, Polym. Degrad. Stab., 2013, 98, 2801 CrossRef CAS.
- C. F. Wu and P. T. Williams, Fuel, 2010, 89, 3022 CrossRef CAS.
- A. Bazargan and G. McKay, Chem. Eng. J., 2012, 195, 377 CrossRef.
- J. J. Deng, Y. You, V. Sahajwalla and R. K. Joshi, Carbon, 2016, 96, 105 CrossRef CAS.
- C. W. Zhuo and Y. A. Levendis, J. Appl. Polym. Sci., 2013, 131, 39931 Search PubMed.
- R. J. Song, Z. W. Jiang, W. G. Bi, W. X. Cheng, J. Lu, B. T. Huang and T. Tang, Chem.–Eur. J., 2007, 13, 3234 CrossRef CAS PubMed.
- J. Liu, Z. W. Jiang, H. O. Yu and T. Tang, Polym. Degrad. Stab., 2011, 96, 1711 CrossRef CAS.
- Q. H. Kong and J. H. Zhang, Polym. Degrad. Stab., 2007, 92, 2005 CrossRef CAS.
- J. Gong, J. Liu, Z. W. Jiang, X. C. Chen, X. Wen, E. Mijowska and T. Tang, Appl. Catal., B, 2014, 152–153, 289 CrossRef CAS.
- V. G. Pol, Environ. Sci. Technol., 2010, 44, 4753 CrossRef CAS PubMed.
- J. Gong, J. Liu, X. Wen, Z. W. Jiang, X. C. Chen, E. Mijowska and T. Tang, Ind. Eng. Chem. Res., 2014, 53, 4173 CrossRef CAS.
- A. Bazargan, C. W. Hui and G. Mckay, Porous carbons-hyperbranched polymers-polymer solvation, ed. T. E. Long, B. Voit and O. Okay, Springer, Switzerland, 2015, ch. 1, p. 1 Search PubMed.
- J. Gong, J. Liu, X. C. Chen, Z. W. Jiang, X. Wen, E. Mijowska and T. Tang, J. Mater. Chem. A, 2015, 3, 341 CAS.
- L. Gonsalvesh, S. P. Marinov, G. Gryglewicz, R. Carleer and J. Yperman, Fuel Process. Technol., 2016, 149, 75 CrossRef CAS.
- W. M. Qiao, S. H. Yoon, Y. Korai, I. Mochida, S. Inoue, T. Sakurai and T. Shimohara, Carbon, 2004, 42, 1327 CrossRef CAS.
- J. Gong, K. Yao, J. Liu, Z. W. Jiang, X. C. Chen, X. Wen, E. Mijowska, N. N. Tian and T. Tang, J. Mater. Chem. A, 2013, 1, 5247 CAS.
- R. Mendoza-Carrasco, E. M. Cuerda-Correa, M. F. Alexandre-Franco, C. Fernandez-Gonzalez and V. Gomez-Serrano, J. Environ. Manage., 2016, 181, 522 CrossRef CAS PubMed.
- J. Hayashi, N. Yamamoto, T. Horikawa, K. Muroyama and V. G. Gomes, J. Colloid Interface Sci., 2005, 281, 437 CrossRef CAS PubMed.
- J. Choma, M. Marszewski, L. Osuchowski, J. Jagiello, A. Dziura and M. Jaroniec, ACS Sustainable Chem. Eng., 2015, 3, 733 CrossRef CAS.
- C. R. Belo, I. P. P. Cansado and P. A. M. Mourão, Environ. Technol., 2017, 38, 285 CrossRef CAS PubMed.
- K. László, E. Tombácz and K. Josepovits, Carbon, 2001, 39, 1217 CrossRef.
- I. Fernández-Morales, M. C. Almazán-Almazán, M. Pérez-Mendoza, M. Domingo-García and F. J. López-Garzón, Microporous Mesoporous Mater., 2005, 80, 107 CrossRef.
- E. Lorenc-Grabowska, M. A. Diez and G. Gryglewicz, J. Colloid Interface Sci., 2016, 469, 205 CrossRef CAS PubMed.
- W. Bratek, A. Światkowski, M. Pakuła, S. Biniak, M. Bystrzejewski and R. Szmigielski, J. Anal. Appl. Pyrolysis, 2013, 100, 192 CrossRef CAS.
- F. Lian, B. Xing and L. Zhu, J. Colloid Interface Sci., 2011, 360, 725 CrossRef CAS PubMed.
- M. Adibfar, T. Kaghazchi, N. Asasian and M. Soleimani, Chem. Eng. Technol., 2014, 37, 979 CrossRef CAS.
- M. Inagaki, M. Toyoda, Y. Soneda and S. Tsujimura, Carbon, 2016, 107, 448 CrossRef CAS.
- T. Morishita, T. Tsumura, M. Toyoda, J. Przepiorski, A. W. Morawski, H. Konno and M. Inagaki, Carbon, 2010, 48, 2690 CrossRef CAS.
- L. Wan, Q. F. Zhao, P. Zhao, B. He, T. Y. Jiang, Q. Zhang and S. L. Wang, Carbon, 2014, 79, 123 CrossRef CAS.
- B. Z. Tian, S. A. Che, Z. Liu, X. Y. Liu, W. B. Fan, T. Tatsumi, O. Terasaki and D. Y. Zhao, Chem. Commun., 2003, 2003, 2726 RSC.
- C. Yu, J. Fan, B. Tian, D. Zhao and G. D. Snicky, Adv. Mater., 2002, 14, 1742 CrossRef CAS.
- J. Gong, B. Michalkiewicz, X. C. Chen, E. Mijowska, J. Liu, Z. W. Jiang, X. Wen and T. Tang, ACS Sustainable Chem. Eng., 2014, 2, 2837 CrossRef CAS.
- Y. L. Wen, J. Liu, J. F. Song, J. Gong, H. Chen and T. Tang, RSC Adv., 2015, 5, 105047 RSC.
- S. Kumagai, G. Grause, T. Kameda, T. Takano, H. Horiuchi and T. Yoshioka, Ind. Eng. Chem. Res., 2011, 50, 6594 CrossRef CAS.
- J. A. Onwudili, N. Insura and P. T. Williams, J. Anal. Appl. Pyrolysis, 2009, 86, 293 CrossRef CAS.
Footnote |
| † Electronic supplementary information (ESI) available: Compounds of the liquid products from carbonization of the mixed plastics and MgO at 500 °C in relation to reaction time (Table S1). See DOI: 10.1039/c7ra12733b |
| This journal is © The Royal Society of Chemistry 2018 |

