 Open Access Article
Biocompatible tumor-targeting nanocomposites based on CuS for tumor imaging and photothermal therapy
Li Liang†
,
Shuwen Peng†,
Zhenwei Yuan,
Chen Wei,
Yuanyuan He,
Jinrong Zheng,
Yueqing Gu and
Haiyan Chen *
*
Department of Biomedical Engineering, School of Engineering, China Pharmaceutical University, 24 Tongjia Lane, Gulou District, Nanjing 210009, China. E-mail: chenhaiyan@cpu.edu.cn; Fax: +86-25-83271046; Tel: +86-25-83271080
First published on 6th February 2018
Abstract
Active targeting of tumor receptors is a significant approach for cancer diagnosis. Additionally, development of photothermal agents for photothermal therapy (PTT) has attracted great interest in the field of nanomedicine. In the present study, copper sulfide (CuS) nanoparticles capped with bovine serum albumin (BSA), named CuS@BSA, was synthesized by a convenient method. Then, the near-infrared (NIR) fluorescence probe MBA and the tumor-targeting ligand cyclic RGD were further conjugated on the surface of CuS@BSA, and the obtained nanocomposite was named CuS@BSA-MBA-cRGD. The morphology, optical properties, biotoxicity, tumor-targeting capability and in vitro and in vivo tumor inhibition effect were all characterized comprehensively. This nanocomplex demonstrated enhanced photothermal effects and positive tumor targeting. Thus, the nanocomposite CuS@BSA-MBA-cRGD can used as a promising tumor-targeting PTT agent for simultaneous cancer imaging and photothermal treatment.
1. Introduction
In recent years, near-infrared (NIR) laser-induced photothermal therapy (PTT), has attracted widespread attention. The energy of NIR light is transferred into heat in PTT, which causes tumor cell apoptosis, without damaging normal cells.1–4 At present, the development of PTT is mainly dependent on designing novel photothermal agents for transferring light energy to heat effectively. Moreover, PTT combined with tumor imaging facilitates accurate and effective guidance in the treatment of cancer.5–10Theranostics, combining the contrast agents for diagnostics and drugs for therapy, is an effective approach for cancer treatment and risk reduction.6,7 Owing to the unique nano-size effect of nano-materials, it can avoid being captured by the reticular endothelial system (RES) and easily penetrate into the tumor vasculars.11,12 Therefore, a variety of multifunctional nanoparticles are widely used in cancer diagnosis and treatment.13,14 Copper sulfide nanoparticles (CuS NPs) are featured with prominent absorbance and effective heat conversion effect, small particle size, easy modification, and simple preparation. It can be used as a functional component to combine with other diagnostic contrast agents, and then the multi-functional nanocomposite are obtained.10,15,16 Hou et al.17 reported that a localized diffusion molecular retention (DMR) tumor targeting drug delivery system based on hollow mesoporous CuS NPs (HMCuS NPs) entrapment of anticancer drug. HMCuS NPs possess the property suitable for photoacoustic imaging, which could offer us a theranostic platform. It is also reported that a ultrasmall CuS NPs inside the cavity of ferritin (Fn) nanocages was synthesized by a biomimetic synthesis method.18 With the incorporation of radionuclide 64Cu, 64CuS–Fn NCs are served as excellent PET imaging and photothermal therapy agents to achieve superior cancer therapeutic efficiency with good biocompatibility both in vitro and in vivo.
In this paper, bovine serum albumin (BSA) capped CuS NPs were synthesized to further enhance the biocompatibility and stability of CuS NPs.19 Integrin αvβ3, a cell-adhesion molecule that is overexpressed on both proliferating tumor vasculature and certain tumors cells20 was chosen as the molecular target in this study. Cyclic arginine–glycine–aspartic acid (cRGD) peptide is a potent integrin αvβ3 antagonist and has selective affinity for αvβ3. Followed by coupling with NIR probe (MBA) and the tumor targeting ligand cRGD, the functional nanocomposites (CuS@BSA-MBA-cRGD) were obtained. First, the optical properties, photothermal effect and cytotoxicity of CuS@BSA-MBA-cRGD were all evaluated. Then, in vivo dynamics and tumor-targeting capability of CuS@BSA-MBA-cRGD were all investigated in normal mouse and tumor-bearing mouse models. Finally, the tumor inhibition effect was evaluated in cell and animal levels.
2. Materials and methods
2.1 Materials
Thioglycolic acid (TGA), CuCl2·2H2O, sodium hydroxide (NaOH), anhydrous ethanol (AR), 1-ethyl-3-[3-dimethylaminopropyl]carbodiimide hydrochloride (EDC) and N-hydroxysuccinimide (NHS) were bought from Sinopharm Chemical Reagent Co. (Shanghai, China). NIR fluorescence probe MBA (MW = 768) was synthesized in our laboratory. CRGD was obtained from Nanjing Peptide Industry Biotechnology Co. (Nanjing, China). Thioacetamide (TAA) were purchased from Aladdin (Shanghai, China). 3-(4,5-Dimethylthialzol-2-yl)-2,5-diphenyltetrazolium bromide (MTT), DMEM medium, fetal bovine serum (FBS), penicillin, streptomycin, dimethyl sulfoxide (DMSO), trypsin–EDTA, bovine serum albumin (BSA), and Hoechst 33342 were purchased from Jiangsu Kaiji Biotechnology Co. (Jiangsu China). Ultrapure millipore water (18.2 MU) was used. All other solvents and reagents used in this study were certified analytical reagent grade.2.2 Synthesis of MBA
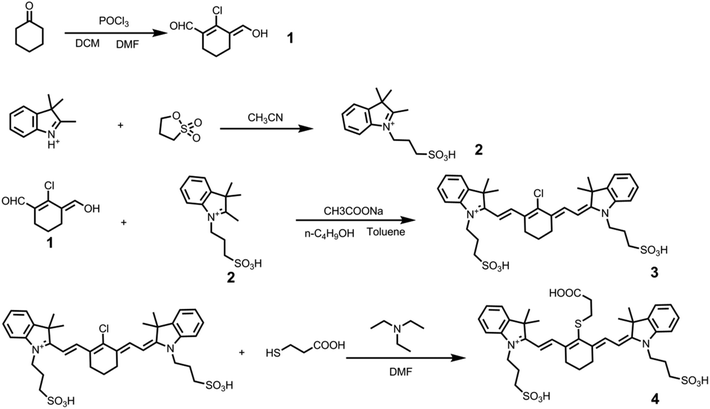
1H-NMR (500 MHz, DMSO-d6) δ: 10.86 (s, 1H), 10.15 (s, 1H), 7.56 (s, 1H), 2.38 (m, 4H), 1.57–1.62 (qui, 2H, J = 5 Hz); HRMS (ESI): (M + H)+ calcd for C8H10ClO2, 172.0291; found 172.0294.
![[thin space (1/6-em)]](https://www.rsc.org/images/entities/char_2009.gif) :
:![[thin space (1/6-em)]](https://www.rsc.org/images/entities/char_2009.gif) 1, v/v) as eluent, to obtain compound 2 as a pale purple solid powder (1.82 g, 51.64%, mp 216 °C).
1, v/v) as eluent, to obtain compound 2 as a pale purple solid powder (1.82 g, 51.64%, mp 216 °C).HRMS (ESI): m/z, calcd for C14H20NO3S 282.1159 (M + H)+, found 282.1163.
![[thin space (1/6-em)]](https://www.rsc.org/images/entities/char_2009.gif) :
:![[thin space (1/6-em)]](https://www.rsc.org/images/entities/char_2009.gif) 1) in a flask equipped with a Dean–Stark trap. The mixture was refluxed for 12 h to give dark green solution. After the reaction was completed, the solvent was removed under reduced pressure to give the crude product. Purification of the crude product by column chromatography on silica gel using DCM and methanol (25
1) in a flask equipped with a Dean–Stark trap. The mixture was refluxed for 12 h to give dark green solution. After the reaction was completed, the solvent was removed under reduced pressure to give the crude product. Purification of the crude product by column chromatography on silica gel using DCM and methanol (25![[thin space (1/6-em)]](https://www.rsc.org/images/entities/char_2009.gif) :
:![[thin space (1/6-em)]](https://www.rsc.org/images/entities/char_2009.gif) 1, v/v) as eluent, to give compound 3 as a green solid powder (1.32 g, 64.91%, mp 258 °C).
1, v/v) as eluent, to give compound 3 as a green solid powder (1.32 g, 64.91%, mp 258 °C).HRMS (ESI): m/z, calcd for C36H44ClN2O6S2 699.2324 (M + H)+, found 699.2342.
![[thin space (1/6-em)]](https://www.rsc.org/images/entities/char_2009.gif) :
:![[thin space (1/6-em)]](https://www.rsc.org/images/entities/char_2009.gif) 1, v/v) as eluent, to give compound 4 (MBA) as a green solid powder (0.16 g, 75.05%, mp 258 °C). HRMS (ESI): m/z, calcd for C39H49N2O8S3 769.2646 (M + H)+, found 769.2659.
1, v/v) as eluent, to give compound 4 (MBA) as a green solid powder (0.16 g, 75.05%, mp 258 °C). HRMS (ESI): m/z, calcd for C39H49N2O8S3 769.2646 (M + H)+, found 769.2659.2.3 Synthesis of CuS NPs
CuS NPs were synthesized according to a previous report with amplification and modification.21,22 Specifically, CuCl2·2H2O (0.25 mmol) was dissolved in 100 mL of ultrapure water and then TGA (0.5 mmol) was added dropwise with rapid stirring. The pH of the mixed solution was adjusted with 1 M NaOH solution to 9.0. Thioacetamide (0.1 mmol) was dissolved in 20 mL of distilled water and then injected to the above solution. Lastly, the mixture was stirred under a nitrogen atmosphere for 8 h at 50 °C. The obtained product was freeze-dried and stored at 4 °C for further study.2.4 Synthesis of CuS@BSA
CuS NPs were capped with BSA using the coupling agents (EDC and NHS) to increase the reaction yield. First, 0.191 g of EDC and 0.115 g of NHS (molar ratio of EDC and NHS is 1![[thin space (1/6-em)]](https://www.rsc.org/images/entities/char_2009.gif) :
:![[thin space (1/6-em)]](https://www.rsc.org/images/entities/char_2009.gif) 1) were dissolved in 40 mL of CuS NPs solution, stirred at 40 °C for 1 h. Subsequently, by centrifuging at 10
1) were dissolved in 40 mL of CuS NPs solution, stirred at 40 °C for 1 h. Subsequently, by centrifuging at 10![[thin space (1/6-em)]](https://www.rsc.org/images/entities/char_2009.gif) 000 rpm for 5 min, the activated CuS NPs was obtained and re-dissolved in 40 mL of PBS (pH = 7.4) buffer, and then 100 mg of BSA was added into the solution to react overnight. The mixture was purified by centrifuging (12
000 rpm for 5 min, the activated CuS NPs was obtained and re-dissolved in 40 mL of PBS (pH = 7.4) buffer, and then 100 mg of BSA was added into the solution to react overnight. The mixture was purified by centrifuging (12![[thin space (1/6-em)]](https://www.rsc.org/images/entities/char_2009.gif) 000 rpm, 10 min) and re-dissolved in PBS buffer to remove residual BSA, and this process was carried out 3 times. The final product CuS@BSA was stored at 4 °C for further study.
000 rpm, 10 min) and re-dissolved in PBS buffer to remove residual BSA, and this process was carried out 3 times. The final product CuS@BSA was stored at 4 °C for further study.
2.5 Synthesis of CuS@BSA-MBA
The NIR fluorescence probe MBA was activated by EDC and NHS and then conjugated with CuS@BSA. First, 7.85 mg of MBA (0.01 mmol) was dissolved in 10 mL of ultrapure water and incubated with EDC and NHS (molar ratio of EDC and NHS is 1![[thin space (1/6-em)]](https://www.rsc.org/images/entities/char_2009.gif) :
:![[thin space (1/6-em)]](https://www.rsc.org/images/entities/char_2009.gif) 1) at room temperature for 2 h. Then CuS@BSA was dispersed in 40 mL of PBS, and 500 μL of the activating solution was added dropwise to fully react with BSA for 8 h. Finally, the mixture was collected by centrifuging at 12
1) at room temperature for 2 h. Then CuS@BSA was dispersed in 40 mL of PBS, and 500 μL of the activating solution was added dropwise to fully react with BSA for 8 h. Finally, the mixture was collected by centrifuging at 12![[thin space (1/6-em)]](https://www.rsc.org/images/entities/char_2009.gif) 000 rpm for 10 min and washed thrice with ultrapure water to remove the physically adsorbed MBA on the surface of BSA. The final product CuS@BSA-MBA was also stored at 4 °C.
000 rpm for 10 min and washed thrice with ultrapure water to remove the physically adsorbed MBA on the surface of BSA. The final product CuS@BSA-MBA was also stored at 4 °C.
2.6 Synthesis of CuS@BSA-MBA-cRGD
CuS@BSA-MBA was activated by EDC and NHS (molar ratio of EDC and NHS is 1![[thin space (1/6-em)]](https://www.rsc.org/images/entities/char_2009.gif) :
:![[thin space (1/6-em)]](https://www.rsc.org/images/entities/char_2009.gif) 1) in the dark at room temperature for 4 h. Then the supernatant containing EDC and NHS was removed by centrifuging, and the precipitate was re-dissolved in ultrapure water. Subsequently, the aqueous solution containing cRGD was added into the above complex solution to react at room temperature for 8 h. Finally, the mixture was collected by centrifugation and was washed thrice with ultrapure water. The obtained product was stored at 4 °C in the dark.
1) in the dark at room temperature for 4 h. Then the supernatant containing EDC and NHS was removed by centrifuging, and the precipitate was re-dissolved in ultrapure water. Subsequently, the aqueous solution containing cRGD was added into the above complex solution to react at room temperature for 8 h. Finally, the mixture was collected by centrifugation and was washed thrice with ultrapure water. The obtained product was stored at 4 °C in the dark.
2.7 Characterization of CuS@BSA and its nanocomposites
The morphology and particle size distribution of CuS NPs, CuS@BSA and CuS@BSA-MBA were studied by a FEI Tecnai G2F20 transmission electron microscopy (TEM) with a 200 kV field emission gun. The TEM samples were prepared by drop casting the aqueous solution of CuS@BSA and CuS@BSA-MBA onto 400-mesh carbon-coated copper grids and the excessive solvent was fully evaporated before the TEM investigation. The stability of CuS NPs in deionized water were evaluated by Mastersizer 3000 Laser Particle Size Analyzer (Malvern, British) after 0 day, 1 day, 2 days, 3 days, 4 days and 5 days of preparation, respectively. The absorption spectra of these samples (CuS NPs, MBA, CuS@BSA, CuS@BSA-MBA and CuS@BSA-MBA-cRGD) were determined by Lambda 25 UV-Vis spectrophotometer (PE, USA), and the fluorescence spectra of these samples (MBA, CuS@BSA, CuS@BSA-MBA and CuS@BSA-MBA-cRGD) were determined by LS-55 fluorescence spectrophotometer (PE, USA). The infrared spectra were measured on an infrared spectrophotometer (Nicolet ECO 2000, USA). The photothermal effects of these samples (CuSNPs, MBA, CuS@BSA, CuS@BSA-MBA and CuS@BSA-MBA-cRGD) were measured by a sensitive digital thermometer (TES-1320, Taiwan) with the irradiation of a laser (808 nm, 1.0 W cm−2).2.8 Cell culture
The human cell lines U87MG (malignant glioma) and L02 (human normal liver cell line) were obtained from American Type Culture Collection (ATCC, USA). These cell lines were cultured in DMEM medium supplemented with 10% (v/v) calf serum, penicillin (100 U mL−1) and streptomycin (100 mg mL−1). Cells were maintained at 37 °C under a humidified atmosphere containing 5% CO2.2.9 Cytotoxicity of CuS NPs, CuS@BSA-MBA and CuS@BSA-MBA-cRGD
MTT assessments were carried out to evaluate the cytotoxicity of CuS NPs and their nanocomposites (CuS@BSA, CuS@BSA-MBA and CuS@BSA-MBA-cRGD) on U87MG and L02 cell lines. In detail, the logarithmic growth phase cells were seeded onto 96-well plates with each well by adding 100 μL of 10% FBS DMEM medium (2 × 10⁵ cells per well) and subsequently incubated at 37 °C for 24 h in a CO2 cultures box. The cells were further maintained at 37 °C for 24 h after incubating with CuS NPs, CuS@BSA, CuS@BSA-MBA and CuS@BSA-MBA-cRGD at a wide concentration range from 10 μg mL−1 to 200 μg mL−1. After that, each well was washed three times with PBS before addition of MTT solution (10 μL, 5.0 mg mL−1) and then incubated for another 4 h.The medium containing MTT was carefully removed and 150 μL of DMSO was added into each well. The plates were gently shaken for 15 min at room temperature before the absorbance measurement. The optical density (OD) was measured using a multi-well plate reader at 490 nm. The cell viability was calculated using the following equation: viable cells (%) = (ODtreated/ODcontrol) × 100%. Where ODtreated was obtained in the presence of the samples; ODcontrol was obtained from the incubation medium.
In addition, MTT assessments were carried out to evaluate the inhibition effect on tumor cells. Five groups were named as NIR (single light), CuS NPs + NIR, CuS@BSA + NIR, CuS@BSA-MBA + NIR and CuS@BSA-MBA-cRGD + NIR. The cells were cultured for 24 h before incubating with CuS NPs, CuS@BSA, CuS@BSA-MBA and CuS@BSA-MBA-cRGD for another 4 h at a wide concentration range from 10 μg mL−1 to 200 μg mL−1. Then an 808 nm NIR laser was utilized to irradiate the cells for 5 min with a power of 1.0 W cm−2 and the cells were incubated at 37 °C with 5% CO2 for 24 h. Finally, the survival ratio of the cells in different groups were evaluated by MTT assessment.
2.10 In vivo experiment
The body weight and tumor size of each mouse was monitored every day over 10 days. The tumor volume was calculated as tumor volume V = (a × b)2/2, a and b represent the major diameter and minor diameter of the tumor, respectively. The tumor inhibition rate was calculated according to the following equation: inhibition rate = (Vc − Vt)/Vc × 100%, Vc and Vt represents the mean tumor size of the control and treatment groups, respectively. To further investigate the therapeutic effects of CuS@BSA-MBA-cRGD, the tumors of the four groups were excised for pathological analysis after 10 days of treatment.
3. Results and discussion
3.1 Synthesis and characterization of CuS@BSA and its nanocomposites
The NIR probe MBA was synthesized according the synthesis route shown in Fig. 1. The nanocomposites (CuS@BSA-MBA-cRGD) based on CuS@BSA were synthesized according to the schematic illustration in Fig. 2A. The stabilizer of CuS@BSA, BSA, was coated on the surface of CuS NPs and played a vital role in the synthesis process of CuS@BSA-MBA-cRGD due to its functional carboxyl group and amino group. Herein, the amino groups of BSA were conjugated with the activated carboxyl groups of MBA via NHS/EDC to obtain CuS@BSA-MBA.23 Subsequently, the obtained CuS@BSA-MBA was activated with EDC/NHS and reacted with cRGD overnight in the dark to obtain CuS@BSA-MBA-cRGD and then stored at 4 °C. Fig. 2B demonstrates the real color photos of different samples (CuS NPs, CuS@BSA, MBA, CuS@BSA-MBA and CuS@BSA-MBA-cRGD), which shows that the color of CuS@BSA changed from dark green to bright green after the NIR probe MBA conjugated with CuS@BSA. And the addition of cRGD did not change the color of the solution obviously.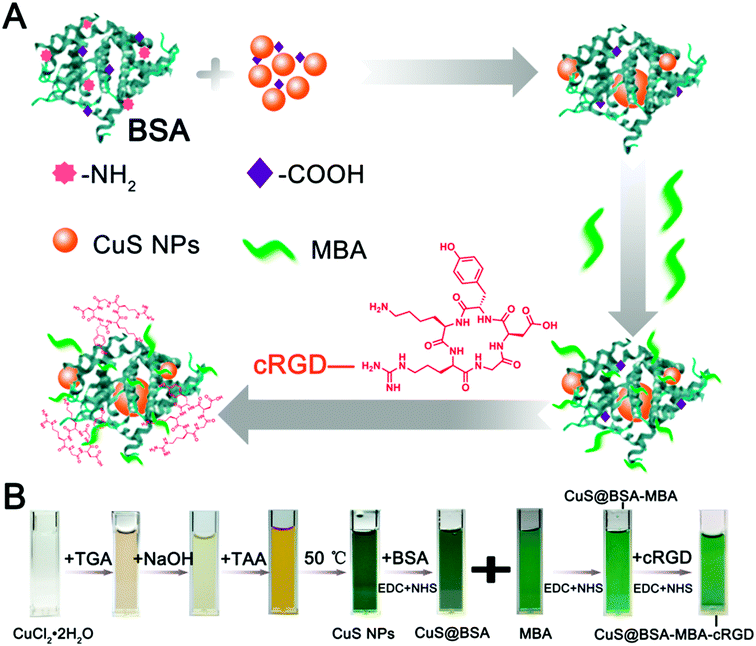 | ||
| Fig. 2 (A) The diagram for the preparation of CuS@BSA-MBA-cRGD; (B) the real color photos of different samples (CuS NPs, CuS@BSA, MBA, CuS@BSA-MBA, CuS@BSA-MBA-cRGD). | ||
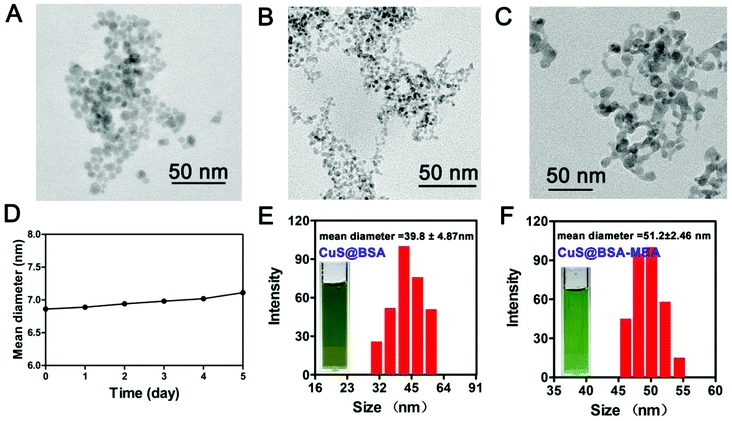
As shown in Fig. 3A, the TEM image indicated spherical shape and homogeneous distribution of CuS nanoparticles. Also, their size distribution in deionized water was studied with 5 days after preparation. The result indicated the favorable stability of CuS nanoparticles due to their constant hydrodiameters in deionized water (Fig. 3D). The TEM images of CuS@BSA and CuS@BSA-MBA were shown in Fig. 3B and C respectively. CuS@BSA and CuS@BSA-MBA are almost spherical shapes and have a homogeneous distribution. Fig. 3E and F show that the mean hydrodynamic diameter of CuS@BSA and CuS@BSA-MBA are 39.8 ± 4.87 nm and 51.2 ± 2.46 nm respectively, and they all displayed narrow size distribution.
As indicated in Fig. 4A, there is no change for the absorption peak of CuS NPs after coupling with BSA. Both of CuS@BSA-MBA and CuS@BSA-MBA-cRGD have the same absorption peak at 787 nm, which is corresponding to the characteristic absorption peak of MBA. As shown in Fig. 4B, the fluorescence peak of MBA shifted from 802 nm to 825 nm after it coupled with CuS@BSA. The fluorescence peak of CuS@BSA-MBA red shifts slightly to 829 nm after it conjugated with cRGD, which indicates that both MBA and cRGD are coupled with CuS@BSA by covalent bond rather than simple physical adsorption. After conjugation with CuS@BSA, the π electron conjugated system with donor and acceptor groups are extended due to the contribution of the new unsaturated groups formed by the conjugation of MPA and CuS@BSA. Therefore, the fluorescence peak of MBA red-shifted around 20 nm.
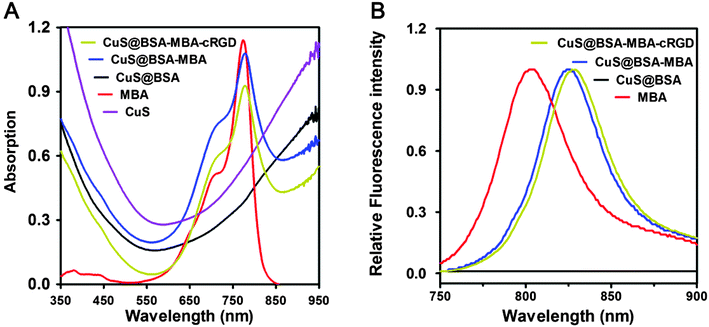 | ||
| Fig. 4 (A) Absorption spectra of CuS NPs, MBA, CuS@BSA, CuS@BSA-MBA and CuS@BSA-MBA-cRGD; (B) fluorescence spectra of MBA, CuS@BSA, CuS@BSA-MBA and CuS@BSA-MBA-cRGD. | ||
The Fourier transfer infrared (FI-IR) spectroscopy of the samples (CuS NPs, CuS@BSA, MBA and CuS@BSA-MBA) are shown in Fig. 5. CuS NPs have a broad band peak at 3448 cm−1, which is corresponding to the deformation vibration of O–H on the carboxyl group (Fig. 5A). The band appearing at 1626 cm−1 can be attributed to the characteristic stretching and bending vibration of C![[double bond, length as m-dash]](https://www.rsc.org/images/entities/char_e001.gif) O on the carboxyl group. The disappearance of the characteristic band of the carboxyl group in CuS@BSA indicates the formation of new covalent bonding groups. The band centered at 3287 cm−1 is attributed to N–H stretching vibration of amide. The characteristic band of 1644 cm−1 is corresponding to C
O on the carboxyl group. The disappearance of the characteristic band of the carboxyl group in CuS@BSA indicates the formation of new covalent bonding groups. The band centered at 3287 cm−1 is attributed to N–H stretching vibration of amide. The characteristic band of 1644 cm−1 is corresponding to C![[double bond, length as m-dash]](https://www.rsc.org/images/entities/char_e001.gif) O stretching vibration of amide, which further indicates that BSA is successfully coupled with CuS NPs. Similarly, the FI-IR spectroscopy (Fig. 5B) of MBA shows a moderate peak at 3384 cm−1, corresponding to the deformation vibration of OH on the carboxyl group. The disappearance of this characteristic band in the FI-IR spectroscopy of CuS@BSA-MBA also proves that MBA has been successfully covalently linked to CuS@BSA.
O stretching vibration of amide, which further indicates that BSA is successfully coupled with CuS NPs. Similarly, the FI-IR spectroscopy (Fig. 5B) of MBA shows a moderate peak at 3384 cm−1, corresponding to the deformation vibration of OH on the carboxyl group. The disappearance of this characteristic band in the FI-IR spectroscopy of CuS@BSA-MBA also proves that MBA has been successfully covalently linked to CuS@BSA.
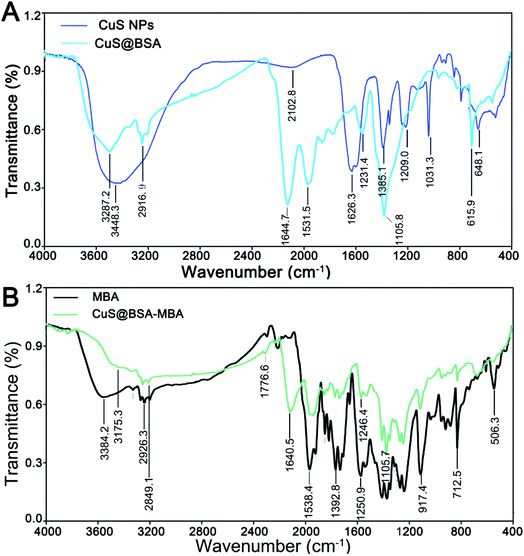 | ||
| Fig. 5 (A) FI-IR spectroscopy of CuS NPs and CuS@BSA; (B) FI-IR spectroscopy of MBA and CuS@BSA-MBA. | ||
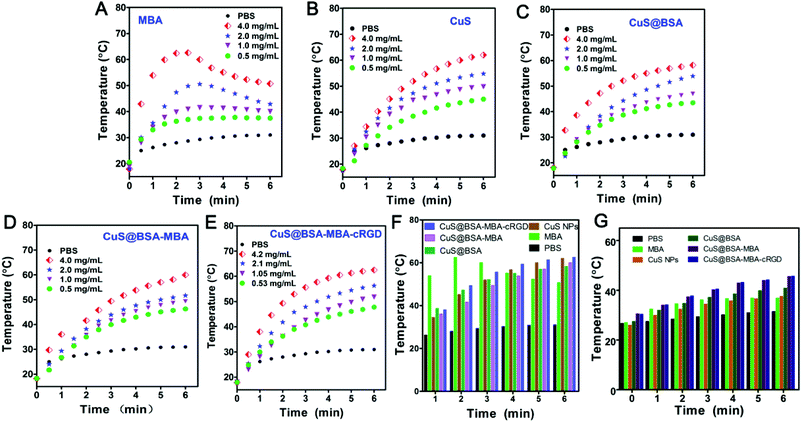
In order to investigate the photothermal effect of CuS NPs and their nanocomposites, four different concentrations of these nanoparticles (MBA, CuS NPs, CuS@BSA, CuS@BSA-MBA and CuS@BSA-MBA-cRGD) were irradiated with an 808 nm laser (a power density of 1.0 W cm−2, 6 min). For different concentrations of MBA, the 2.0 mg mL−1 and 4.0 mg mL−1 concentration curves show a obvious progress of first rise and fall (Fig. 6A). The first rise is due to the strong absorption of MBA around 802 nm and the effective conversion of NIR light to heat. And the fall is due to the photobleaching of the probe after extension of the irradiation time followed by the decreased photothermal conversion efficiency. Fig. 6B indicates that the temperature of CuS NPs increases dramatically as the irradiation time extends. And the temperature curves are concentration dependent. The photothermal variation curves of CuS@BSA (Fig. 6C) show that the temperature increase is not as obvious as CuS NPs at the same experimental condition. The possible mechanism is that BSA coupled to the surface of CuS NPs blocks the irradiation light in some extent, causing CuS@BSA slightly attenuated compared to CuS NPs. CuS@BSA-MBA and CuS@BSA-MBA-cRGD have the obvious photothermal effect compared to CuS@BSA at the same mass (Fig. 6D and E), which can be attributed to the compensation of NIR dye MBA. Moreover, CuS@BSA-MBA-cRGD (Fig. 6E) has similar photothermal effect as CuS@BSA-MBA. As shown in Fig. 6E, the temperature rise profile of CuS@BSA-MBA-cRGD is concentration dependent. For the different concentrations of CuS@BSA-MBA-cRGD aqueous solutions (0.53, 1.05, 2.1, 4.2 mg mL−1), the temperature increased from 17.9 to 62.5 °C after 6 minutes of irradiation. At the concentration of 0.5 mg mL−1, a temperature rise of over 36.3 °C was observed after 2 min of irradiation. At a higher concentration of 4.2 mg mL−1, the temperature increased 49.3 °C. From the semi-quantitative analysis in Fig. 6F and G, it is easily to find out that the nanocomposites based on CuS NPs all exhibited efficient photothermal effect at different concentrations (4.2 mg mL−1 and 200 μg mL−1). The above results indicated that the photothermal agent CuS@BSA-MBA-cRGD has a favorable photothermal conversion efficiency and it is a promising candidate for PTT.
3.2 Cytotoxicity of CuS@BSA-MBA-cRGD in vitro
To evaluate the biocompatibility of CuS@BSA-MBA-cRGD for further biological application, the toxicity of CuS NPs and their nanocomposites were investigated on U87MG tumor cells and L02 normal cells by MTT assessments. As shown in Fig. 7, after 24 h of incubation, the cell survival rate of CuS NPs, CuS@BSA, CuS@BSA-MBA and CuS@BSA-MBA-cRGD are all above 85%, which indicates that all these nanocomposites have good biocompatibility on the cellular level and could be used for further in vivo experiments.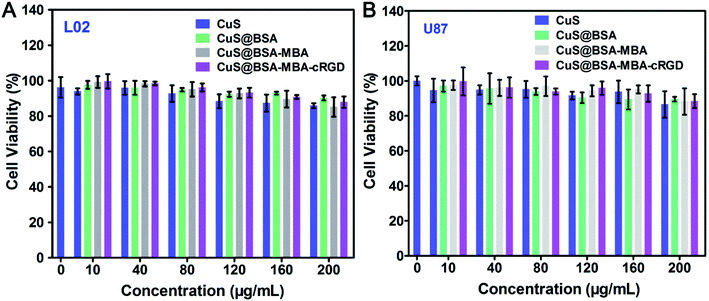 | ||
| Fig. 7 The cytotoxicity evaluation of CuS NPs, CuS@BSA, CuS@BSA-MBA and CuS@BSA-MBA-cRGD on (A) L02 cell line and (B) U87MG cell line. | ||
Chen et al. developed water-soluble CuS NPs capped with mesoporous silica (CuS@MSN) as promising new theranostic agents.24 Although a long-term toxicity study with a large dose of CuS@MSN showed only minor in vivo toxicity, the biodegradation of MSN is still a prominent issue. Inspired by biomineralization, many NPs have been successfully synthesized by biomimetic synthesis methods using different proteins as templates for feasible clinical translation. Herein, BSA as a classic endogenous protein was selected as the templates to prepare CuS@BSA-MBA-cRGD, and the results verified the favorable biocompatibility of this NP for further biological applications.
3.3 Anticancer effect of CuS@BSA-MBA-cRGD in vitro
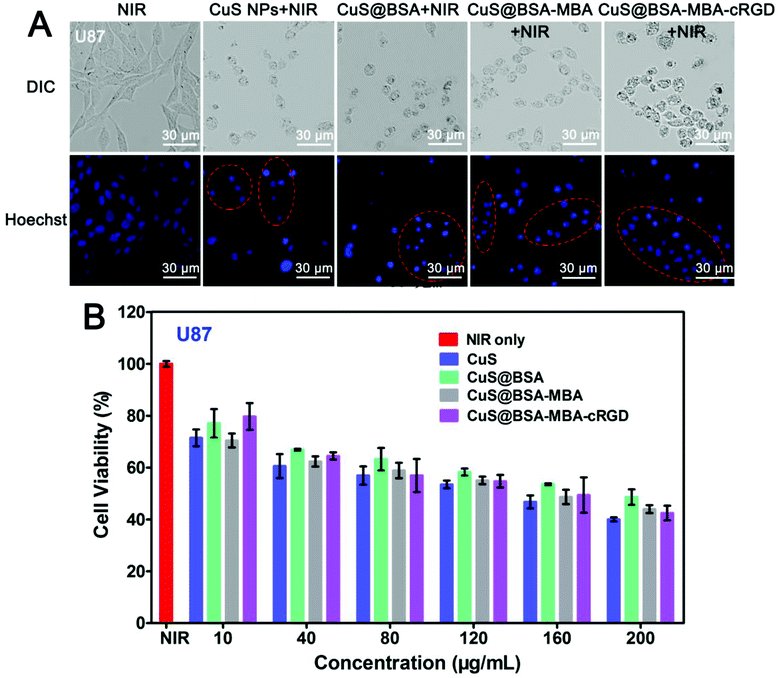
As shown in Fig. 8A, U87MG cells in the NIR group are in full normal shape and no apoptosis was observed. However, the other four groups of the cells, there are obviously characterized with cell deformation and cell shrinkage (as shown in the red circle in Fig. 8A). In addition, the cytotoxicity of CuS@BSA-MBA-cRGD was also quantitatively determined by MTT assay (Fig. 8B). The results indicated that these samples (CuS NPs, CuS@BSA, CuS@BSA-MBA and CuS@BSA-MBA-cRGD) showed dose-dependent antitumor activity. At the highest dose level (200 μg mL−1), CuS NPs + NIR had the best inhibitory effect (60%), and CuS@BSA-MBA-cRGD + NIR was slightly lower (58%). Thus, it is proved that CuS@BSA-MBA-cRGD has an effective inhibition of tumor cell growth.3.4 Biodistribution of CuS@BSA-MBA-cRGD in vivo
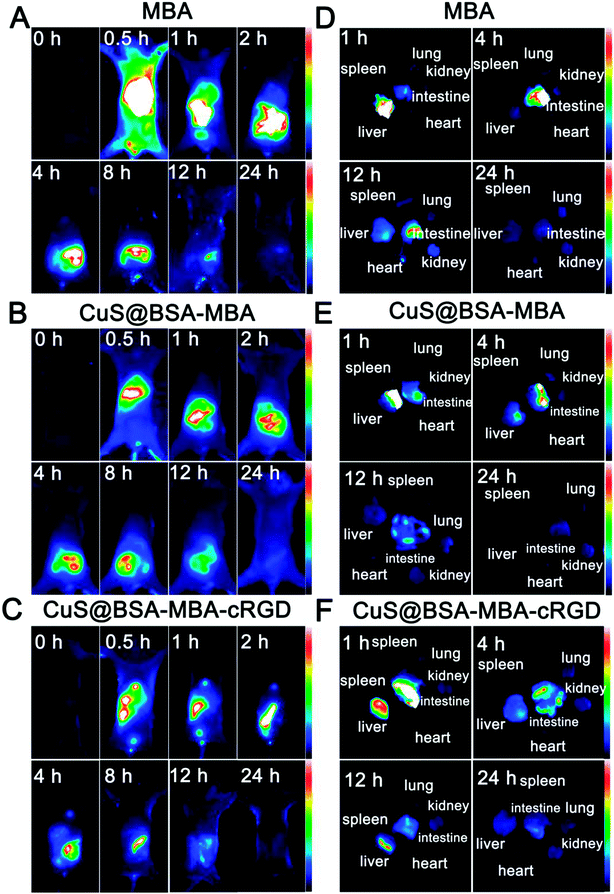
Fig. 9A–C displays the dynamic distribution of MBA, CuS@BSA-MBA and CuS@BSA-MBA-cRGD in normal mouse models at 0.5 h, 1 h, 2 h, 4 h, 8 h, 12 h and 24 h post-injection. Compared to the fluorescence signal of MBA appeared in the whole body of the normal mice at 0.5 h, the fluorescence only appeared in the mouse liver at 0.5 h after tail vein injection of CuS@BSA-MBA and CuS@BSA-MBA-cRGD, which demonstrated that the nanocomposites gradually appeared at the intestinal site of the mice and disappeared after 24 h, which is completely different from the dynamic distribution of MBA. The results also suggested that CuS@BSA-MBA-cRGD excreted from the mice through the liver-intestinal metabolism pathway.25In order to confirm the in vivo result of the nanocomposites, the mice were dissected and the main organs (heart, liver, spleen, lung, kidney and intestine) were collected and imaged at 1 h, 4 h, 12 h and 24 h (Fig. 9D–F). The results are consistent with the vivo imaging. The fluorescence signal of CuS@BSA-MBA and CuS@BSA-MBA-cRGD first appeared in liver and then transferred to intestine, and finally disappeared after 24 h. It is concluded that the dynamic distribution of CuS@BSA-MBA and CuS@BSA-MBA-cRGD in normal mice is liver-intestinal metabolism pathway.
3.5 Tumor-targeting ability of CuS@BSA-MBA-cRGD in vivo
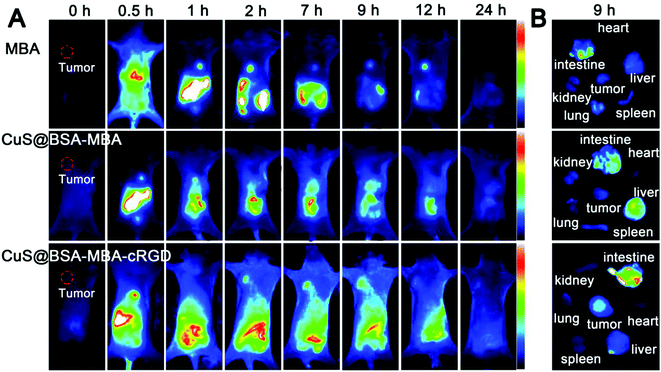
EAC tumor-bearing mice were used to evaluate the tumor specificity of MBA, CuS@BSA-MBA and CuS@BSA-MBA-cRGD. As shown in Fig. 10A, the fluorescence signal of MBA and CuS@BSA-MBA appeared in the whole body of the tumor-bearing mice after 0.5 h injection. However, MBA and CuS@BSA-MBA did not reach tumor sites efficiently because no visible fluorescence signal was shown in these two groups. For CuS@BSA-MBA-cRGD group, the fluorescence signal initially spread over the liver and intestine of tumor-bearing mice body at 0.5 h post-injection. At 2 h post-injection of CuS@BSA-MBA-cRGD, it displayed weak fluorescence in tumor, and the fluorescence signal reached peak intensity at 9 h and totally disappeared at 24 h post-injection (Fig. 10A). The in vitro fluorescence images of the main organs from MBA, CuS@BSA-MBA and CuS@BSA-MBA-cRGD at 8 h post-injection are shown in Fig. 10B, and the results are consistent with the in vivo imaging. Obviously, this result proved that CuS@BSA-MBA-cRGD has the active tumor-targeting capability due to the acceptor-ligand affinity, which is attributed to the potential of cRGD ligands on the NPS to induce integrin-mediated active transport specifically. Overall, it is reasonable to conclude that the cRGD can enter the tumor sites via active transport-mediated pathways.3.6 Infrared thermal imaging
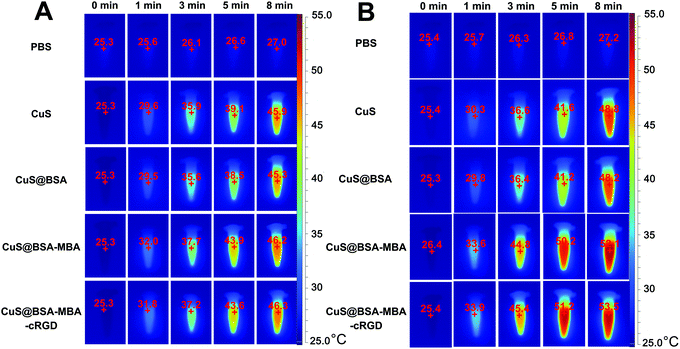
The infrared thermal images of PBS, CuS NPs, CuS@BSA, CuS@BSA-MBA and CuS@BSA-MBA-cRGD aqueous solution after 808 nm laser light irradiation for different times (0, 1, 3, 5 and 8 min) or different concentrations (200 and 750 μg mL−1) are shown in Fig. 11. After 1 min of irradiation, the temperatures of all the solutions were still below 40 °C. In comparison, a more significant temperature increase was noticed for the CuS@BSA-MBA and CuS@BSA-MBA-cRGD solutions irradiated for more than 3 min, reaching temperatures of 37–54 °C throughout the irradiation period. After 5 min of irradiation, CuS@BSA-MBA (750 μg mL−1) and CuS@BSA-MBA-cRGD (750 μg mL−1) solutions reached a temperature higher than 50 °C, and the solutions' temperature was maintained around this temperature even they were irradiated up to 8 min.As shown in Fig. 12, the region of normal mice injected with the CuS@BSA-MBA and CuS@BSA-MBA-cRGD showed an obvious yellow color, and these regions enlarged with a strong red color (45.6 °C) while the irradiation time was extended from 1 min to 8 min, while the region injected with PBS still showed blue color after irradiation with the NIR light for 8 min (Fig. 12A). Fig. 12B showed that the areas of intratumoral injection with CuS@BSA-MBA and CuS@BSA-MBA-cRGD were heated to 44.7 °C after 8 min of irradiation but there was no obvious temperature change in the tumor injected with PBS. The results indicated that the as-developed CuS@BSA-MBA-cRGD can be utilized as an efficient photothermal agent for tumor ablation as well as a promising infrared thermal imaging contrast agent for infrared thermal imaging.
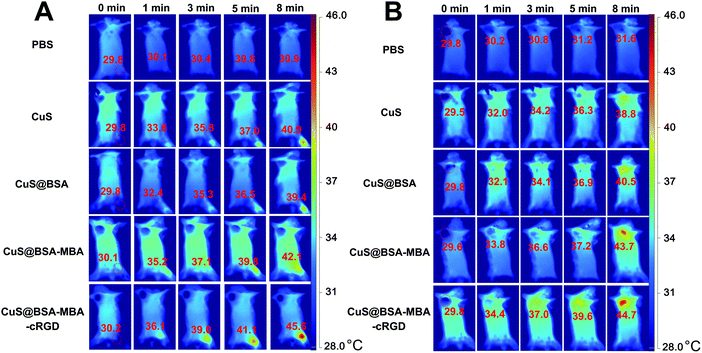 | ||
| Fig. 12 The infrared thermal images of (A) the normal mice and (B) EAC tumor-bearing mice injected with the PBS, CuS NPs, CuS@BSA, CuS@BSA-MBA and CuS@BSA-MBA-cRGD. | ||
3.7 Evaluation of tumor inhibition of CuS@BSA-MBA-cRGD in vivo
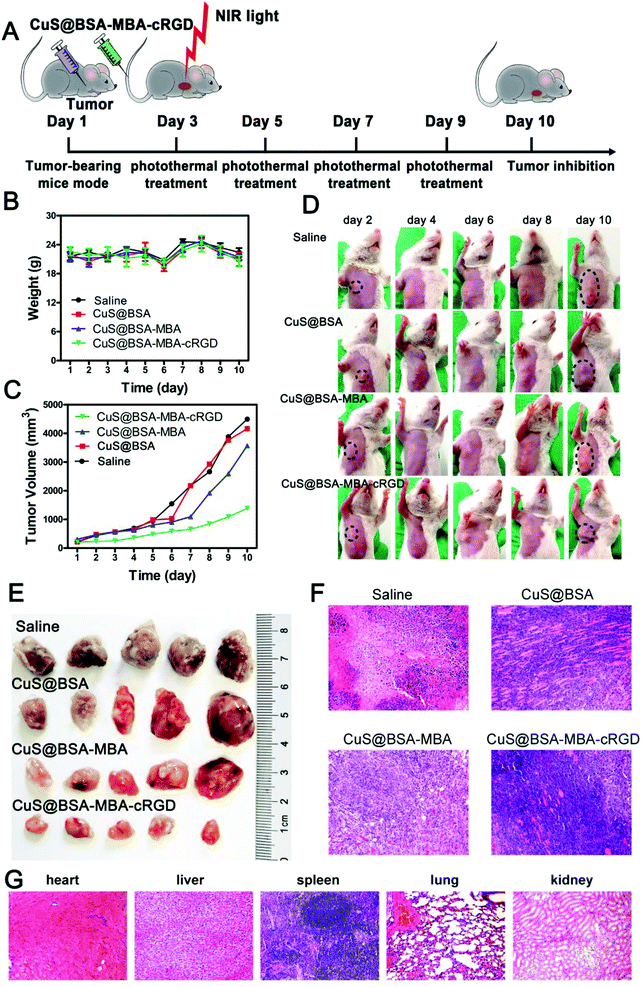
The experimental scheme to evaluate the anti-tumor effect of CuS@BSA-MBA-cRGD + NIR light in EAC tumor-bearing mouse models was shown in Fig. 13A. The weight and tumor volume of tumor-bearing mice were monitored every day, and the changes in body weight of tumor-bearing mice was displayed in Fig. 13B. No death were observed in the mice during the treatment. In addition, the tumor volume of saline group and CuS@BSA group showed an obvious increase after 6 days of treatment. The tumor growth of CuS@BSA-MBA + NIR light group was not as fast as that for saline group and the CuS@BSA group but significantly faster than CuS@BSA-MBA-cRGD + NIR light group (Fig. 13C). The tumor inhibition rate of CuS@BSA-MBA-cRGD + NIR light was 49.1%. All the results showed that the tumor inhibition effect of CuS@BSA-MBA-cRGD + NIR light was much better than CuS@BSA-MBA + NIR light (Fig. 13D and E). Furthermore, the tumor-inhibition effect and biotoxicity of CuS@BSA-MBA + NIR light and CuS@BSA-MBA-cRGD + NIR light on tumor-bearing mice were also assessed by histological analysis. As shown in Fig. 13F, the tumor cells loosely arranged and appeared vacuoles with nuclear enlargement, nuclear deformity, nuclear and cytoplasmic abnormalities after treatment of CuS@BSA-MBA-cRGD + NIR light. As shown in Fig. 13G, there are no obvious pathological changes for different organs (heart, liver, lung and kidney) except an unobvious damage of spleen for CuS@BSA-MBA-cRGD + NIR light group. It is concluded that CuS@BSA-MBA-cRGD irradiated by NIR light has an effective tumor inhibition and it is a promising candidate for targeting photo-thermal therapy.It is worth to note that MBA conjugated PTT agents (CuS@BSA-MBA) improve the tumor inhibition efficacy on the basis of increase of light absorbance efficiency, thus enhance the PTT effects. Furthermore, cRGD conjugated CuS@BSA-MBA (CuS@BSA-MBA-cRGD) further improve the tumor therapy efficacy due to the synergistic effects of tumor-targeting delivery and favorable PTT effects.
4. Conclusion
In summary, a diagnostic and tumor-targeting nanocomposite (CuS@BSA-MBA-cRGD) with photothermal effect was successfully designed and synthesized. Through the use of MBA and cRGD, we can directly observe the tumor-bearing mouse model of CuS@BSA-MBA-cRGD biodistribution, and locate the tumor site accurately. The tumor cells displayed prominent morphological changes and apoptosis after CuS@BSA-MBA-cRGD treatment. Furthermore, intensify tumor treatment effect of CuS@BSA-MBA-cRGD was also demonstrated in the tumor-bearing mouse model. This present study provides a good platform for diagnosis and treatment, and it is expected to prompt further exploration of the active target efficiency to achieve better tumor treatment.Conflicts of interest
There are no conflicts to declare.Acknowledgements
The authors are grateful to the Natural Science Foundation Committee of China (NSFC 81671803), a project supported by the National Key Research and Development Program (Grant No. 2017YFC0107700), the Outstanding Youth Foundation of Jiangsu Province (GX20171114003) and funded by the Priority Academic Program Development of Jiangsu Higher Education Institutions for their financial support.Notes and references
- B. Pang, Y. Zhao and H. Luehmann, et al., (64) Cu-Doped PdCu@Au Tripods: A Multifunctional Nanomaterial for Positron Emission Tomography and Image-Guided Photothermal Cancer Treatment, ACS Nano, 2016, 10(3), 3121–3131 CrossRef CAS PubMed.
- M. R. KAli, I. M. Ibrahim and H. R. Ali, et al., Treatment of natural mammary gland tumors in canines and felines using gold nanorods-assisted plasmonic photothermal therapy to induce tumor apoptosis, Int. J. Nanomed., 2016, 11, 4849–4863 CrossRef PubMed.
- R. Vankayala, C. C. Lin and P. Kalluru, et al., Gold nanoshells-mediated bimodal photodynamic and photothermal cancer treatment using ultra-low doses of near infra-red light, Biomaterials, 2014, 35(21), 5527 CrossRef CAS PubMed.
- C. Yan, Q. Tian and S. Yang, Recent advances in the rational design of copper chalcogenide to enhance the photothermal conversion efficiency for the photothermal ablation of cancer cells, RSC Adv., 2017, 7(60), 37887–37897 RSC.
- Z. Zha, S. Zhang and Z. Deng, et al., Enzyme-responsive copper sulphide nanoparticles for combined photoacoustic imaging, tumor-selective chemotherapy and photothermal therapy, Chem. Commun., 2013, 49(33), 3455–3457 RSC.
- K. Wang, Y. Zhang and J. Wang, et al., Self-assembled IR780-loaded transferrin nanoparticles as an imaging, targeting and PDT/PTT agent for cancer therapy, Sci. Rep., 2016, 6, 27421 CrossRef PubMed.
- G. Gollavelli and Y. C. Ling, Magnetic and fluorescent graphene for dual modal imaging and single light induced photothermal and photodynamic therapy of cancer cells, Biomaterials, 2014, 35(15), 4499–4507 CrossRef CAS PubMed.
- Z. Meng, F. Wei and R. Wang, et al., NIR-Laser-Switched in vivo Smart Nanocapsules for Synergic Photothermal and Chemotherapy of Tumors, Adv. Mater., 2016, 28(2), 245 CrossRef CAS PubMed.
- Z. Meng, F. Wei and W. Ma, et al., Design and Synthesis of “All-in-One” Multifunctional FeS2 Nanoparticles for Magnetic Resonance and Near-Infrared Imaging Guided Photothermal Therapy of Tumors, Adv. Funct. Mater., 2016, 26(45), 8231 CrossRef CAS.
- S. Goel, F. Chen and W. Cai, Synthesis and biomedical applications of copper sulfide nanoparticles: from sensors to theranostics, Small, 2014, 10(4), 631–645 CrossRef CAS PubMed.
- P. Møller, D. V. Christophersen and N. R. Jacobsen, et al., Atherosclerosis and vasomotor dysfunction in arteries of animals after exposure to combustion-derived particulate matter or nanomaterials, Crit. Rev. Toxicol., 2016, 46(5), 1 CrossRef PubMed.
- H. Maeda, The link between infection and cancer: tumor vasculature, free radicals, and drug delivery to tumors via the EPR effect, Cancer Sci., 2013, 104(7), 779–789 CrossRef CAS PubMed.
- Q. Zhao, X. Yi and M. Li, et al., High near-infrared absorbing Cu5FeS4 nanoparticles for dual-modal imaging and photothermal therapy, Nanoscale, 2016, 8(27), 13368 RSC.
- N. Yu, Y. Hu and X. Wang, et al., Dynamically tuning near-infrared-induced photothermal performances of TiO2 nanocrystals by Nb doping for imaging-guided photothermal therapy of tumors, Nanoscale, 2017, 9(26), 9148 RSC.
- J. Sun, R. Gui and H. Jin, et al., CuS nanocrystal@microgel nanocomposites for light-regulated release of dual-drugs and chemo-photothermal synergistic therapy in vitro, RSC Adv., 2016, 6(11), 8722–8728 RSC.
- X. Wang, Q. Zhang and L. Zou, et al., Facile-synthesized ultrasmall CuS nanocrystals as drug nanocarriers for highly effective chemo-photothermal combination therapy of cancer, RSC Adv., 2016, 6(25), 20949–20960 RSC.
- L. Hou, X. Shan and L. Hao, et al., Copper sulfide nanoparticle-based localized drug delivery system as an effective cancer synergistic treatment and theranostic platform, Acta Biomater., 2017, 54, 307 CrossRef CAS PubMed.
- Z. Wang, P. Huang and O. Jacobson, et al., Biomineralization-Inspired Synthesis of Copper Sulfide–Ferritin Nanocages as Cancer Theranostics, ACS Nano, 2016, 10(3), 3453–3460 CrossRef CAS PubMed.
- S. Peng, Y. He and M. Er, et al., Biocompatible CuS-based nanoplatforms for efficient photothermal therapy and chemotherapy in vivo, Biomater. Sci., 2017, 5(3), 475 RSC.
- Y. Miura, T. Takenaka and K. Toh, et al., Cyclic RGD-linked polymeric micelles for targeted delivery of platinum anticancer drugs to glioblastoma through the blood-brain tumor barrier, ACS Nano, 2013, 7(10), 8583 CrossRef CAS PubMed.
- Y. Li, W. Lu and Q. Huang, et al., Copper sulfide nanoparticles for photothermal ablation of tumor cells, Nanomedicine, 2010, 5(8), 1161 CrossRef CAS PubMed.
- L. Wang, ChemInform Abstract: Synthetic Methods of CuS Nanoparticles and Their Applications for Imaging and Cancer Therapy, RSC Adv., 2016, 6, 82596–82615 RSC.
- C. Dan, B. Li and S. Cai, et al., Dual targeting luminescent gold nanoclusters for tumor imaging and deep tissue therapy, Biomaterials, 2016, 100, 1 CrossRef PubMed.
- F. Chen, H. Hong and S. Goel, et al., In vivo Tumor Vasculature Targeting of CuS@MSN Based Theranostic Nanomedicine, ACS Nano, 2015, 9(4), 3926–3934 CrossRef CAS PubMed.
- O. A. Almazroo, M. K. Miah and R. Venkataramanan, Drug Metabolism in the Liver, Clinics in Liver Disease, 2016, 21(1), 1–20 CrossRef PubMed.
Footnote |
| † Li Liang and Shuwen Peng contributed equally to this work. |
| This journal is © The Royal Society of Chemistry 2018 |

