 Open Access Article
Surfactant-assisted hydrothermal synthesis of rGO/SnIn4S8 nanosheets and their application in complete removal of Cr(VI)†
Pingfan Xua,
Siyi Huangb,
Yuancai Lvb,
Yi Chenac,
Minghua Liu *b and
Haojun Fan
 *ac
*ac
aNational Engineering Laboratory for Clean Technology of Leather Manufacture, Sichuan University, Chengdu 610065, China. E-mail: fanhaojun@scu.edu.cn
bCollege of Environment & Resource, Fuzhou University, Fuzhou 350116, P. R. China. E-mail: mhliu2000@fzu.edu.cn
cLight Industry, Textile and Food Institution, Sichuan University, Chengdu 610065, China
First published on 2nd February 2018
Abstract
To solve the problem of contamination of hexavalent chromium (Cr(VI)), visible-light-driven graphene-based ternary metal chalcogenide nanosheets (rGO/SnIn4S8) were synthesized via a one-pot surfactant-assisted hydrothermal method for the photoreduction of Cr(VI). Characterizations demonstrated that SnIn4S8 nanosheets were uniformly distributed on the surface of rGO and the as-synthesized nanosheets exhibited excellent photocatalytic activity under visible light. In addition, the effects of pH, concentration of critic acid, holes and electron scavengers on the reduction of Cr(VI) were systematically investigated. It was found that 50 mg L−1 of Cr(VI) could be completely removed within 30 min at pH 2 when citric acid served as a hole scavenger. Kinetic studies showed that the photocatalytic reduction of Cr(VI) processes obeyed the pseudo first order model. Further study indicated that the Cr(III) species was immediately adsorbed onto the surface of the rGO/SnIn4S8 nanosheets after photocatalytic reduction of Cr(VI). Additionally, recycling results suggested that rGO/SnIn4S8 nanosheets possessed high recycle ability and stability after repeated use (5 times). This effective and promising work might provide a new strategy for the photoreduction of Cr(VI) and complete removal of chromium from effluent through the novel photocatalyst rGO/SnIn4S8.
1 Introduction
Chromium is a common chemical element in the earth's crust which has been widely used in various industries, e.g. leather tanning, electroplating, textile dye manufacturing and wood preservation.1–3 Over the past decades, considerable quantities of effluent containing chromium have been discharged into the aqueous environment, which caused serious environmental problems and harmful effects to human beings. Hence, concern over chromium contamination of the environment and the requirement for the safe disposal of chromium waste is a hot topic of current interest.4Chromium exists in several forms but predominantly is present as two stable oxidation states in water: trivalent chromium (Cr(III)), which is an essential nutrient for glucose and protein metabolism, and hexavalent chromium (Cr(VI)), which is artificially produced for use in industrial processes and rarely found in nature.5 Cr(III) forms yield relative insolubility at pH ≥ 4 with no-toxicity and won't cross the cell membranes. On the contrary, Cr(VI) shows high water-solubility and environmental mobility, thus it has high permeability in cell membranes and presents acute toxicity, teratogenicity and carcinogenicity.6,7 Therefore, the reduction of Cr(VI) originated from effluent into Cr(III) is extremely necessary for natural environment.
The most widely used treatment process for the removal of Cr(VI) is the chemical reduction followed by precipitation, whereas this process consumes large amounts of reducing agent and generates large quantities of chromium containing sludge, which has been listed as hazardous wastes.8 Recent developed technologies for the remediation of Cr(VI) including microbial degradation, membrane process, ion exchange, absorptive method and electrochemical precipitation,9–13 nevertheless, those strategies either require huge investment, or consume large amounts of energy and chemical agent. Hence, it is urgent to seek out an effective and low-cost strategy for removing Cr(VI) without secondary pollution. Heterogeneous photocatalysis has been recognized as a promising for chromium removal due to its high efficiency, low energy consumption and mild reaction condition. However, the traditional photocatalyst such as TiO2, ZnO and SnO2, usually have wide band gap energy and fail to be irradiated under visible light.14,15 Moreover, those power photocatalysts usually have a limitation of surface area which results in a low adsorption of metal ion on the surface of photocatalysts.16 Therefore, it is essential to develop a high specific surface area, visible-light responsive photocatalyst for removal of chromium.
Metal chalcogenides (MC), which possess narrow band gap and visible-light absorption, has received recent attention as a new two-dimensional (2D) layered nanomaterials.17 In the past few years, significant efforts have been devoted to binary metal chalcogenides, such as MoS2, CdS, SnS2 and WS2.18 In this family, most binary compounds have unfavorable band gap or band position, however, ternary metal chalcogenides show a high flexibility for tuning the band gap and energy levels.19 For instance, tin indium sulfide (SnIn4S8) as a novel ternary chalcogenide semiconductor has exhibited potential application in photocatalytic reduction of heavy metal ion. But single SnIn4S8 semiconductor owns a small specific surface area and fast electron–hole recombination,20 which result in the decrease of photocatalytic activity. Graphene with one-atom-thick layer and two-dimensional nano scale of sp2-bonded carbon structure, taking advantage of higher surface activity and specific surface area per unit volume, has been applied to combine with semiconductor photocatalysts such as TiO2, Fe3O4, Gd(OH)3, CdS and CuInS2.21–23 In those hybrid systems, the graphene serves as both the supported carrier of photocatalyst and the adsorption active site, which extremely promotes the photocatalytic activity of the graphene–semiconduct hybrid. Among the graphene analogues, rGO has been widely utilized due to its facile synthesis and easy modification.24 Despite being chemically or hydrothermally reduced, the rGO sheets still have some oxygen functional groups such as hydroxyl and carboxyl groups, which could capture the heavy metal ion.25,26 Thus, it provides a new strategy for simultaneous photocatalysis of Cr(VI) and adsorption of Cr(III). Previous studies have demonstrated that graphene-based material could greatly improve photocatalytic efficiency of Cr(VI) to Cr(III) because of the synergy of graphene with semiconduct hybrid.27,28 In this regard, a few reports on the photocatalytic reduction of Cr(VI) over graphene-based material such as α-FeOOH nanorod/RGO, α-MnO2@RGO, SnS2/RGO have already been reported.29–31 To the best of our knowledge, few groups have reported the concurrence of photocatalysis of Cr(VI) and adsorption of Cr(III) by the graphene-based material.
Following this idea, herein, an attempt was carried out to construct the layer ternary metal chalcogenide coupling with reduced graphene oxide (rGO) using a facile surfactant-hydrothermal synthesis (see Scheme 1) to further enhance the photocatalytic activity of metal chalcogenides photocatalyst. In this case, rGO could act as both the enhancement of adsorption capacity and the photocatalysis activity, while MC in the hybrids could serve as active sites for photocatalytic reaction, as a result, the as-fabricated rGO/SnIn4S8 nanosheets exhibited significant improvement on the photocatalytic activity for the reduction of Cr(VI) to Cr(III) under visible light irradiation. Simultaneously, a more profound study was provided to explain the promoted and inhibited reduction mechanism for photocatalysis of Cr(VI) based on the complexity of wastewater. Several influence factors, such as pH, concentration of citric acid, the species of hole scavenger and electron scavenger, were investigated to reveal the mechanism and optimize condition for photocatalytic reduction of Cr(VI). In addition, the simultaneous adsorption of Cr(III) on the surface of rGO/SnIn4S8 was confirmed to interpret the synergetic mechanism of photocatalysis and adsorption of rGO/SnIn4S8. Finally, the stability and reusability of photocatalyst of the as-fabricated nanosheets were investigated.
2 Experimental
2.1 Materials
Tin(IV) chloride pentahydrate (SnCl4·5H2O), indium(III) chloride tetrahydrate (InCl3·4H2O) and thioacetamide (TAA) were obtained from Aladdin Ltd, China. Natural graphite flakes with an average particle size of 100 meshes, potassium dichromate, phosphorus pentoxide and sodium dodecylbenzene sulfonate (SDBS) were purchased from Sinopharm Chemical Reagent co. Ltd, China. All the reagents were of analytical grade and used as received without further purification.2.2 Preparation of graphene oxide
Graphene oxide (GO) was synthesized by the modified Hummers' method.32 Briefly, natural graphite flakes (10.0 g) was preoxidized in a mixture of concentrated H2SO4 (50 ml), K2S2O8 (10.0 g) and P2O5 (10.0 g) stirring at 80 °C for 4.5 h in a water bath. The pre-oxidized graphite was washed with excess deionized water via repeated filtration until the filtrate water become neutral, and then dried in a vacuum oven. The pre-oxidized graphite (2.0 g) was dispersed in concentrated H2SO4 (92 ml) in an ice bath, then KMnO4 (12.0 g) was gradually added to keep the bath temperature below 10 °C. The mixture was transferred to 35 °C bath for 2 h and was cooled down in ice bath, then 184 ml deionized water was added dropwisely to prevent the temperature rising sharply. Subsequently, the reaction was heated at 75 °C for 4 h, then the black product was reacted with H2O2 until the suspension turn bright yellow. Finally, the product was washed with 5% HCl and deionized water, then freeze-dried for further used.2.3 Synthesis of rGO/SnIn4S8
rGO/SnIn4S8 was synthesized using a one-pot surfactant-assisted hydrothermal method. In a typical synthesis procedure, 10 mg GO, 0.6 mmol SnCl4·5H2O (dissolved in 2 ml acetic acid), 2.4 mmol InCl3·4H2O and 0.021 mmol SDBS were dissolved in 70 ml deionized water and the mixture was sonicated at room temperature for 10 min, and then vigorously stirred for 30 min to ensure homogeneous dispersion. Finally, 4.8 mmol TAA was added to the reaction system and kept stirring for 10 min. The solution was introduced into a 100 ml Teflon-lined stainless steel autoclave and maintained at 180 °C for 12 h. After cooling down to room temperature, the product was collected by filtration, and washed repeatedly by deionized water and anhydrous ethanol, finally freeze-dried to obtain the rGO/SnIn4S8 nanosheets. Pure rGO and SnIn4S8 were also prepared under the same experimental condition.2.4 Characterization
The morphology of the samples were visualized using a field emission scanning electron microscopy (FESEM, Nova Nano SEM450, FEI, America, operated at 20 kV) and a high resolution transmission electronic micrograph (HRTEM, Tecnai G220, FEI, America, operated at 200 kV). The crystalline phase of the samples were analyzed by a powder X-ray diffractometer (XRD) (Miniflex600, Rigaku, Japan) at 40 kV and 15 mA with Ni-filtered Cu Kα irradiation (λ = 1.5406 Å). The surface composition and chemical state of the photocatalyst were measured by X-ray photoelectron spectroscopy (XPS, ESCA Lab250, Thermo Scientific Ltd, America) with Al Kα radiation in twin anode, where the binding energies were calibrated by referencing C 1s (284.6 eV) peak. The UV-Vis diffuse reflectance spectra (DRS) were recorded on a UV-Vis spectrophotometer (UV-2450, Shimadzu, Japan) using BaSO4 as reference. Brunauer–Emmett–Teller (BET) specific surface area was investigated by ultrapure nitrogen adsorption/desorption experiments at the boiling temperature of liquid nitrogen (77 K) on an ASAP 2020 Accelerated Specific Surface Area and Porosimetry Analyzer. Prior to BET measure, the sample was degassed under vacuum condition at 120 °C for 8 h. Cr(VI) was determined using the diphenylcarbazide (DPZ) method at 540 nm on a continuous flow analyzer (SEAL Analytical, Germany). Total chromium was measured using an inductively coupled plasma optical emission spectrometer (ICP-OES, Optima 8000, PerkinElmer, America). Fourier-transform infrared spectra (FT-IR) were recorded with a Thermo Scientific Nicolet iS10 using KBr pellets technique over the wavenumber ranging from 4000 to 400 cm−1.2.5 Photocatalysis and adsorption experiment
All photocatalytic runs were carried out in a double-walled quartz jacket filled with cool water under visible light irradiation. A 300 W xenon lamp (Beijing Aulight Ltd, China) coupled with a cutoff filter (λ > 420 nm) was used as the irradiation source. Photocatalytic activity of the sample was evaluated through the experiment of photocatalytic reduction of Cr(VI) under visible light irradiation. In a typical procedure, 10 mg of catalyst was dispersed in 50 ml of Cr(VI) solution, the initial concentration (C0) of which was 50 mg L−1. Subsequently, the suspension was magnetically stirred in the dark for 30 min to ensure the adsorption–desorption equilibrium between reactants and photocatalysts. Then, the above suspension was irradiated by Xe lamp (10 cm away from the photocatalytic reactor), during this period, 3 ml of suspension was sampled at a specific time intervals and then centrifuged to remove the catalysts. The concentration of Cr(VI) was determined on a continuous flow analyzer. Consequently, the photocatalytic efficiency of Cr(VI) can be calculated according to C/C0, where C0 is the concentration of after adsorption equilibrium and C is the concentration of Cr(VI) after reaction.The synergy of photocatalysis and adsorption experiment was divided into two parts. Firstly, the photocatalytic reduction was performed as mentioned above. Secondly, the system was transferred to a thermostatic reciprocating shaker at 200 rpm in 30 °C. The residual total concentrations of chromium and Cr(VI) was measured by ICP-OES and continuous flow analyzer. Then Cr(III) concentration in the liquid could be calculated from the concentration difference between total chromium and Cr(VI). The adsorption capacity (qt, mg g−1) could be calculated from the following equation:
 | (1) |
2.6 Recycling experiment
To evaluate the stability of the photocatalyst, the used photocatalyst was regenerated by filtration after the photocatalytic reaction and washed with deionized water and diluted HCl (10%, v/v) for 3–4 times until complete removal of chromium from photocatalyst, and then the photocatalyst was dried at 80 °C for the next run of photoreaction under the same conditions.3 Results and discussion
3.1 Crystal and morphological characterization
XRD analysis was carried out to investigate the purity and crystallinity of the SnIn4S8 sample. As shown in Fig. 1a, the diffraction pattern of rGO/SnIn4S8 exhibited 13 peaks at 14.3°, 23.4°, 27.5°, 28.8°, 33.3°, 41.1°, 43.7°, 47.8°, 50.2°, 56.0°, 59.5°, 66.8° and 69.9°, corresponding to (111), (220), (311), (222), (400), (422), (333), (440), (531), (533), (444), (553) and (880) of crystal plane of pristine SnIn4S8, respectively. In addition, a small peak in rGO/SnIn4S8 appeared at 26°, which belonged to the (100) plane diffraction peak of rGO. All the reflections in the diffraction patterns of as-synthesized rGO/SnIn4S8 were well indexed with pure cubic phase of SnIn4S8 (JCPDS card #42-1305, a = b = c = 10.751 Å). The TEM image of rGO/SnIn4S8 in Fig. 1b and c clearly showed that SnIn4S8 aggregated on the surface of rGO sheet and the spacing distance of lattice fringe was well-matched the crystal plane of (222), (311), (400) of pristine SnIn4S8. The high diffraction intensity and clear lattice fringer of rGO/SnIn4S8 indicated that the SnIn4S8 was well crystallized on the rGO surface via the surfactant-assisted hydrothermal synthesis.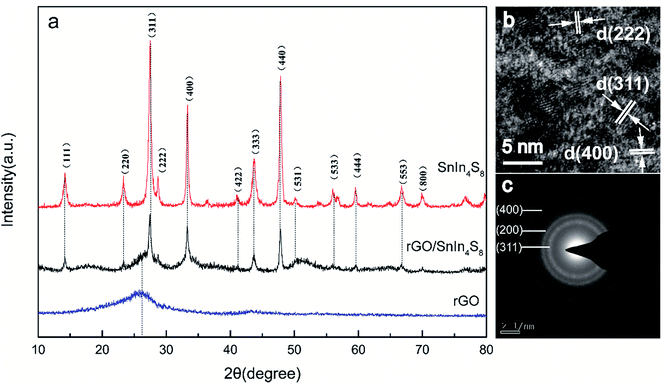 | ||
| Fig. 1 (a) XRD pattern of pure SnIn4S8, rGO and rGO/SnIn4S8; (b) high resolution TEM images of the lattice fringer and (c) electron diffraction pattern of rGO/SnIn4S8. | ||
The morphology of rGO, pure SnIn4S8 and rGO/SnIn4S8 were illustrated in Fig. 2. Obviously, SEM image of rGO sheets exhibited a wrinkle ultrathin nanosheet structure with a relative smooth surface. On the contrary, pure SnIn4S8 nanosheet displayed a rough surface, aggregating disorderly to form a formicary-like superstructure. In the case of rGO/SnIn4S8, SnIn4S8 nanosheets were uniformly distributed on the surface of rGO to form a wrinkled-like nanosheet.
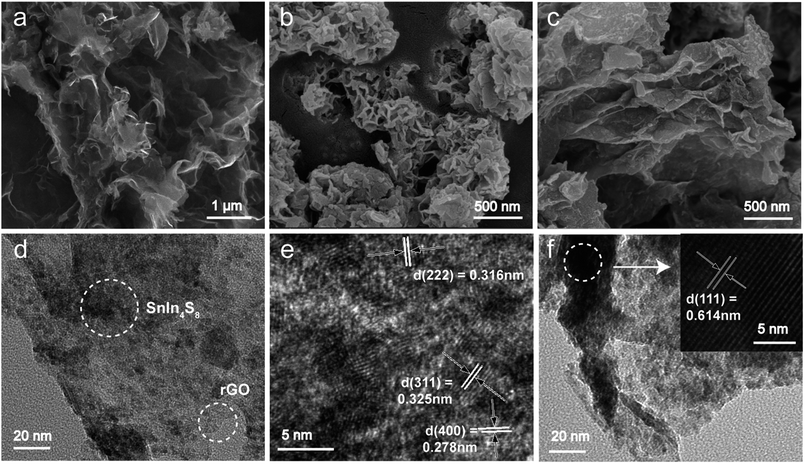 | ||
| Fig. 2 SEM image of (a) rGO, (b) SnIn4S8 and (c) rGO/SnIn4S8; (d) TEM image of rGO/SnIn4S8; (e and f) HRTEM image of the lattice fringes of SnIn4S8 on the surface of rGO. | ||
A typical transmission electron microscopy (TEM) and high resolution TEM (HRTEM) images of the as-synthesized rGO/SnIn4S8 were characterized to further reveal the morphology and crystal structure. As shown in Fig. 2d and f, SnIn4S8 nanosheets were paved on the surface of rGO. Further crystallographic orientations of SnIn4S8 were confirmed from HRTEM analysis by studying the lattice plane stacked on the surface of rGO. Distinctive sets of lattice fringes were lying on flat on the surface of rGO which corresponded to the lattice planes of (222), (311), (400) and (111) of the SnIn4S8, respectively. TEM and HRTEM images further demonstrated that the as-prepared SnIn4S8 with well crystallinity was stacked on the surface of rGO to form a nanocomposite heterojunction.
Herein, rGO provided both the supported carrier of SnIn4S8 and promoted the separation of photogenerated electron–holes pair in heterojunction.33,34 Moreover, rGO played a role in the aggregation of crystallites because the surface functional group could serve as a matrix or ligand for various anion.35 In this case, it is evidenced that the SnIn4S8 particle is apt to nucleate on the surface of rGO and aggregated in crystalline along rGO sheets.
3.2 XPS surface element analysis
The chemical states of C, S, In and Sn element were characterized by X-ray photoelectron spectroscopy (XPS). As expected, the characteristic peak of C 1s, S 2p, In 3d and Sn 3d were confirmed according the XPS survey scan. As shown in Fig. 3b, the C 1s core-level spectrum of rGO/SnIn4S8 nanosheets was fitted into three main characteristic peaks with binding energies at 284.8, 286.0 and 289.4 eV corresponding to the sp2 C–C bonds, sp3 C–O bonds and sp2 C![[double bond, length as m-dash]](https://www.rsc.org/images/entities/char_e001.gif) O bonds, respectively. Fig. 3d displayed the S 2p core-level spectrum with two peaks, which were respectively assigned to In–S and Sn–S bond. The In 3d spectrum exhibited two intense peaks at 445.2 and 452.8 eV corresponding respectively to 3d5/2 and 3d3/2, resulting from the spin–orbit splitting. The peak area ratio and the spin orbital splitting of In 3d5/2 and In 3d3/2 were 1.47 and 7.6 eV, which confirmed the In3+ oxidation state of the In element in the sample. At the same time, the peak area ratios and the spin orbital splitting of Sn 3d5/2 and Sn 3d3/2 were 1.47 and 8.4 eV, which was the characteristic peak of Sn4+.
O bonds, respectively. Fig. 3d displayed the S 2p core-level spectrum with two peaks, which were respectively assigned to In–S and Sn–S bond. The In 3d spectrum exhibited two intense peaks at 445.2 and 452.8 eV corresponding respectively to 3d5/2 and 3d3/2, resulting from the spin–orbit splitting. The peak area ratio and the spin orbital splitting of In 3d5/2 and In 3d3/2 were 1.47 and 7.6 eV, which confirmed the In3+ oxidation state of the In element in the sample. At the same time, the peak area ratios and the spin orbital splitting of Sn 3d5/2 and Sn 3d3/2 were 1.47 and 8.4 eV, which was the characteristic peak of Sn4+.
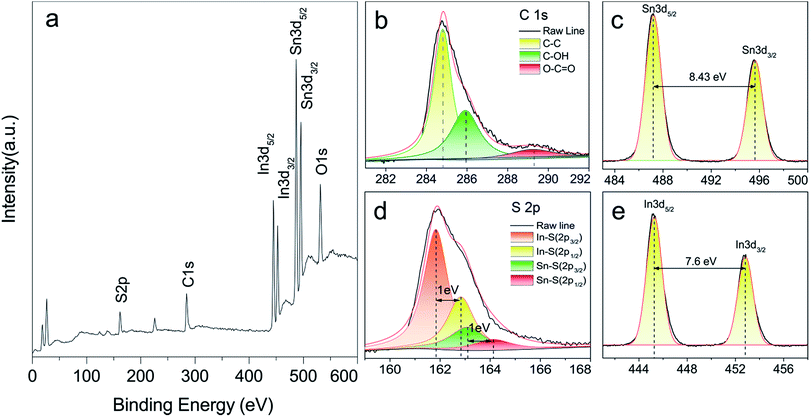 | ||
| Fig. 3 XPS spectra of rGO/SnIn4S8. (a) Survey scan of rGO/SnIn4S8; (b) C 1s core-level spectrum; (c) S 2p core-level spectrum; (d) In 3d core-level spectrum; (e) Sn 3d core-level spectrum. | ||
3.3 Surface area of photocatalyst
Generally, photocatalytic activity of photocatalyst is strongly dependent on the surface area. Large surface area is likely to exhibit excellent photocatalytic activity, because a large surface area provides more active sites for adsorbing pollutant.36 The Brunauer–Emmett–Teller (BET) analysis was carried out to determine the surface area of rGO, SnIn4S8 and rGO/SnIn4S8. As shown in the ESI (Fig. S1, ESI†), special surface areas followed an order of rGO (212.8 m2 g−1) > rGO/SnIn4S8 (109.0 m2 g−1) > SnIn4S8 (64.8 m2 g−1), which revealed that the special surface areas of SnIn4S8 increased after supported by rGO. According to IUPAC classification of 1985, the physisorption isotherms of rGO/SnIn4S8 is assigned to the reversible type IV isotherms with a H3 hysteresis loops, which clearly evidenced the nanosheets consisted of non-rigid aggregates of plate-like particles and the pore network was not completely filled with pore condensate.373.4 Optical properties and photocatalytic processes
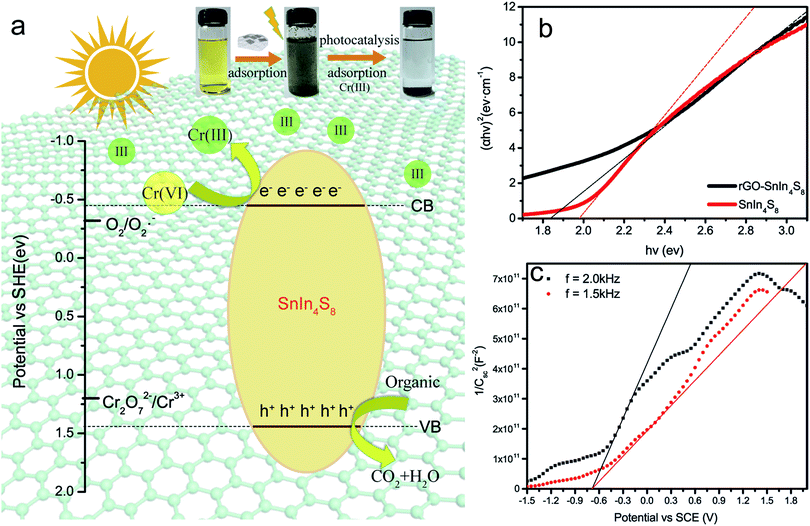
The optical properties of rGO/SnIn4S8 and SnIn4S8 were characterized by UV-Vis diffuse reflectance spectra and flat-band potential. A classical Tauc approach was employed to estimate the optical band gap energy (Eg) of the rGO/SnIn4S8 and SnIn4S8 according to the following empirical equation:38| (αhv)n ∝ (hv − Eg) | (2) |
To further investigate the conduction band edges of rGO/SnIn4S8, the flat-band potential was measured using the electrochemical method and depicted by Mott–Schottky plot. The data of CSC − V were used for evaluating the flat band potential by Mott–Schottky equation:
 | (3) |
Based on the measured values of flat band potential and band gap, the conduction and valence band edges of rGO/SnIn4S8 were calculated to be −0.459 eV and 1.391 eV (vs. SHE), respectively, which revealed that Cr(VI) can be photocatalytic reduced under visible light. As shown in Fig. 4a, the electrons excited from the valence band (VB) of SnIn4S8 to the respective conduction band (CB), remaining the hole in the VB. Meanwhile, the electrons can move along the rGO surface without quenching because rGO can promote the separation of the photogenerated electron–holes pair through interfacial charge transfer.
The photocatalytic reduction of Cr(VI) can be described via a photocatalytic process with a simplified mechanism as follows.
| SnIn4S8 + hv → h+ + e− | (4) |
| Cr2O72− + 14H+ + 6e− → 2Cr3+ + 7H2O | (5) |
| O2 + e− → ˙O2− | (6) |
| ˙O2− + organic → ⋯ → CO2 + H2O | (7) |
| h+ + organic → ⋯ → CO2 + H2O | (8) |
3.5 Effect factors on the photocatalytic reduction of Cr(VI)
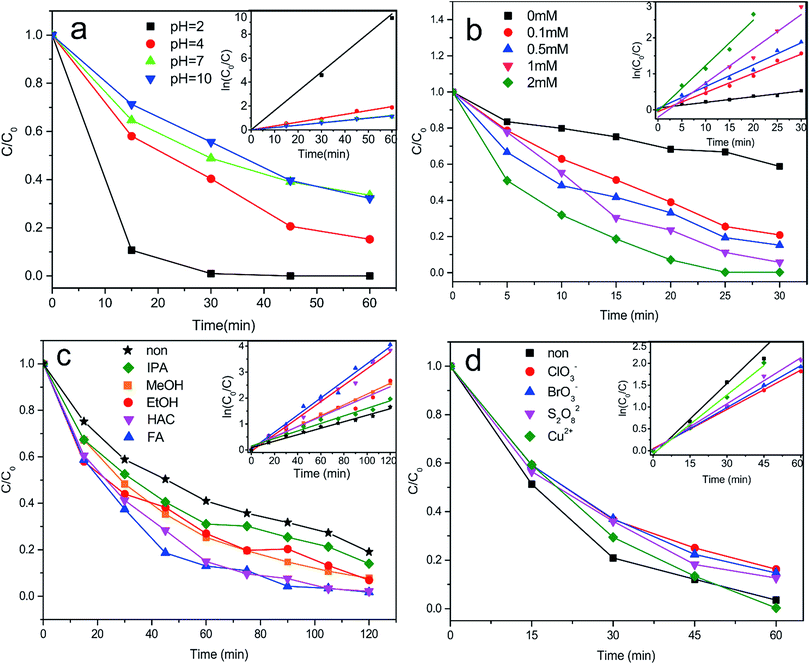
The explanation for promoting the reduction of Cr(VI) in presence of citric acid can be ascribed to two aspects: (a) the separation of photogenerated electron–holes pair on the surface of photocatalyst;47 (b) preventing the chromium species from oxidating by holes or hydroxyl radicals.42 In presence of citric acid, the photogenerated electron–holes pair are spatially in isolated state, and the citric acid on one hand, can capture the photogenerated holes, on the other hand, can combine with Cr(V) to form a stable complex, all contributing to the higher Cr(VI) reduction rate. The recycle reaction can be expressed simply as follows:
| Cr(VI) + e− → Cr(V) + e− → Cr(IV) + e− → Cr(III) | (9) |
| H2O + h+ → ˙OH + H+ | (10) |
| Cr(V)/Cr(IV)/Cr(III) + h+(˙OH) → Cr(VI)/Cr(V)/Cr(IV) + HO− | (11) |
The reaction in presence of citric acid is described as follows:
| Cit + h+ → Cit˙+ | (12) |
| Cr(V) + Cit → Cr(V) − Cit | (13) |
On the basis of these results, combined with previous reported literature,48 we suggest that the Cr(VI) reduction rate is affected by organic hole scavenger. In this study, FA was the best candidate due to the fact that FA was a carboxylic acid with larger ionized constant (pKa = 3.77) at pH 3, hence, it was apt to absorb on the positive surface of photocatalyst and would be more susceptible to direct oxidation by the photogenerated holes. Similar explanation can be made on the carboxylic acid of HAC which also had a relative large ionized constant (pKa = 4.76). With respect to MeOH (pKa = 15.54), EtOH (pKa = 15.9) and IPA (pKa = 16.5), the hole scavengers were difficult to ionize and absorb on the photocatalyst surface, resulting in the decrease of Cr(VI) reduction rate.49–51 Therefore, those organic acid with smaller ionized constant existed in wastewater are beneficial for the Cr(VI) reduction.
3.6 Synergy of photocatalysis of Cr(VI) and adsorption of Cr(III)
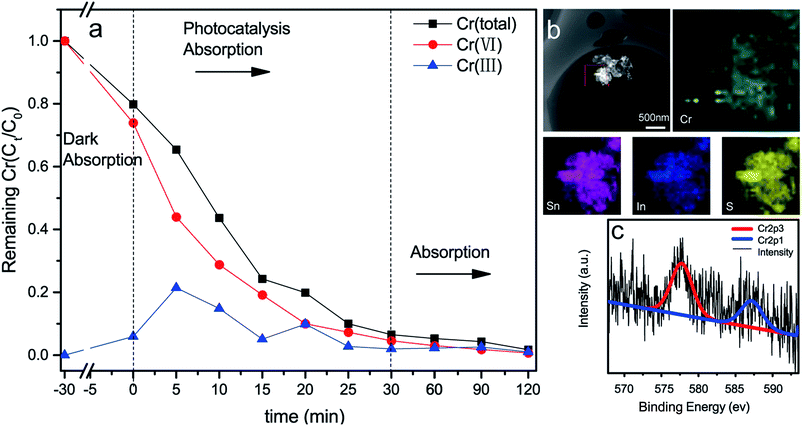
Previous studies reveal that GO is one of the most effective absorbents for Pb(II), Sb(III) and Cr(III) because of the abundance of O-containing functional groups on the surface of GO nanosheets.52,53 To investigate the adsorption activity of the rGO/SnIn4S8, the adsorption of Cr(III) was carried out following by the photocatalysis of Cr(VI). According to the aforementioned XPS results in Fig. 3, the rGO in the rGO/SnIn4S8 nanosheets still had some hydrophilic groups such as hydroxyl and carboxyl groups despite being hydrothermal reduced. As a result, the rGO could serve as an adsorbent. Experiments on photocatalytic reduction of Cr(VI) was firstly performed. As shown in Fig. 6a, total Cr concentration was decreased with the decreased of Cr(VI) concentration. The removal efficiency of Cr(VI) and total Cr could reach up to a high level of 99.2% and 98.3% within 30 min photocatalysis. It can be calculated that the maximum adsorption capacity of Cr(III) on rGO/SnIn4S8 surface was about 12.8 mg g−1 at pH 4.After adsorption, the used rGO/SnIn4S8 nanosheets were separated from the aqueous solution to further subject to EDS and XPS analysis. As illustrated in Fig. 6b, the element of Cr, Sn, In and S was distributed uniformly on the surface of the used nanosheets. Moreover, the chemical state of Cr was investigated by high resolution XPS spectrum and presented in Fig. 6c. Generally, Cr(III) yields two XPS signal with BE peaking at 577.0–578.0 eV and 586.0–588.0 eV, respectively, while the signals of Cr(VI) usually locates between 580.0–580.5 eV and 589.0–590.0 eV.54 According to the high resolution XPS spectrum of Cr on the surface of rGO/SnIn4S8 nanosheets, the Cr 2p spectrum exhibited two intense peaks located at 577.7 and 587.1 eV, corresponding to the splitting peak of Cr 2p3/2 and Cr 2p1/2, respectively. The spin orbital splitting of Cr 2p3/2 and Cr 2p1/2 was 9.4 eV, which was the characteristic peak of Cr(III).
In this system, the Cr(VI) on the surface of rGO/SnIn4S8 was completely photocatalytic reduction by photogenerated electron, and at the same time the Cr(III) was immediately captured by the rGO owing to the O-containing functional groups on the surface. As a result, chromium in the solution was ultimately transferred to the surface of photocatalyst. That is to say, the synergy of photocatalysis and adsorption played an important role in the complete removal of total chromium.
3.7 Recycling test
It is well known that the photochemically stability is very important for the application of photocatalyst. In this case, the recycling experiment was conducted under similar condition with the initial Cr(VI) concentration of 50 mg L−1 at pH 2. Results indicated that the Cr(VI) removal efficiency was up to 95.6% after five cycles, as shown in Fig. S2 (ESI†). Further, XRD analysis and FT-IR spectra before and after 5 times photocatalytic reaction were carried out to investigate the stability of rGo/SnIn4S8 (see Fig. S3 and S4, ESI†). Careful observation suggested the diffraction peak intensity of XRD pattern and FT-IR spectra of the sample after 5 times tests did not change significantly compared with that of the fresh one, indicating the high stability of rGO/SnIn4S8. Consequently, superior photocatalytic reduction efficiency was maintained after repeated use 5 times. Thus, this work might provide a possibility for treating chromium-containing effluent.4 Conclusions
In summary, 2D rGO/SnIn4S8 nanosheets were successfully prepared by a simple and economic one-pot surfactant-assisted hydrothermal approach. The as-synthesized nanosheets exhibited excellent photocatalytic ability under visible light, which could reduce Cr(VI) nearly 100% at pH 2 within 30 min in presence of citric acid and retained a relatively high reduction ability, recycle ability and stability after 5 cycles. Moreover, the maximum adsorption capacity of Cr(III) on rGO/SnIn4S8 surface at pH 4.0 was about 12.8 mg g−1, which provided a promising strategy to ultimately remove chromium from wastewater.Conflicts of interest
There are no conflicts to declare.Acknowledgements
The authors gratefully acknowledge the financial support from National Natural Science Foundation of China (grant numbers 21206096 and 21577018) and National Key Research and Development Program of China (2017YFB0308600).Notes and references
- M. Owlad, M. K. Aroua, W. A. W. Daud and S. Baroutian, Water, Air, Soil Pollut., 2009, 200, 59–77 CrossRef CAS.
- X. Guan, Y. Chen and H. Fan, ACS Appl. Mater. Interfaces, 2017, 9, 15525–15532 CAS.
- J. Yang, K. Yu and C. Liu, J. Hazard. Mater., 2017, 321, 73–80 CrossRef CAS PubMed.
- V. Suresh, M. Kanthimathi, P. Thanikaivelan, J. R. Rao and B. U. Nair, J. Cleaner Prod., 2001, 9, 483–491 CrossRef.
- F. S. Carlos, P. Giovanella, J. Bavaresco, C. D. S. Borges and F. A. D. O. Camargo, Water, Air, Soil Pollut., 2016, 227, 175–186 CrossRef.
- D. Mamais, C. Noutsopoulos, I. Kavallari, E. Nyktari, A. Kaldis, E. Panousi, G. Nikitopoulos, K. Antoniou and M. Nasioka, Chemosphere, 2016, 152, 238–244 CrossRef CAS PubMed.
- F. Melak, G. Du Laing, A. Ambelu and E. Alemayehu, Desalination, 2016, 377, 23–27 CrossRef CAS.
- P. T. Chen, M. Fan, D. Yang, H. He, D. Liu, A. Yuan, J. Zhu and T. Chen, J. Hazard. Mater., 2009, 166, 821–829 CrossRef PubMed.
- S. Younan, G. Z. Sakita, T. R. Albuquerque, R. Keller and H. Bremer-Neto, J. Sci. Food Agric., 2016, 96, 3977–3982 CrossRef CAS PubMed.
- P. A. Vinodhini and P. N. Sudha, Textiles and Clothing Sustainability, 2017, 2, 5–20 CrossRef.
- V. Sureshkumar, S. C. G. Kiruba Daniel, K. Ruckmani and M. Sivakumar, Appl. Nanosci., 2016, 6, 277–285 CrossRef CAS.
- C. Liu, N. Fiol, J. Poch and I. Villaescusa, Journal of Water Process Engineering, 2016, 11, 143–151 CrossRef.
- C. E. Barrera-Díaz, V. Lugo-Lugo and B. Bilyeu, J. Hazard. Mater., 2012, 223–224, 1–12 CrossRef PubMed.
- N. Wang, L. Zhu, K. Deng, Y. She, Y. Yu and H. Tang, Appl. Catal., B, 2010, 95, 400–407 CrossRef CAS.
- M. Shirzad-Siboni, M. Farrokhi, R. Darvishi Cheshmeh Soltani, A. Khataee and S. Tajassosi, Ind. Eng. Chem. Res., 2014, 53, 1079–1087 CrossRef CAS.
- L. Xu, Y. Wei, W. Guo, Y. Guo and Y. Guo, Appl. Surf. Sci., 2015, 332, 682–693 CrossRef CAS.
- S. Jeong, D. Yoo, J. Jang, M. Kim and J. Cheon, J. Am. Chem. Soc., 2012, 134, 18233–18236 CrossRef CAS PubMed.
- D. Jariwala, V. K. Sangwan, L. J. Lauhon, T. J. Marks and M. C. Hersam, ACS Nano, 2014, 8, 1102–1120 CrossRef CAS PubMed.
- D. Aldakov, A. Lefrançois and P. Reiss, J. Mater. Chem. C, 2013, 1, 3756 RSC.
- F. Deng, X. Lu, L. Zhao, Y. Luo, X. Pei, X. Luo and S. Luo, J. Mater. Sci., 2016, 51, 6998–7007 CrossRef CAS.
- W. Liu, J. Cai, Z. Ding and Z. Li, Appl. Catal., B, 2015, 174–175, 421–426 CrossRef CAS.
- J. Xu, L. Wang and X. Cao, Chem. Eng. J., 2016, 816–825 CrossRef CAS.
- W. Meng, X. Zhou, Z. Qiu, C. Liu, J. Chen, W. Yue, M. Wang and H. Bi, Carbon, 2016, 96, 532–540 CrossRef CAS.
- Q. Xiang, J. Yu and M. Jaroniec, Chem. Soc. Rev., 2012, 41, 782–796 RSC.
- H. R. Thomas, S. P. Day, W. E. Woodruff, C. Vallés, R. J. Young, I. A. Kinloch, G. W. Morley, J. V. Hanna, N. R. Wilson and J. P. Rourke, Chem. Mater., 2013, 25, 3580–3588 CrossRef CAS.
- R. K. Upadhyay, N. Soin and S. S. Roy, RSC Adv., 2014, 4, 3823–3851 RSC.
- D. K. Padhi, T. K. Panigrahi, K. Parida, S. K. Singh and P. M. Mishra, ACS Sustainable Chem. Eng., 2017, 5, 10551–10562 CrossRef CAS.
- D. K. Padhi, G. K. Pradhan, K. M. Parida and S. K. Singh, Chem. Eng. J., 2014, 255, 78–88 CrossRef CAS.
- D. K. Padhi and K. Parida, J. Mater. Chem. A, 2014, 2, 10300–10312 CAS.
- D. K. Padhi, A. Baral, K. Parida, S. K. Singh and M. K. Ghosh, J. Phys. Chem. C, 2017, 121, 6039–6049 CAS.
- H. Liu, L. Deng, Z. Zhang, J. Guan, Y. Yang and Z. Zhu, J. Mater. Sci., 2015, 50, 3207–3211 CrossRef CAS.
- J. H. Kang, T. Kim, J. Choi, J. Park, Y. S. Kim, M. S. Chang, H. Jung, K. T. Park, S. J. Yang and C. R. Park, Chem. Mater., 2016, 28, 756–764 CrossRef CAS.
- R. Vinoth, P. Karthik, C. Muthamizhchelvan, B. Neppolian and M. Ashokkumar, Phys. Chem. Chem. Phys., 2016, 18, 5179–5191 RSC.
- J. Cai, W. Liu and Z. Li, Appl. Surf. Sci., 2015, 358, 146–151 CrossRef CAS.
- S. Yang, L. Li, Z. Pei, C. Li, J. Lv, J. Xie, B. Wen and S. Zhang, Colloids Surf., A, 2014, 457, 100–106 CrossRef CAS.
- D. S. Kim and S. Kwak, Appl. Catal., A, 2007, 323, 110–118 CrossRef CAS.
- M. Thommes, K. Kaneko, A. V. Neimark, J. P. Olivier, F. Rodriguez-Reinoso, J. Rouquerol and K. S. W. Sing, Pure Appl. Chem., 2015, 87, 1051–1069 CrossRef CAS.
- J. Tauc, R. Grigorovict and A. Vancu, Phys. Status Solidi, 1966, 15, 627–637 CrossRef CAS.
- L. Wang, X. Li, W. Teng, Q. Zhao, Y. Shi, R. Yue and Y. Chen, J. Hazard. Mater., 2013, 244–245, 681–688 CrossRef CAS PubMed.
- M. Radecka, M. Rekas, A. Trenczek-Zajac and K. Zakrzewska, J. Power Sources, 2008, 181, 46–55 CrossRef CAS.
- L. G. Arriaga and A. M. Fernández, Int. J. Hydrogen Energy, 2002, 27, 27–31 CrossRef CAS.
- K. Kabra, R. Chaudhary and R. L. Sawhney, J. Hazard. Mater., 2007, 149, 680–685 CrossRef CAS PubMed.
- S. Luo, Y. Xiao, L. Yang, C. Liu, F. Su, Y. Li, Q. Cai and G. Zeng, Sep. Purif. Technol., 2011, 79, 85–91 CrossRef CAS.
- K. M. Parida and N. Sahu, J. Mol. Catal. A: Chem., 2008, 287, 151–158 CrossRef CAS.
- J. Yoon, E. Shim, S. Bae and H. Joo, J. Hazard. Mater., 2009, 161, 1069–1074 CrossRef CAS PubMed.
- L. Yang, Y. Xiao, S. Liu, Y. Li, Q. Cai, S. Luo and G. Zeng, Appl. Catal., B, 2010, 94, 142–149 CrossRef CAS.
- P. Zhou, J. Yu and M. Jaroniec, Adv. Mater., 2014, 26, 4920–4935 CrossRef CAS PubMed.
- R. Marks, T. Yang, P. Westerhoff and K. Doudrick, Water Res., 2016, 104, 11–19 CrossRef CAS PubMed.
- R. Lucchetti, A. Siciliano, L. Clarizia, D. Russo, I. Di Somma, F. Di Natale, M. Guida, R. Andreozzi and R. Marotta, Environ. Sci. Pollut. Res., 2017, 24, 5898–5907 CrossRef CAS PubMed.
- K. Doudrick, T. Yang, K. Hristovski and P. Westerhoff, Appl. Catal., B, 2013, 136–137, 40–47 CrossRef CAS.
- T. Tan, D. Beydoun and R. Amal, J. Photochem. Photobiol., A, 2003, 159, 273–280 CrossRef CAS.
- Q. Chang, S. Song, Y. Wang, J. Li and J. Ma, Anal. Methods, 2012, 4, 1110 RSC.
- Y. Leng, W. Guo, S. Su, C. Yi and L. Xing, Chem. Eng. J., 2012, 211–212, 406–411 CrossRef CAS.
- X. Guan, J. Chang, Z. Xu, Y. Chen and H. Fan, RSC Adv., 2016, 6, 29054–29063 RSC.
Footnote |
| † Electronic supplementary information (ESI) available. See DOI: 10.1039/c7ra12863k |
| This journal is © The Royal Society of Chemistry 2018 |


