 Open Access Article
Creative Commons Attribution 3.0 Unported Licence
High-throughput system metabolomics method reveals new mechanistic insights of chlorogenic acid by using liquid chromatography coupled to high resolution mass spectrometry
Yu Zhang,
Yunxia Xiu,
Chunna Ren and
Cui Chen *
*
Second Affiliated Hospital, Mudanjiang Medical University, Mudanjiang, Heilongjiang 157009, P. R. China. E-mail: tt_hljzyy@163.com; Tel: +86 13694670225
First published on 14th February 2018
Abstract
It has increasingly been recognized that metabolism is highly interconnected with disease, and system metabolomics studies have aimed to discover metabolic biomarkers and analyze the pathways of metabolome phenotypes. To better understand the metabolic alteration related with disease, a urine metabolic profile using a high-throughput system metabolomics technology approach was applied to probe the underlying molecular mechanisms of alcohol-induced liver injury and the therapeutic effects of chlorogenic acid (CA). In this study, endogenous low-molecular-weight metabolites were characterized using liquid chromatography coupled with mass spectrometry (LC-MS). The acquired data was parsed by principal component analysis (PCA) and orthogonal partial least squares discriminant analysis (OPLS-DA) to identify potential biomarkers. A total of 19 biomarkers were identified in a model of alcohol-induced liver injury rats, and it was found that chlorogenic acid had a regulatory effect on 14 of them, associated with multiple metabolic pathways. Comprehensive pathway analysis suggests that CA has the ability to regulate abnormal metabolic states. In addition, accessory examinations such as biochemical analysis and histopathological observations were also performed that showed similar results. As a natural product agent against ethanol-induced liver injury, CA was validated in the rebalancing of a wide range of metabolic disorders. High-throughput system metabolomics represents a powerful approach for revealing new mechanistic insights of natural products.
1. Introduction
As a part of systems biology, metabolomics is an integral method for the assessment of small molecules such as fatty acids, amino acids, peptides, nucleic acids, organic acids, vitamins, and carbohydrates in organisms or biological samples that refers to the qualitative and quantitative analysis of the overall biological sample metabolites.1,2 Metabolome presents actual internal environment condition in individuals, which was closely associated with external disturbance and internal fluctuations. Changes in the metabolite levels in an organism can be considered as the ultimate outcome of a combination of effects including environmental impact, genetic variance, microbes or enzyme kinetic activity changes, amongst others.3,4 Currently, there are not as yet efficient solutions for preventing or treating a great number of different diseases. The reasons for this situation may include measurements being performed too late or too early in the course of the disease, inadequate treatment targets on account of a lack in pathogenic knowledge and insufficient knowledge on the specific clinical features of the diseases.Alcohol metabolism is hazardous to health due to a series of poisonous substances that arise during its progression that are difficult to eliminate. As a worldwide burden, alcoholic liver disease (ALD) represents the greatest impact that alcohol can have on the body, compared with any other diseases it causes, and refers to a serious health problem of excessive alcohol consumption, leading to chronic disease and even mortality. As we all know, ALD mainly relates to the disorder of a metabolic pathway, but traditional medical measurement methods such as pathological tests, biochemistry indexes and symptom assessments are unable to provide deep insight into pathological or metabolic alterations giving rise to liver injury that have been specifically induced by alcohol intake. Routine clinical examinations of the liver function in accordance with serum indexes, such as alanine amino-transferase (ALT) and aspartate aminotransferase (AST), are not sensitive and also fail to achieve early diagnosis.5,6 The metabolites in chaos during the ALD pathogenetic process enter the urinary environment and are then secreted in the urine. For the reasons given above, urine is a perfect source for selecting bio-samples in order to characterize the physiological environment in a non-invasive way. With a major improvement in modern metabolomics technology, it provides us with the opportunity to measure metabolites and obtain the metabolic fingerprint of individual patients in practice.7 These potential metabolites were deemed as diagnostic or prognostic tools that can be used to identify impairments in system occurring during the development and worsening of disease and assist clinicians to direct the stages differentiation and alter appropriate treatment.8–10
Compared with current available therapeutic options, natural products are becoming popular all over the world and are widely accepted as a conservative clinical therapy in the field of health promotion and disease treatment due to their effectiveness, convenience, fewer side-effects and relatively low cost.11,12 CA as a vital biosynthetic intermediate is the key ester component of caffeic acid and quinic acid,13,14 and has been discovered in a number of dietary plants and medicinal herbs such as Phyllostachys edulis15 and possesses strong anti-inflammatory,16 antioxidative,17 antihypertensive,18 antitumor,19 analgesic, antipyretic20 and other properties.21 Some previous studies have reported that CA reduces carbon tetrachloride-induced liver fibrosis and inhibits oxidative stress in liver and hepatic stellate cells.22,23 However, the mechanism of CA towards liver injury is still not well known. It is urgently needed to further research. Using an untargeted metabolomics method combined with a multivariate data method and pathway analysis, the aim of this study is to explore the potential mechanisms of metabolic disorder caused by ethanol in rats and the protective effect of CA using the profiling of urinary metabolites.
2. Materials and methods
2.1 Materials and reagents
Methanol (HPLC grade) was obtained from Fisher Scientific Corporation (Loughborough, UK); acetonitrile (ACN) (HPLC grade) was purchased from Merck (Darmstadt, Germany); formic acid was purchased from Honeywell Company (Morristown, New Jersey, USA); deionized water was produced by using a Milli-Q water ultra-pure water system (Millipore, Bedford, MA, USA); leucine enkephalin was purchased from Sigma-Aldrich (St. Louis, MO, USA). Chlorogenic acid (99% purity) was purchased from the Tianjin Chemical Reagent Co. (Tianjin, China). The assay kits for ALT, AST, alkaline phosphatase (ALP) and γ-glutamyl transpeptidase (γ-GT) were purchased from Biosino Company (Beijing, China). The assay kits for glutathione-Px (GSH-Px), maleicdialdehyde (MDA) and superoxide dismutase (SOD) were purchased from Nanjing Jiancheng Biological Research Institute (Nanjing, China). All other reagents were of analytical grade.2.2 Animal models and treatment
Wister rats (weighing 200 ± 20 g, male) were purchased from the Shanghai Slac Experimental Animal Centre. Rats were maintained in specific pathogen-free metabolic cages in a room with a 12 h light/dark cycle at an appropriate temperature of 24 ± 2 °C and relative humidity of 50 ± 5%. After acclimatizing in the metabolism cages for one week prior to dosing, the 24 rats were randomly assigned to three groups with 8 rats in each as follows: control, model and CA group. 95% (v/v) alcohol was diluted to 55% with water and 12 mL kg−1 was administered daily to each rat. The rats in the model group and CA group were orally administrated with ethanol at a dosage of 55% v/v once a day for 7 consecutive days to induce an animal liver injury model. The CA group was administrated with 9 mg mL−1 chlorogenic acid solution (7 mL kg−1) once a day for the following 14 days. The control group was administrated with distilled water at the same dosage. All of the experiments were approved by the Animal Care and Ethics Committee at Mudanjiang Medical University and were also performed in accordance to the declaration of Helsinki.2.3 Biological sample collection and preparation
The urine samples with a volume range of approximately 5–7 mL were collected at 9:00 a.m. every day. The rats and cages were homologous during the whole experimental process to avoid any external disturbance. Then, all of the urine samples were centrifuged at 13![[thin space (1/6-em)]](https://www.rsc.org/images/entities/char_2009.gif) 000 rpm, at 4 °C for 15 min and the separated supernatants were stored in liquid nitrogen until the metabolomics research. “Quality control” (QC) sample which contain a great deal of information of urine samples for optimizing LC-MS conditions were randomly choose from three groups and then put them together. At the end of the fourteen day treatment process, all of the blood samples were collected from the aorta abdominalis 24 hours after the final administration and were processed via centrifugation at 3000 rpm, at 4 °C for 15 min. The serum samples were transferred into Eppendorf Tubes and were stored in liquid nitrogen for clinical biochemistry examinations, conforming to standard procedures. Finally, the livers were removed from the rats promptly for hematoxylin and eosin (H&E) staining analysis.24
000 rpm, at 4 °C for 15 min and the separated supernatants were stored in liquid nitrogen until the metabolomics research. “Quality control” (QC) sample which contain a great deal of information of urine samples for optimizing LC-MS conditions were randomly choose from three groups and then put them together. At the end of the fourteen day treatment process, all of the blood samples were collected from the aorta abdominalis 24 hours after the final administration and were processed via centrifugation at 3000 rpm, at 4 °C for 15 min. The serum samples were transferred into Eppendorf Tubes and were stored in liquid nitrogen for clinical biochemistry examinations, conforming to standard procedures. Finally, the livers were removed from the rats promptly for hematoxylin and eosin (H&E) staining analysis.24
2.4 Clinical chemistry and histopathological examinations
Clinical biochemistry analysis was conducted using standard methods and the acquired data were analyzed using the SPSS 19.0 software. The histological morphology examinations were performed by the affiliated hospital Heilongjiang University of Chinese Medicine. H&E staining using the Image-Pro Plus 5.0 software (Media Cybernetics, Bethesda, MD, USA) for image analysis were performed on the hepatic tissues of the control, model and CA groups.2.5 Metabolomic studies
3. Results and discussion
3.1 Biochemical analysis and histopathological observations
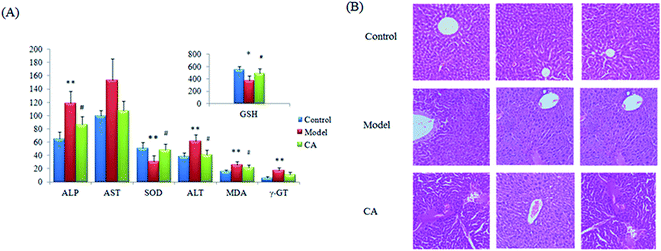
Using ethanol gavage, the alcohol-induced liver injury model was manufactured by intragastric administration with ethanol for 7 days, taking the shape of liver damage in the rats. The rats obviously presented in a drunken state, resulting in more severe in-serum concentrations of ALP, AST, ALT, γ-GT and MDA together with concentration decreases of GSH and SOD in the model rats compared with those of the control groups. GSH is an important antioxidant having the ability to scavenge free radicals in vivo, and the change in the number of free radicals suggests the result of a liver system injury, oxidative stress and lipid metabolism disorders. After CA effective treatment, all of the imbalances in the indicators mentioned were relieved and highlighted differences were found for most indexes except γ-GT when compared with the model samples (Fig. 1A). HE staining analysis was performed on hepatic tissue from the model, control and CA groups to examine the pathology of the liver such as cytomorphology and cellular apoptosis (Fig. 1B). The liver tissue structure from the normal group samples is normal and inconspicuous abnormalities were observed in the liver tissues such as lipid droplets, swelling and inflammatory cell infiltration. In addition, significant differences were shown in the ethology of the rats. The rats in the control group were evaluated as being in an active and normal state and rats in the model group were restless and aggressive during the initial phase and malaise and lethargic several hours later. However, compared with the model group, all of the indexes had been reversed to different levels after a 14 day treatment with the chlorogenic acid. The swollen cells, balloon-like changes and hepatic sinus congestion symptoms of the treatment group were significantly relieved. These results suggest that the alcohol-induced liver injury model was successfully established and that chlorogenic acid could ameliorate liver tissue injury caused by ethanol exposure.3.2 Metabolomic analysis
The normalized data of endogenous metabolites were imported to EZinfo 2.0 software (Waters Corporation, Manchester, UK) for multivariate analysis and constructing model such as PCA, PLS and OPLS-DA. The PCA method was applied to differentiate and assess every group status. OPLS-DA or PLS-DA can eliminate some variations that are not associated with the dependent variables in the independent variables to lower the complexity of the model using parameters such as R2Y (cum), Q2 (cum), and R2X (cum) to evaluate the model quality and advance the model prediction capability. But beyond that, the OPLS-DA approach possesses the ability to clearly show the differences between the control group and the model group to discover and discriminate the biomarkers. The OPLS-DA score plots (Comp1 R2X (cum) = 0.905408, Comp2 R2X (cum) = 0.905408 in positive mode and Comp1 R2X (cum) = 0.999126, Comp2 R2X (cum) = 0.999126 in negative mode) shows obvious credible difference between the control group and the model group. Ultimately, the metabolites were intensively studied using other internet tools for screening out biomarkers.According to the LC-MS, urine metabolomics was used to explore the potential hepatoprotective effect mechanisms of chlorogenic acid in ethanol-induced liver damage. Urine metabolic profiling was obtained using both the positive and negative ion modes of LC-MS. OPLS-DA as a high variation and prediction capability supervised method to examine LC-MS dataset discrimination between the control and model groups. From the OPLS-DA score plots (Fig. 2A and B), the model and control groups are distinctly separated, which implies that significant metabolic variations exist among these samples and that the models show pathological changes though metabolic differences resulting from pathological lesions as a vital role in the group separation. Though multivariate statistical analysis, 19 differentially expressed biomarker metabolites regarded to result in the metabolic differences between the control and model group were identified. These metabolites indicated an unbalanced metabolism arising in the liver injured animals.
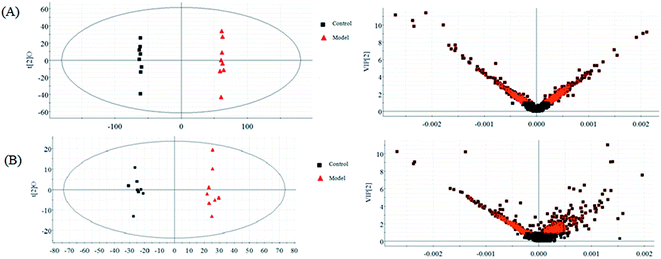 | ||
| Fig. 2 OPLS-DA and VIP score plots of the control and model groups in positive (A) and negative (B) modes. | ||
Typically, clustering of samples from all of the different groups is shown by the PLS-DA score plots, of which each data point represents a rat urine metabolome and the spatial distance suggests the scale of their metabolic discrepancy to some degree from the positive and negative modes. After the 14 day treatment of CA, the metabolic profiles of rats in CA group present the different tracks relative to the model group, which data point were gradually close to the normal sample state. A clear metabolic track from the in score plots suggested that the chlorogenic acid treatment showed a protective effect in reversing urinary biochemical perturbation resulting from alcohol (Fig. 3).
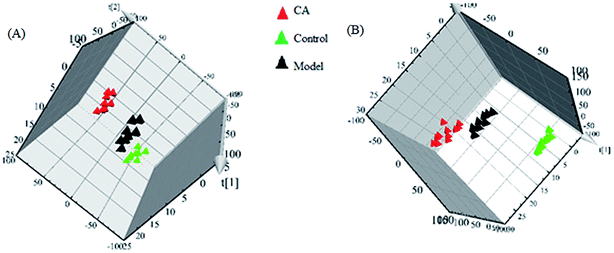 | ||
| Fig. 3 Clustering of samples from all of the different groups in positive (A) and negative (B) modes. | ||
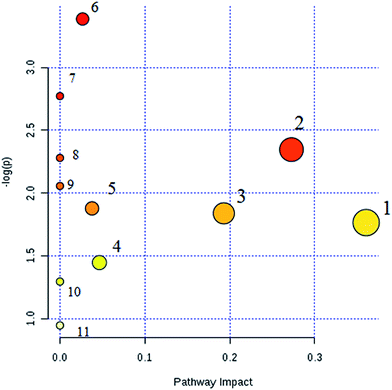
Interrelation of the correlation matrix among the 19 biomarkers using Pearson's linear correlation analysis with different degrees of change in the control, CA and model groups are shown in Fig. 4. The color scale shows the magnitude and direction of the relationship of the 19 biomarkers among the different groups, with red representing the positive and green representing the negative correlations. We identified a total of 14 distinct metabolic biomarkers after CA treatment including glutaminyl-tryptophan, glutathione, 4-hydroxyphenylacetaldehyde, 2-phenylacetamide, epinephrine, L-aspartic acid, N-acetyl-D-glucosamine 6-phosphate, alanyl-glycine, 2-keto-6-acetamidocaproate, oxalic acid, tyrosol, 3-indole carboxylic acid glucuronide, p-cresol glucuronide and 5-hydroxy-6-methoxyindole glucuronide. Then, pathway analysis related with pharmacological action of anti-liver injury of CA was based on the MetaboAnalyst software which is a powerful way to probe into the most relevant pathways associated with in a specific condition (Fig. 5).
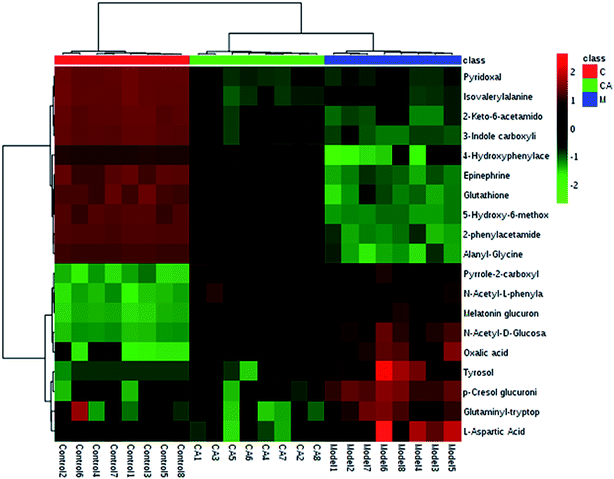 | ||
| Fig. 4 Hierarchical clustering heat map of the 19 differential metabolites with the degree of change marked with colors including up-regulation (red) and down-regulation (green). | ||
4. Discussion
High-throughput metabolomics represents a powerful approach for revealing new mechanistic insights into natural products.27–30 The liver is the most vital organ in bio-metabolism offering basic metabolic, exocrine and endocrine functions. Metabolic disorders resulting from liver disease are often extensive. Alcohol-induced liver injury is mainly through the following pathway: NADH refers to the coenzyme of fatty acid synthesis and NAD is the coenzyme of fatty acid oxidation. NADH/NAD imbalance leads to increased synthesis and reduced decomposition of fatty acids, which results in a large number of triglycerides in the liver associated with a fatty liver;31 the toxic effects of ethanol and acetaldehyde on hepatocytes cause cell membrane damage; this then causes antigen changes in the liver cells due to their own immune response; ethanol hypercholesterolemia causes hepatocyte hypoxia; acetaldehyde promotes collagen synthesis, which is related to inflammation stimulating collagen fiber proliferation to cause liver fibrosis.32 From clinical biochemical indicators, toxic reactions, abnormal amino acid metabolism and oxidation–reduction reaction were emerged in the rat body. The alcoholic liver injury results in significant increases in the serum levels of ALP, AST, ALT, γ-GT and MDA together with decreases in the GSH and SOD levels compared with those of the control groups. According to histopathological observations of the liver, the liver injury model of the rats was also proven to be successful.CA reverses the above abnormalities in an effective way. Metabolomics studies can detect the significant alteration of various endogenous metabolites. CA notably regulates 14 metabolites and 11 metabolic pathways including glutathione metabolism, pentose and gluconate metabolism, as well as amino acid metabolism, to have a protective effect on ethanol-induced liver injury. Glutathione, as a natural cell antioxidant, composed of glutamic acid, cysteine and glycine, is rich in the liver and is characterized by antioxidant activity and detoxification.33 When the liver is damaged, such as suffering from a variety of liver diseases, the body will provide a lot of glutathione for self-rehabilitation and detoxification. From the biochemical indicators, the reduction of glutathione content in vivo due to glutathione peptide peroxidase depletion and decreased activity is one of the gold indicators of liver cell damage in the clinic. The liver is the largest detoxification organ in the body. Toxic substances entering into the blood by various ways are converted into water-soluble substances and other non-toxic or low toxicity compounds mostly by liver cell metabolism and are then excreted though the kidney or bile.34,35 One of the liver detoxification methods is the target binding effect by oxidation, reduction, hydrolysis and other ways to work on toxic chemical groups and to change their physical and chemical properties, such as molecular size, as well as their water solubility. Glucuronide detoxification plays an important role in the process of combination detoxification. The liver is an important place for amino acid and carbohydrate synthesis and metabolism. It was reported that tyrosinemia, hepatocellular disease, fatty infiltrating hepatocytes, necrosis and jaundice are related to the abnormal metabolism of amino acid enzymes. The pathways associated with these biomarkers indicate their significant disorder in ethanol-induced liver injury which may lead to disease progression.
5. Conclusion
The liver is not only the major organ for ethanol metabolism, but also the primary objective organ for alcohol consumption. In recent years, studies on the protective mechanisms of active components from natural products for protection against liver injury by alcohol intake have attracted more and more attention. Using metabolism analysis based on metabolomic technologies, the therapeutic effect of CA on ethanol-induced liver injury has been revealed and the pivotal live protection molecular mechanisms were probed. The results suggested that CA remarkably reversed ethanol-induced liver injury by rebalancing the glutathione metabolism, carbohydrate metabolism and multiple amino acid metabolisms. Although the pathogenesis of ethanol-induced liver injury is extremely complicated and the target objective of CA is also broad, this study based on metabolomics brings about a better understanding of the action mechanisms of CA on ethanol-induced liver injury.Conflicts of interest
There are no conflicts to declare.References
- A. Zhang, H. Sun and X. Wang, Mass spectrometry-driven drug discovery for development of herbal medicine, Mass Spectrom. Rev., 2016, 9999, 1–14 Search PubMed.
- X. Li, A. Zhang, H. Sun, Z. Liu, T. Zhang, S. Qiu, L. Liu and X. Wang, Metabolic characterization and pathway analysis of berberine protects against prostate cancer, Oncotarget, 2017, 8, 65022–65041 Search PubMed.
- A. Zhang, H. Sun and G. Yan, et al., Metabolomics for Biomarker Discovery: Moving to the Clinic, BioMed Res. Int., 2015, 2015, 354671 Search PubMed.
- J. S. Tian, X. T. Xia and Y. F. Wu, et al., Discovery, screening and evaluation of a plasma biomarker panel for subjects with psychological suboptimal health state using (1)H-NMR-based metabolomics profiles, Sci. Rep., 2016, 6, 33820 CrossRef CAS PubMed.
- D. Pei, T.-L. Hsia and T.-T. Chao, et al., γ-Glutamyl Transpeptidase in Men and Alanine Aminotransferase in Women are the Most Suitable Parameters Among Liver Function Tests for the Prediction of Metabolic Syndrome in Nonviral Hepatitis and Nonfatty Liver in the Elderly, Saudi J. Gastroenterol., 2015, 21(3), 158–164 CrossRef PubMed.
- A. Zhang, H. Sun, G. Yan, P. Wang and X. Wang, Mass spectrometry-based metabolomics: applications to biomarker and metabolic pathway research, Biomed. Chromatogr., 2016, 30(1), 7–12 CrossRef PubMed.
- A. Zhang, H. Sun and H. Xu, et al., Cell metabolomics, OMICS: J. Integr. Biol., 2013, 17(10), 495–501 CrossRef CAS PubMed.
- A. Zhang, H. Sun and P. Wang, et al., Metabonomics for discovering biomarkers of hepatotoxicity and nephrotoxicity, Pharmazie, 2012, 67(2), 99–105 CAS.
- A. H. Zhang, H. Sun, S. Qiu and X. J. Wang, NMR-based metabolomics coupled with pattern recognition methods in biomarker discovery and disease diagnosis, Magn. Reson. Chem., 2013, 51(9), 549–556 CrossRef CAS PubMed.
- X. Wang, A. Zhang, H. Sun, Y. Han and G. Yan, Discovery and development of innovative drug from traditional medicine by integrated chinmedomics strategies in the post-genomic era, TrAC, Trends Anal. Chem., 2016, 76, 86–94 CrossRef CAS.
- J. Gong, F. Yin and Y. Hou, et al., Chinese herbs as alternatives to antibiotics in feed for swine and poultry production: potential and challenges in application, J. Anim. Sci., 2014, 94, 223–241 Search PubMed.
- Y. Zhou, Z. Ruan and X. L. Li, et al., Eucommia ulmoides Oliver leaf polyphenol supplementation improves meat quality and regulates myofiber type in finishing pigs, J. Anim. Sci., 2016, 94(suppl. 3), 164–168 CrossRef CAS.
- W. Boerjan, J. Ralph and M. Baucher, Lignin biosynthesis, Annu. Rev. Plant Biol., 2003, 54, 519–546 CrossRef CAS PubMed.
- R. Gao, Y. Lin, G. Liang, B. Yu and Y. Gao, Comparative pharmacokinetic study of chlorogenic acid after oral administration of Lonicerae Japonicae Flos and Shuang-Huang-Lian in normal and febrile rats, Phytother. Res., 2014, 28, 144–147 CrossRef CAS PubMed.
- M. H. Kweon, H. J. Hwang and H. C. Sung, Identification and antioxidant activity of novel chlorogenic acid derivatives from bamboo (Phyllostachys edulis), J. Agric. Food Chem., 2001, 49, 4646–4655 CrossRef CAS PubMed.
- Y. Zhou, Z. Ruan and L. Zhou, et al., Chlorogenic acid ameliorates endotoxin-induced liver injury by shifting energy metabolism from glycolysis to mitochondrial biogenesis, Biochem. Biophys. Res. Commun., 2016, 469(4), 1083–1089 CrossRef CAS PubMed.
- N. P. Riksen, G. A. Rongen and P. Smits, Acute and long-term cardiovascular effects of coffee: implications for coronary heart disease, Pharmacol. Ther., 2009, 121, 185–191 CrossRef CAS PubMed.
- Y. Zhao, J. Wang and O. Ballevre, et al., Antihypertensive effects and mechanisms of chlorogenic acids, Hypertens. Res., 2012, 35, 370–374 CrossRef CAS PubMed.
- A. B. Granado-Serrano, M. A. Martín and M. Izquierdo-Pulido, et al., Molecular mechanisms of (−)-epicatechin and chlorogenic acid on the regulation of the apoptotic and survival/proliferation pathways in a human hepatoma cell line, J. Agric. Food Chem., 2007, 55, 2020–2027 CrossRef CAS PubMed.
- U. Takahama, M. Tanaka and S. Hirota, Interaction between ascorbic acid and chlorogenic acid during the formation of nitric oxide in acidified saliva, J. Agric. Food Chem., 2008, 56, 10406–10413 CrossRef CAS PubMed.
- Z. Ruan, S. Mi and L. Zhou, et al., Chlorogenic acid enhances intestinal barrier by decreasing MLCK expression and promoting dynamic distribution of tight junction proteins in colitic rats, J. Funct. Foods, 2016, 26, 698–708 CrossRef CAS.
- H. Shi, L. Dong, Y. Bai, J. Zhao, Y. Zhang and L. Zhang, Chlorogenic acid against carbon tetrachloride-induced liver fibrosis in rats, Eur. J. Pharmacol., 2009, 623, 119–124 CrossRef CAS PubMed.
- H. Shi, A. Shi and L. Dong, et al., Chlorogenic acid protects against liver fibrosis in vivo and in vitro through inhibition of oxidative stress, Clin. Nutr., 2016, 35(6), 1366–1373 CrossRef CAS PubMed.
- Q. He, X. Kong and G. Wu, et al., Metabolomic analysis of the response of growing pigs to dietary L-arginine supplementation, Amino Acids, 2009, 37(1), 199–208 CrossRef CAS PubMed.
- Q. He, P. Ren and X. Kong, et al., Intrauterine growth restriction alters the metabonome of the serum and jejunum in piglets, Mol. BioSyst., 2011, 7, 2147–2155 RSC.
- Q. He, H. Tang and P. Ren, et al., Dietary Supplementation with L-Arginine Partially Counteracts Serum Metabonome Induced by Weaning Stress in Piglets, J. Proteome Res., 2011, 10, 5214–5221 CrossRef CAS PubMed.
- A. Zhang, H. Sun, G. Yan and X. Wang, Recent developments and emerging trends of mass spectrometry for herbal ingredients analysis, TrAC, Trends Anal. Chem., 2017, 94, 70–76 CrossRef CAS.
- S. Qiu, A. Zhang, T. Zhang, H. Sun, Y. Guan, G. Yan and X. Wang, Dissect new mechanistic insights for geniposide efficacy on the hepatoprotection using multiomics approach, Oncotarget, 2017, 8(65), 108760–108770 Search PubMed.
- A. Zhang, H. Fang and Y. Wang, et al., Discovery and verification of the potential targets from bioactive molecules by network pharmacology-based target prediction combined with high-throughput metabolomics, RSC Adv., 2017, 7(81), 51069–51078 RSC.
- H. Wang, G. Yan and A. Zhang, et al., Rapid discovery and global characterization of chemical constituents and rats metabolites of Phellodendri amurensis cortex by ultra-performance liquid chromatography-electrospray ionization/quadrupole-time-of-flight mass spectrometry coupled with pattern recognition approach, Analyst, 2013, 138(11), 3303–3312 RSC.
- P. A. Lind, S. Macgregor and A. C. Heath, et al., Association between in vivo alcohol metabolism and genetic variation in pathways that metabolize the carbon skeleton of ethanol and NADH reoxidation in the Alcohol Challenge Twin Study, Alcohol.: Clin. Exp. Res., 2012, 36(12), 2074–2085 CrossRef CAS PubMed.
- W. H. Watson, Z. Song and I. A. Kirpich, et al., Ethanol exposure modulates hepatic S-adenosylmethionine and S-adenosylhomocysteine levels in the isolated perfused rat liver through changes in the redox state of the NADH/NAD+ system, Biochim. Biophys. Acta, 2011, 1812(5), 613–618 CrossRef CAS PubMed.
- I. Finamor, S. Pérez and C. A. Bressan, et al., Chronic aspartame intake causes changes in the trans-sulphuration pathway, glutathione depletion and liver damage in mice, Redox Biol., 2017, 11, 701–707 CrossRef CAS PubMed.
- M. A. Kaabneh, G. S. Salama and A. G. Shakkoury, Phenobarbital and Phototherapy Combination Enhances Decline of Total Serum Bilirubin and May Decrease the Need for Blood Exchange Transfusion in Newborns with Isoimmune Hemolytic Disease, Clin. Med. Insights Pediatr., 2015, 9, 67–72 Search PubMed.
- W. L. Liu, F. Li, Z. X. He and H. Y. Jiang, Analysis of bilirubin UDP-glucuronosyltransferase gene mutations in an unusual Crigler-Najjar syndrome patient, Mol. Med. Rep., 2012, 6(3), 667–669 CrossRef CAS PubMed.
| This journal is © The Royal Society of Chemistry 2018 |

