DOI:
10.1039/C7RA13048A
(Paper)
RSC Adv., 2018,
8, 6075-6082
Determination of berberine hydrochloride using a fluorimetric method with silica nanoparticles as a probe
Received
5th December 2017
, Accepted 31st January 2018
First published on 6th February 2018
Abstract
The interaction of silica nanoparticles (SiO2NPs) with berberine hydrochloride (BRH) was studied in aqueous solution at pH 9.0 and room temperature by using fluorophotometry. Based on a significant enhancement of the fluorescence intensity of the SiO2NPs–BRH aggregates, a spectrofluorimetric method which was simple, sensitive and green was developed for the determination of BRH in aqueous solution. The linear range of the method was from 2.0–50.0 μg L−1 with a detection limit of 0.73 μg L−1. There was no interference from the compounds normally used to formulate pharmaceutical tablets. The proposed method was applied to the determination of BRH in tablets with satisfactory results and good consistency with the results obtained by standard methods.
1. Introduction
Berberine hydrochloride (BRH, the molecular structure is shown in Fig. 1) is a significant natural isoquinoline alkaloid, which is a key active ingredient in traditional Chinese medicine. It is widely used as an antibacterial and anti-inflammatory drug in pharmaceutical products.1,2 Recently, there has been a growing interest in the pharmaceutical activities of BRH toward infectious diseases, cardiovascular disorders, diabetes, and cancer.3–5 Due to the bioactivity and wide potential applications of BRH, many analytical methods have been reported for the its determination, including spectrophotometry,6–8 resonance light scattering spectrometry (RLS),9,10 chemiluminescence,11 high performance liquid chromatography (HPLC),12,13 capillary electrophoresis,14 and electrochemical analysis.15,16 Another analytical method gaining importance is fluorophotometry, which is characterized by its high selectivity and sensitivity, simple setup, and convenient operation. Fluorophotometry has been widely applied for the determination of different analytes, including inorganic ions, organic compounds, biomacromolecules, and pharmaceuticals.17–20 Furthermore, sensitive fluorophotometry has been reported with metal nanoparticles as probes for the determination of organic compounds and BRH,21–24 and receptor molecules such as cyclodextrin,25,26 calixarenes,27 and cucurbituril28 have also been used for the determination of BRH by fluorophotometry. These molecules are capable of interacting with the BRH molecules through noncovalent intermolecular forces or cavity encapsulation to form aggregations (or supramolecular complexes). The formation of the aggregation often affects the enhancements or perturbations of the photophysical and photochemical properties of the included guest molecules.29
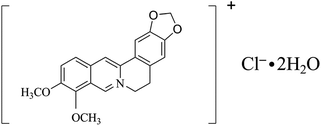 |
| | Fig. 1 The chemical structure of berberine hydrochloride. | |
In recent years, silica nanoparticles (SiO2NPs) have attracted remarkable interest for biomedical applications because of their special physicochemical properties, such as good solid dispersions, relatively large specific surface areas and biocompatibility, low cost, ease of production, and lack of toxicity. Pure and dye-doped SiO2NPs were prepared, and their surfaces were modified with enzymes and biocompatible chemical reagents that allow them to function as biosensors and biomarkers.30–33 Sensitive and selective fluorescent aptasensors based on SiO2NPs have been investigated for the determination of biomacromolecules or drugs.34,35 Moreover, Fan36 reported the use of SiO2NPs as a probe for the determination of methylene blue by RLS technique. Nevertheless, the determination of BRH by fluorophotometry with SiO2NPs as a probe has not been reported.
In the present study, a marked increase was found in the fluorescence intensity of BRH in aqueous media with SiO2NPs. Therefore, a simple, novel, and green method for the detection of BRH in aqueous solution was developed by fluorophotometry with SiO2NPs as a probe. In addition, the optimal factors for the determination of BRH were investigated, and the related mechanisms were also considered. This method was applied for the analysis of practical samples with respectable results.
2. Experimental
2.1. Reagents
BRH was purchased from Aladdin Chemical Reagent (Los Angeles, USA) and was used to prepare a 100.0 mg L−1 stock solution. The working solutions were prepared by diluting the stock solution to 100.0 μg L−1. SiO2NPs (CQ380) were obtained from Emeishan Changqing Chemical New Material Co., Ltd. (China). Acetic acid, boric acid, phosphoric acid, and sodium hydroxide were supplied from the Xi'an Chemical Reagent Factory (Xi'an, China). A Britton–Robinson (BR) buffer solution was prepared by mixing 0.04 mol L−1 acetic acid, 0.04 mol L−1 boric acid, 0.04 mol L−1 phosphoric acid, and 0.2 mol L−1 sodium hydroxide solution in specific proportions. All chemicals used in the experiments were of analytical grade and used without further purification. Deionized water was used for preparing all samples and solutions.
2.2. Apparatus
The instruments used in this study were as follows: F-4500 spectrofluorophotometer (Hitachi, Japan); UV-1700 spectrophotometer (Shimadzu, Japan); H-600 transmission electron microscope (Hitachi, Japan); DB-525 Zeta Potential Analyzer (Brookhaven, USA); pHs-3C digital pH meter (Shanghai Lei Ci Device Works, China) with a glass electrode (Model E-201-C); and magnetic stirrer (Gongyi Yuhua Instrument Factory, China).
2.3. Preparation of SiO2NPs dispersion
Exactly 0.10 g of SiO2NPs was weighed out and added into 200.0 mL of deionized water under vigorous stirring for 10 min, and then the mixture was placed in an ultrasonic bath for 30 min at room temperature to completely disperse the SiO2NPs. The concentration of the dispersion was 0.05%.
2.4. Preparation of samples
The sugar coating was carefully removed from 10 tablets and the contents were carefully pulverized. The powders were then thoroughly mixed. A portion of the mixed powders was accurately weighed and placed in a 100 mL volumetric flask. The powder was dissolved by addition of deionized water up to the mark and sonication for 10 min, and the solution was then filtered. The first 30 mL of the filtrate were discarded, a portion of the remaining filtered sample solution was diluted to the mark in a 100 mL volumetric flask, and this solution was analyzed according to the general procedure.
2.5. General procedure
The general procedure for determination of BRH is as follows: 0.8 mL of 0.05% SiO2NPs dispersion, 0.5 mL of BR buffer solution (pH 9.0), and a certain amount of BRH working solution were added into a 10.0 mL volumetric flask, diluted to the mark with deionized water, and sonicated for 2 min. The resulting solution was left at room temperature for 30 min, and then the fluorescence intensity was measured at 540 nm with an excitation wavelength of 355 nm. The enhanced fluorescence intensities of the solutions were calculated by the following equation: ΔIF = IF − IF0 (in which IF and IF0 are the fluorescence intensities of the SiO2NPs in the presence and absence of BRH). All experiments were conducted at room temperature.
3. Results and discussion
3.1. Absorption spectra
The absorption spectra of BRH and the SiO2NPs–BRH aggregates are shown in Fig. 2. The absorbance of the solution gradually decreased and the absorption spectrum shifted toward longer wavelength (2–5 nm) with addition of SiO2NPs, as well as there were three obvious isosbestic points (354 nm, 389 nm, 435 nm). This corresponds to the absorption of aggregates which is clearly different from unaggregated. In addition, the excitation spectrum at 450 nm was also observed except for 355 nm (Fig. 3A). The phenomenons might be because the positive charge of BRH causes it to be adsorbed on the surface of the SiO2NPs to form SiO2NPs–BRH aggregates.37
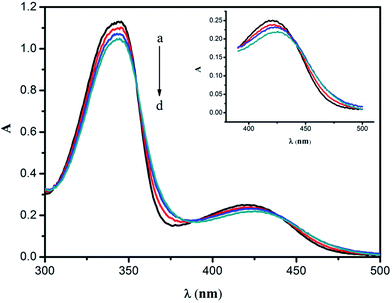 |
| | Fig. 2 Absorption spectra. Conditions: (a) BRH, 20 mg L−1; (b–d) a + SiO2NPs (0.01, 0.02, and 0.03%); pH 9.0. | |
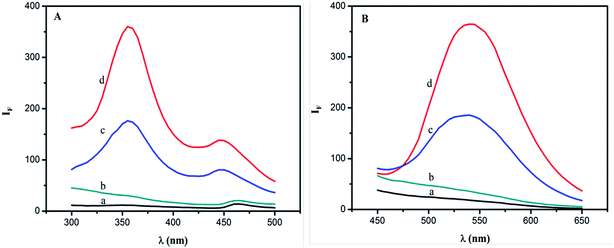 |
| | Fig. 3 Excitation (A) and emission (B) spectra. Conditions: (a) BRH, 50 μg L−1; (b) SiO2NPs, 0.004%; (c, d) b + BRH (20, 50 μg L−1); pH 9.0. | |
3.2. Excitation and emission spectra
The excitation and emission spectra were measured according to the general procedure. The results are shown in Fig. 3. The excitation wavelengths were located at 355 and 450 nm, and the emission wavelengths were at 540 nm. The fluorescence intensities of the BRH and SiO2NPs on their own were very small at 540 nm in aqueous solution. However, when SiO2NPs was added to the aqueous solution of BRH, the fluorescence intensity was significantly enhanced. Because BRH molecules were bound to the surfaces of the SiO2NPs and protected as SiO2NPs–BRH aggregates, the fluorescence intensity increased. Therefore, the concentration of BRH could be determined by fluorophotometry by using SiO2NPs as a probe.
3.3. TEM images and the dynamic light scattering (DLS)
The TEM images of SiO2NPs and the SiO2NPs–BRH aggregates are shown in Fig. 4. When the SiO2NPs reacted with BRH under the optimal conditions, the size increased as the aggregates of the BRH and SiO2NPs were formed. The SiO2NPs–BRH aggregates exhibit tufted shapes as shown in Fig. 4B.
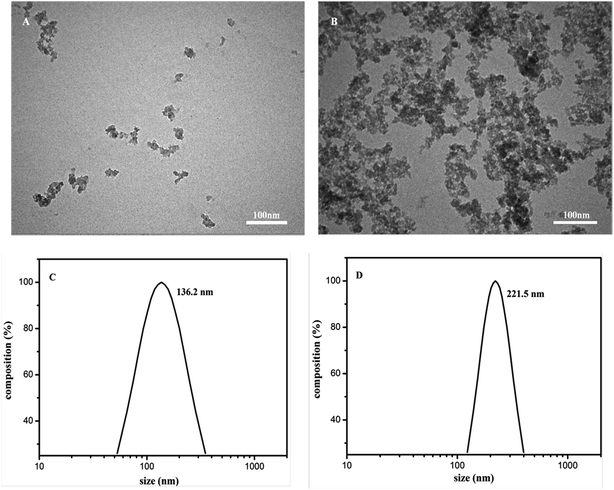 |
| | Fig. 4 TEM images of SiO2NPs (A) and SiO2NPs–BRH (B). The size distribution curve of SiO2NPs (C) and SiO2NPs–BRH (D). | |
The size distribution of SiO2NPs and SiO2NPs–BRH aggregates were measured by the DLS in order to confirm the formation of aggregates. As shown in Fig. 4C and D, the average diameters of the SiO2NPs in the solution were about 136.2 nm in the absence of BRH and they were prominently increased by roughly 90 nm at the addition of BRH due aggregation occurred.
3.4. Effect of pH
The pH of the solution plays an important role in the interaction between the BRH and SiO2NPs, because it affects the surface charge properties of the SiO2NPS. Hence, the influence of the pH on ΔIF was studied over a wide range of pH from 6 to 11. The results are shown in Fig. 5. The maximum value of ΔIF was obtained at pH 9.0. Therefore, BR buffer with pH 9.0 was used for further experiments.
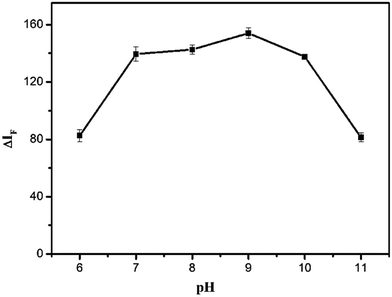 |
| | Fig. 5 Effect of pH on ΔIF. Conditions: SiO2NPs: 0.004%; BRH: 20.0 μg L−1. | |
3.5. Effect of reaction time and temperature
The effects of different reaction times and temperatures were investigated. As shown in Fig. 6, the ΔIF reached a maximum value after 30 min and remained constant for 2 h. The temperature test results (Fig. 7) indicated that the fluorescence intensity of the solution remained stable between 10 and 40 °C. Thus, 30 min of reaction time and room temperature were selected for further research.
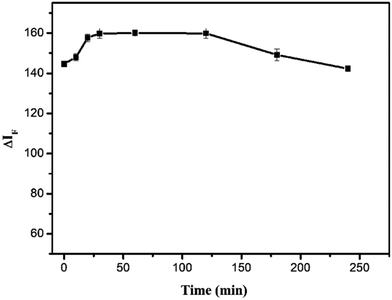 |
| | Fig. 6 Effect of reaction time on ΔIF. Conditions: SiO2NPs: 0.004%; BRH: 20.0 μg L−1; pH 9.0. | |
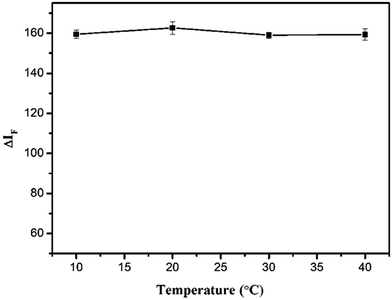 |
| | Fig. 7 Effect of reaction temperature on ΔIF. Conditions: SiO2NPs: 0.004%; BRH: 20.0 μg L−1; pH 9.0. | |
3.6. Effect of concentration of SiO2NPs
The effect of the concentration of SiO2NPs on the ΔIF value was investigated. The linear regression equations and R2 values are given in Fig. 8. When the concentration of SiO2NPs was greater than 0.004%, the reagent blank increased and the linear range narrowed. If the concentration of SiO2NPs was lower than 0.004%, the linear range was relatively narrow because of incompletion of the interaction between BRH and the SiO2NPs. Therefore, 0.004% was selected as a suitable concentration for further experiments.
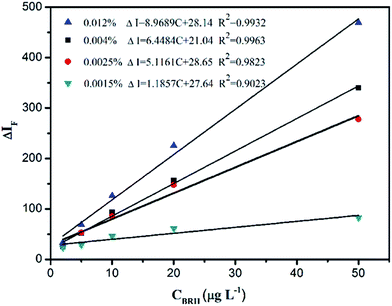 |
| | Fig. 8 Effect of SiO2NPs concentration. Conditions: pH 9.0. | |
3.7. Effect of ionic strength
The influence of ionic strength on the ΔIF value was researched by adding different amounts of NaCl into the SiO2NPs–BRH solutions. As shown in Fig. 9, when the concentration of NaCl was lower than 150 mg L−1, the ΔIF value remained constant. By contrast, when the concentration of NaCl was higher than 150 mg L−1, the ΔIF value reduced as the concentration of NaCl increased. This could be interpreted as the shielding and competing effects of Cl− and Na+ on the binding process between the BRH and SiO2NPs.
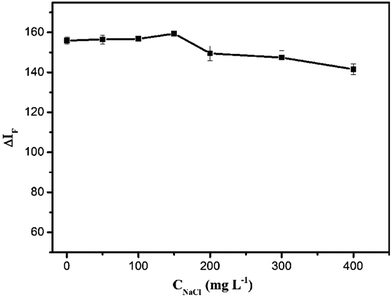 |
| | Fig. 9 Effect of ionic strength. Conditions: SiO2NPs: 0.004%; BRH: 20.0 μg L−1; pH 9.0. | |
3.8. Effect of coexisting ions
Under the optimal experimental conditions, the interference of coexisting ions in the solution was investigated for the determination of BRH. The experiments were carried out by fixing the concentration of BRH at 10.0 μg L−1, and then the fluorescence intensities were recorded before and after addition of coexisting ions to the solution. The permitted relative deviation was less than ±5%. The experimental results are listed in Table 1. Most of the coexisting ions did not interfere with the determination of BRH. Only Mg2+, Ca2+, Co2+, Ni2+ and Cu2+ ions showed interference with the determination of BRH at low concentrations. In order to avoid interference from the metal ions, 1.0 mL of the chelating agent ethylene diamine tetraacetic acid (EDTA; 100.0 mg L−1) was added.
Table 1 Interference of coexisting ions ([BRH] = 10.0 μg L−1)
| Interfering ions |
Concentration (mg L−1) |
Relative error (%) |
Interfering ions |
Concentration (mg L−1) |
Relative error (%) |
| The acceptable concentration of coexisting ions after addition of EDTA. |
| Na+ |
150 |
5.0 |
Co2+ |
0.1, 0.4a |
1.7 |
| K+ |
35 |
3.5 |
Ni2+ |
0.1, 0.4a |
4.1 |
| NH4+ |
30 |
1.1 |
NO3− |
100 |
3.7 |
| Mg2+ |
1, 10a |
3.8 |
SO42− |
100 |
−2.9 |
| Ca2+ |
1.5, 10a |
2.2 |
Cl− |
150 |
5.0 |
| Cu2+ |
0.02, 3a |
2.1 |
SiO32− |
30 |
4.2 |
| Zn2+ |
0.05 |
2.4 |
Sucrose |
300 |
3.1 |
| Mn2+ |
0.8 |
2.6 |
Glucose |
200 |
−1.0 |
| Al3+ |
0.8 |
3.2 |
Tragantine |
80 |
−1.9 |
| Fe3+ |
1 |
4.7 |
Urea |
8 |
5.0 |
| Fe2+ |
1 |
1.7 |
|
|
|
3.9. Working curve and detection limit
According to the general procedure above, when a certain amount of BRH working solution was added, the fluorescence intensities of the solution and reagent blank were measured at 540 nm with an excitation wavelength of 355 nm. As shown in Fig. 10A, the fluorescence intensity increased with an increasing concentration of BRH. There was a good linear relationship (Fig. 10B) between the ΔIF value and the concentration of BRH in the range of 2.0–50.0 μg L−1. The linear equation was ΔIF = 6.4484c + 21.04 (c in μg L−1), with R2 = 0.9963. The relative standard deviation is 1.58% (n = 11). Under the optimal conditions, the limit of detection (LOD; 3σ/k) was 0.73 μg L−1.
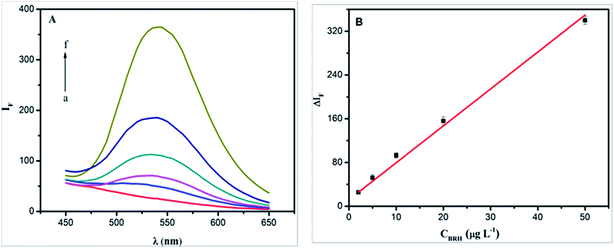 |
| | Fig. 10 The fluorescence spectra of SiO2NPs–BRH (A) and calibration curve for determination of BRH (B). Conditions: SiO2NPs: 0.004%; BRH: (a–f): 0, 2.0, 5.0, 10.0, 20.0, and 50.0 μg L−1; pH 9.0. | |
3.10. Mechanism of reaction
It is well known that BRH is almost nonfluorescent in water, the nonfluorescent behaviour could either due to low lying intramolecular charge transfer state or vibrational coupling of excited state with water molecules, but it fluoresces appreciably when it is dissolved in some organic solvents, or incorporated in cyclodextrins,25,26 calixarenes,27 and cucurbits.38 In the paper, it was found that the fluorescence intensity of BRH was increased in aqueous media with SiO2NPs. In order to further investigate interaction between SiO2NPs and BRH, the zeta potential of the SiO2NPs–BRH solution was measured and the results were shown in Fig. 11. The zeta potential of the SiO2NPs was −42.6 mV because of dissociation of silicon hydroxyl on the surface. The zeta potential move gradually toward zero with the increase in BRH with positive charges. The binding of SiO2NPs with BRH would make the surface of SiO2NPs–BRH aggregates more hydrophobic. The results indicated that the aggregation of SiO2NPs–BRH was the neutralization of charges upon electrostatic interaction and increase of hydrophobicity. The marked enhancement of fluorescence intensity is due to aggregation induced emission enhancement.39–41 A schematic diagram of the possible procedure is presented in Fig. 12.
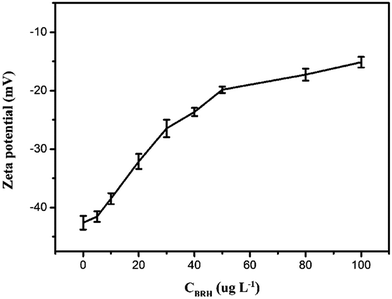 |
| | Fig. 11 Zeta potential curve of SiO2NPs–BRH. Conditions: SiO2NPs: 0.004%; BRH: 0, 5.0, 10.0, 20.0, 30.0, 40.0, 50.0, 80.0 and 100.0 μg L−1; pH 9.0. | |
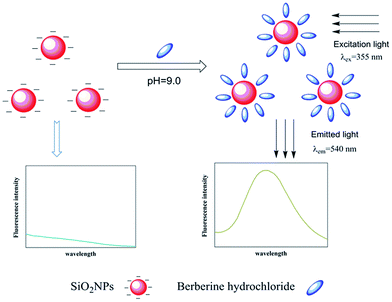 |
| | Fig. 12 Schematic illustration of the possible procedure for the detection of BRH. | |
4. Application
To demonstrate the viability of this method, the developed procedure was used for the determination of BRH in real samples. The reliability and accuracy of the method was proved by recovery tests. The determination of each sample was conducted six times in parallel. The recoveries were between 97.06 and 101.6%. The determination results were compared with the results from the pharmaceutical method42 through a t-test analysis. There was no significant difference between the proposed and standard method under the confidence level of 95%. The results are shown in Table 2.
Table 2 Results of determination of BRH in tablets (n = 6)
| Sample |
Added (μg L−1) |
Founda (μg L−1) |
Recovery (%) |
Pharmaceutical method (mg per piece) |
This method (mg per piece) |
t-Test t0.05,5 = 2.57 |
| Mean ± standard deviation (n = 6). Berberine hydrochloride tablets, Chengdu Jinhua Pharmaceutical Co., Ltd. (Chengdu, China). Compound ancklandia and berberine tablets, Grand Pharmaceutical Huangshi Feiyun Pharmaceutical Co., Ltd. (Hubei, China). Amaranth berberine capsule, Fuzhou Neptunus Jinxiang Chinese Medicine Pharmaceutical Co., Ltd. (Fuzhou, China). |
| 1b |
0 |
18.71 ± 0.309 |
— |
99.50 |
100.4 ± 1.66 |
1.35 |
| 10.0 |
28.54 ± 0.260 |
98.27 ± 2.60 |
— |
— |
— |
| 15.0 |
33.27 ± 0.541 |
97.06 ± 3.60 |
— |
— |
— |
| 2c |
0 |
14.39 ± 0.298 |
— |
49.33 |
50.38 ± 1.04 |
2.46 |
| 10.0 |
24.42 ± 0.258 |
100.3 ± 3.33 |
— |
— |
— |
| 15.0 |
29.63 ± 0.514 |
101.6 ± 3.43 |
— |
— |
— |
| 3d |
0 |
17.06 ± 0.541 |
— |
34.88 |
34.40 ± 1.09 |
1.09 |
| 10.0 |
27.20 ± 0.559 |
101.4 ± 5.54 |
— |
— |
— |
| 15.0 |
31.75 ± 0.545 |
97.94 ± 3.64 |
— |
— |
— |
In addition, this method was also compared with previous methods for BRH determination. The comparison is given in Table 3 and indicates that this method has better sensitivity than most other methods.
Table 3 Comparison of this work with some of other reported methods for BRH determination
| Method |
Probe |
LDRe (μg L−1) |
LOD (μg L−1) |
Ref. |
| Ultraviolet absorption. Resonance Rayleigh scattering. Capillary electrophoresis. Electrochemical analysis. Linear dynamic range. |
| UVa |
— |
118–706.0 |
— |
6 |
| UV |
AuNPs |
240–860 |
60 |
8 |
| HPLC |
— |
50–5.0 × 10⁴ |
10 |
13 |
| RRSb |
AuNPs |
1.33–240.0 |
0.40 |
10 |
| CEc |
Cyclodextrin |
100–13.4 × 10³ |
15.7 |
14 |
| ECd |
— |
58.8–7.06 × 10³ |
32.9 |
15 |
| Fluorescence |
Cucurbit[7]uril |
3.20–2.00 × 10³ |
1.1 |
28 |
| Fluorescence |
Cucurbit[7]uril |
7.43–11.2 × 10³ |
4.2 |
38 |
| Fluorescence |
Cyclodextrin |
12.8–1.00 × 10⁴ |
3.6 |
25 |
| Fluorescence |
Cyclodextrin |
94.1–4.71 × 10³ |
11.8 |
26 |
| Fluorescence |
SiO2NPs |
2.0–50.0 |
0.73 |
This work |
5. Conclusions
This paper describes the development of a simple and novel fluorimetric method based on the increase in the fluorescence intensity of BRH after addition of SiO2NPs. The mechanism of the enhancement of fluorescence intensity has been discussed and the effects of the key experimental parameters on the fluorescence enhancement have also been described in detail. The proposed method allows the direct determination of BRH in aqueous solution with good accuracy, sensitivity, and tolerance. The amount of BRH can be measured without any complicated or time-consuming sample pretreatment processes. Compared with other reported methods, the proposed method is more sensitive, rapid, and environmentally friendly. This method was used for the detection of BRH in actual samples with satisfactory results.
Conflicts of interest
There are no conflicts of interest to declare.
References
- S. Bandyopadhyay, P. H. Patra, A. Mahanti, D. K. Mondal, P. Dandapat, S. Bandyopadhyay, I. Samanta, C. Lodh, A. K. Bera, D. Bhattacharyya, M. Sarkar and K. K. Baruah, Asian Pac. J. Trop. Med., 2013, 6, 315–319 CrossRef CAS PubMed.
- R. Gautam and S. M. Jachak, Med. Res. Rev., 2009, 29, 767–820 CrossRef CAS PubMed.
- L. M. Xia and M. H. Luo, Chronic Dis. Transl. Med., 2015, 1, 231–235 CrossRef PubMed.
- C. M. Tian, X. Jiang, X. X. OuYang, Y. O. Zhang and W. D. Xie, Chin. J. Nat. Med., 2016, 14, 518–526 Search PubMed.
- H. P. Kuo, T. C. Chuang, M. H. Yeh, S. C. Hsu, T. D. Way, P. Y. Chen, S. S. Wang, Y. H. Chang, M. C. Kao and J. Y. Liu, J. Agric. Food Chem., 2011, 59, 8216–8224 CrossRef CAS PubMed.
- T. Sakai, Analyst, 1983, 108, 608–614 RSC.
- T. Sakai, Analyst, 1991, 116, 187–190 RSC.
- Z. W. Hu, M. S. Xie, D. T. Yang, D. Chen, J. Y. Jian, H. B. Li, K. S. Yuan, Z. J. Jiang and H. B. Zhou, RSC Adv., 2017, 7, 34746–34754 RSC.
- X. B. Pang and C. Z. Huang, J. Pharm. Biomed. Anal., 2004, 35, 185–191 CrossRef CAS PubMed.
- S. P. Liu, Z. Yang, Z. F. Liu, J. T. Liu and Y. Shi, Anal. Chim. Acta, 2006, 572, 283–289 CrossRef CAS PubMed.
- P. Biparva, S. M. Abedirad, S. Y. Kazemi and M. Shanehsaz, Sens. Actuators, B, 2016, 234, 278–285 CrossRef CAS.
- G. H. Liu, W. He, H. Cai, X. M. Sun, W. E. Hou, M. N. Lin, Z. Y. Xie and Q. F. Liao, Anal. Methods, 2014, 6, 2998–3008 RSC.
- P. L. Tsai and T. H. Tsai, J. Chromatogr. A, 2002, 961, 125–130 CrossRef CAS PubMed.
- S. Uzasci and F. B. Erim, J. Chromatogr. A, 2014, 1338, 184–187 CrossRef CAS PubMed.
- A. Geto, M. Pita, A. L. De Lacey, M. Tessema and S. Admassie, Sens. Actuators, B, 2013, 183, 96–101 CrossRef CAS.
- J. F. Song, Y. Y. He and W. Guo, J. Pharm. Biomed. Anal., 2002, 28, 355–363 CrossRef CAS PubMed.
- H. M. Al-Saidi and M. S. El-Shahawi, Spectrochim. Acta, Part A, 2015, 138, 736–742 CrossRef CAS PubMed.
- J. R. Bi, H. T. Wang, T. Kamal, B. W. Zhu and M. Q. Tan, RSC Adv., 2017, 7, 30481–30487 RSC.
- G. Q. Gong, Z. X. Zong and Y. M. Song, Spectrochim. Acta, Part A, 1999, 55, 1903–1907 CrossRef.
- M. X. Gao, J. L. Xu, Y. F. Li and C. Z. Huang, Anal. Methods, 2013, 5, 673–677 RSC.
- Y. Y. Liu, H. C. Li, B. Guo, L. J. Wei, B. Chen and Y. Y. Zhang, Biosens. Bioelectron., 2017, 91, 734–740 CrossRef CAS PubMed.
- P. J. Ni, Y. J. Sun, S. Jiang, W. D. Lu, Y. L. Wang and Z. Li, Sens. Actuators, B, 2017, 240, 651–656 CrossRef CAS.
- X. Y. Zheng, T. M. Yao, Y. Zhu and S. Shi, Biosens. Bioelectron., 2015, 66, 103–108 CrossRef CAS PubMed.
- S. Liang, Y. F. Kuang, F. F. Ma, S. Chen and Y. F. Long, Biosens. Bioelectron., 2016, 85, 758–763 CrossRef CAS PubMed.
- F. Liu, H. L. Liang, K. H. Xu, L. L. Tong and B. Tang, Talanta, 2007, 74, 140–145 CrossRef CAS PubMed.
- Y. Yang, X. Yang, C. X. Jiao, H. F. Yang, Z. M. Liu, G. L. Shen and R. Q. Yu, Anal. Chim. Acta, 2004, 513, 385–392 CrossRef CAS.
- M. Megyesi and L. Biczok, Chem. Phys. Lett., 2006, 424, 71–76 CrossRef CAS.
- Y. P. Li, H. Wu and L. M. Du, Chin. Chem. Lett., 2009, 20, 322–325 CrossRef CAS.
- K. A. Connors, Chem. Rev., 1997, 97, 1325–1357 CrossRef CAS PubMed.
- I. Miletto, A. Gilardino, P. Zamburlin, S. Dalmazzo, D. Lovisolo, G. Caputo, G. Viscardi and G. Martra, Dyes Pigm., 2010, 84, 121–127 CrossRef CAS.
- S. Liang, K. Shephard, D. T. Pierce and X. J. Zhao, Nanoscale, 2013, 5, 9365–9373 RSC.
- A. Hemadi, A. Ekrami, H. Oormazdi, A. R. Meamar, L. Akhlaghi, A. R. Samarbaf-Zadeh and E. Razmjou, Acta Trop., 2015, 145, 26–30 CrossRef CAS PubMed.
- M. Qhobosheane, S. Santra, P. Zhang and W. H. Tan, Analyst, 2001, 126, 1274–1278 RSC.
- K. Abnous, N. M. Danesh, A. S. Emrani, M. Ramezani and S. M. Taghdisi, Anal. Chim. Acta, 2016, 917, 71–78 CrossRef CAS PubMed.
- A. S. Emrani, S. M. Taghdisi, N. M. Danesh, S. H. Jalalian, M. Ramezani and K. Abnous, Anal. Methods, 2015, 7, 3814–3818 RSC.
- J. Fan, Z. H. Xie, X. X. Teng and Y. Zhang, Chin. Chem. Lett., 2017, 28, 1104–1110 CrossRef CAS.
- M. Megyesi and L. Biczók, J. Phys. Chem. B, 2007, 111, 5635–5639 CrossRef CAS PubMed.
- N. Dong, L. N. Cheng, X. L. Wang, Q. Li, C. Y. Dai and Z. Tao, Talanta, 2011, 84, 684–689 CrossRef CAS PubMed.
- A. Gopi, A. Vindhyasarumi and K. Yoosaf, RSC Adv., 2015, 5, 47813–47819 RSC.
- C. J. Kassl and F. C. Pigge, Tetrahedron Lett., 2014, 55, 4810–4813 CrossRef CAS.
- F. Qiao, L. Zhang, Z. Lian, Z. Yuan, C. Y. Yan, S. P. Zhuo and Z. Y. Zhou, J. Photochem. Photobiol., A, 2017 DOI:10.1016/j.jphotochem.2017.07.024.
- The Pharmacopeia Committee of Ministry of Health PR China, The Pharmacopeia of PR China, China medical science Press, Beijing, 2nd edn, 2015, p. 875 Search PubMed.
|
| This journal is © The Royal Society of Chemistry 2018 |
Click here to see how this site uses Cookies. View our privacy policy here.  Open Access Article
 ,
Zhihai Xie*,
Tao Liu
 and
Jin Fan


