 Open Access Article
Label-free identification carbapenem-resistant Escherichia coli based on surface-enhanced resonance Raman scattering†
Jia Li‡
a,
Chongwen Wang‡ bc,
Haiquan Kangac,
Liting Shaob,
Lulu Hua,
Rui Xiao*b,
Shengqi Wang*ab and
Bing Gu*ac
aMedical Technology Institute of Xuzhou Medical University, Xuzhou 221004, PR China. E-mail: sqwang@bmi.ac.cn
bBeijing Institute of Radiation Medicine, Beijing 100850, PR China. E-mail: ruixiao203@sina.com
cDepartment of Laboratory Medicine, Affiliated Hospital of Xuzhou Medical University, Xuzhou 221004, PR China. E-mail: gb20031129@163.com
First published on 26th January 2018
Abstract
In this study, a surface-enhanced resonance Raman scattering (SERRS) method has been developed for the accurate detection and identification of carbapenem-resistant and carbapenem-sensitive Escherichia coli. A total of 89 human isolates of Enterobacteriaceae, comprising 41 strains of carbapenem-sensitive E. coli (CSEC) and 48 strains of carbapenem-resistant E. coli (CREC), were tested to assess the feasibility of our proposed SERRS method as a clinical tool, and the results showed almost 100% accuracy.
Extensive and non-standard use of antibiotics has led to clinical antimicrobial drug resistance, which has become one of the foremost threats to human health in the last decades.1 This drug resistance is responsible for 1.8 million deaths each year worldwide.2 The emergence and spread of carbapenem-resistant Escherichia coli (CREC) is particularly becoming a serious problem, because it is the pathogen responsible for difficult-to-treat and some untreatable infections among hospitalized patients.3,4 Many studies indicated that carbapenem resistance in Escherichia coli (E. coli) is mainly caused by plasmid-encoded carbapenemases.5 Rapid and accurate identification of CREC is crucial for selecting proper antibiotic treatment and reducing the death rate of patients.
The current gold standard methods for detecting pathogenic bacteria are microbial culture-based tests, which are mainly based on phenotypic characteristics.6,7 These methods require at least 24 h for bacteria growth and biochemical characterization and an additional 24–72 h following antibiotic susceptibility testing. As alternative, some nucleic acid-based methods (polymerase chain reaction and DNA sequencing) and protein-based methods (matrix-assisted laser desorption ionization-time of flight mass spectrometry) have been developed for rapid bacteria detection.8,9 However, these methods also involve tedious procedures, bulky sophisticated instruments, and skilled personnel, thereby limiting their widespread application to point-of-care diagnosis.
Surface-enhanced Raman scattering (SERS) has been shown to be a powerful and promising tool in bacteria identification because of its high sensitivity, simple preparation, high speed, comparatively low cost, and portability.10,11 Several pathogenic species have been identified by SERS, such as Klebsiella pneumoniae,12 E. coli,13 Pseudomonas aeruginosa,14 Acinetobacter baumannii,15 Salmonella enterica,16 Staphylococcus aureus,17 and Lactobacillus plantarum.18 The growth of media-cultured clinical isolates can be distinguished by their SERS-fingerprinting spectra when combined with multivariate data analysis procedures. The major vibrational bands of the observed bacterial spectra are attributed to the entire structure of the organism, such as nucleic acids, protein, lipids, and carbohydrates.19 Due to drug-resistant and sensitive strains of bacteria have similar components, thus using the SERS technique to distinguish drug-resistant bacterial pathogens has been scarcely reported.
Herein, we reported a surface-enhanced resonance Raman scattering (SERRS) methods for accurate identification of CREC and carbapenem-sensitive Escherichia coli (CSEC) based on the use of plasmonic silver-coated gold nanorods (Au@Ag NRs). Given that the plasmon peak of Au@Ag NRs at 785 nm matches the excitation wavelength of the laser, the sensitivity of Raman scattering spectroscopy arises from the resonance enhancement effect,20–22 thus leading to a high resolution and informative characteristic spectra of detection bacteria. We performed a label-free SERS test on 89 E. coli samples including 41 strains of CSEC and 48 CREC by mixing Au@Ag NRs with bacteria directly. High-quality SERS spectra from all bacteria samples were acquired and analyzed using the orthogonal partial least squares discriminant analysis (OPLS-DA) algorithm. This method can accurately distinguished CREC and CSEC. As far as we know, this study is the first to use plasmonic Au@Ag NRs as SERRS substrate to achieve bacteria-sensitive detection. We believe this method indicated a new route in field applications for rapid diagnosis of drug-resistant bacterial pathogens.
All 89 strains included in this study had been prospectively collected from Affiliated Hospital of Xuzhou Medical University, and they have been identified using VITEK2 COMPACT high intelligent automatic microbial identification system (bioMérieux, La Balme-les-Grottes, France). Carbapenem resistance was defined according to the Clinical and Laboratory Standards Institute breakpoint criteria (CLSI M100, S27). Table S1† provides the bacteria sample information.
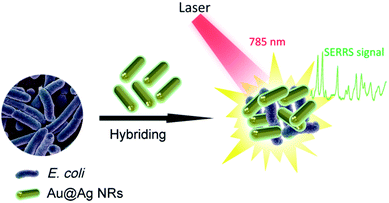
Fig. 1 shows the operating principle of the SERRS method for bacteria detection. The bacteria were mixed with Au@Ag NRs directly, and the mixture was excited by a portable Raman system with a 785 nm laser. The representative Raman fingerprinting spectra of the bacteria can be directly obtained by bringing the bacterial cell near the plasmonic Au@Ag NRs. In a typical experiment, the clinical isolation bacterial strains were cultured and grew on Columbia agar supplemented with 5% horse blood (bioMérieux, La Balme-les-Grottes, France) for 10 h. The selected colony was collected using a 1 μL sterile inoculating loop and suspended in 10 μL distilled water. Then, we mixed 5 μL of concentrated Au@Ag NRs (10-fold) with 5 μL of bacterial suspension (approximately 1 × 10⁸ cells per mL), and the mixture was pipetted on top of a clean Si substrate prior to detection. After quick drying in air, SERS signals were recorded with a portable Raman system. In measuring the Raman spectra, the accumulation time was set at 10 s, and the incident power was set at 20% of the laser power. Fig. S1a in the ESI† shows the representative patterns of E. coli samples prepared on the SERS substrates. The ring zone was selected at the ideal position to screen bacteria samples considering the coffee-ring effect of colloid SERS substrates (Fig. S1b†).23,24 Relatively uniform SERS spectra of E. coli isolates recorded from 20 different spots on the ring zone were measurable, as shown in Fig. S1c.† The relative standard deviation (RSD) of Raman intensity was 10.3%, thereby indicating the good reproducibility of this method.
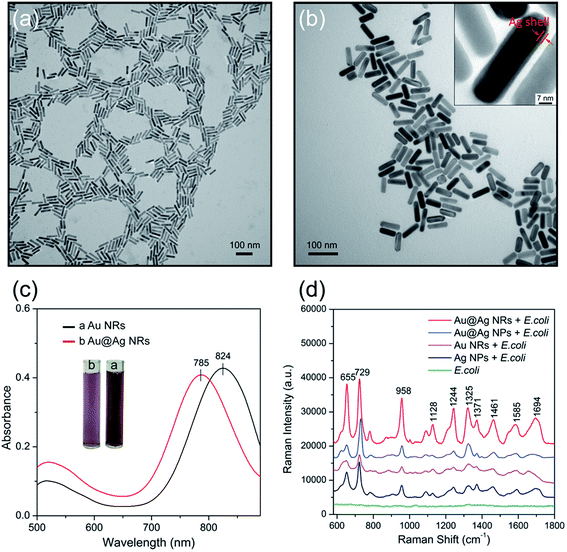
Here, the Au@Ag NRs were utilized as SERRS substrates to obtain high-resolution fingerprint spectrum. Compared with the commonly used Au or Ag colloids, the Au@Ag NRs have two advantages: (i) the plasmon peak that matches the Raman excitation wavelength (785 nm) produced the strongest plasmonic coupling effect and (ii) the higher efficiency of Ag shells in comparison with Au NRs. We have synthesized Au@Ag NRs with longitudinal plasmon resonance peak located at 785 nm by the in situ growth of Ag shells on the surface of Au nanorods, as reported previously.25,26 Experimental section in the ESI† presents the detailed fabrication process. The transmission electron microscopy (TEM) images in Fig. 2a and b show the characteristic structures of Au NRs and Au@Ag NRs, respectively. The as-prepared Au NRs are uniform in shape and size with dimensions of approximately 70 nm × 17 nm, with an aspect ratio of 4.1. The thickness of the Ag shell can easily be controlled by varying the volumes of AgNO3 and ascorbic acid, which makes the LSPR of Au@Ag NRs tunable for obtaining maximum SERS signals at a given excited wavelength (785 nm). After Ag shell encapsulation, the length and width of the resulting Au@Ag NRs are increased to 72 nm and 19 nm, respectively. The core–shell structure could be clearly seen in the inset of Fig. 2b, and the Ag shell thickness was approximately 2 nm. The characteristic UV-vis plasmon peak of the Au NRs is at 824 nm, as shown in Fig. 2c (black line). After Ag shell coating, the plasmon peak blue shifted to 785 nm because of the reduced aspect ratio and Au–Ag plasmon coupling.27
Subsequently, the SERS activity of Au NRs, Au@Ag NRs, Au@Ag core–shell nanoparticles (Au@Ag NPs) and commonly used Ag NPs was tested. Fig. S2 and S3 in the ESI† show the TEM images and UV-visible absorbance spectroscopy of the Ag NPs and Au@Ag NPs, respectively. These prepared nanoparticles were mixed with 5 μL E. coil sample first, and the mixtures were then dropped on the silicon chip and dried at room temperature for SERS measurement. Fig. 2d shows the recorded the SERS spectra, and the major vibrational modes of E. coli can be observed as enhanced by four kinds of nanoparticles. The typical Raman peaks at 655, 729, 958, 1244, 1325, 1371, 1461, 1585, and 1694 cm−1 were observed and well confirmed by previous reports categorized in Table 1.11,29 Obviously, the SERS signal of the Au@Ag NRs (red spectrum), whose plasmon peak was adjusted to match the given laser excitation wavelength (785 nm), was approximately 4.5 times that of Au NRs (purple spectrum), and twice that of Ag NPs (black spectrum). Moreover, we found that the SERS spectrum of bacteria sample mixed with Au@Ag NRs has more Raman peaks that can provide more fingerprint information for bacterium identification. To further corroborate the relationship between the SERRS activity and particle morphology, we used Au@Ag NPs as more persuasive control samples to assess the SERS performance of Au@Ag NRs under 785 nm excitation. It can be roughly estimated that the SERS ability of the Au@Ag NRs is enhanced by at least 1.5 times compared with the spherical Au@Ag NPs from Fig. 2d. These results demonstrate that the superior SERS performance of the Au@Ag NRs is simultaneously coming from the plasmonic coupling effect and Ag shell, which is in good agreement with other reported results.31–33
| Raman shift/cm−1 | Component | Band assignments |
|---|---|---|
| a Approximate description of the modes (ν, stretch; δ, bend). | ||
| 655 | Amino acids | δ(COO–) |
| 729 | DNA | Adenine, glycosidic ring mode |
| 958 | Proteins | ν(CN) |
| 1040 | Proteins | CC ring breathing |
| 1128 | Nucleic acids | ν(COC), ring breathing |
| 1242 | Proteins | Amide III |
| 1325 | Proteins | ν(NH2) adenine, polyadenine |
| 1371 | DNA/RNA | Ring breathing (T/A/G) |
| 1461 | Lipids | δ(CH2) |
| 1585 | Proteins | Phe, amide II |
| 1694 | Proteins | Amide I |
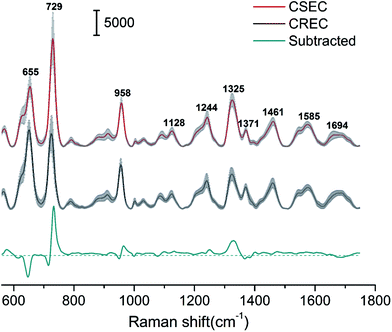
Using Au@Ag NRs as SERRS substrate, we have successfully acquired high-quality SERS spectra from 89 Enterobacteriaceae isolates of human (41 strains of CSEC and 48 strains of CREC). Fig. 3 shows a comparison of the normalized mean SERS spectra obtained from CSEC and CREC samples. The red and black lines were obtained from the 41 strains of CSEC and 48 strains of CREC, respectively, and the blue line was the normalized subtracted SERS spectrum between the two groups. The positions of all the major peaks of CSEC and CREC are very similar because the two bacteria belong to a single species, but the relative intensities of the vibrational peaks showed some differences. For example, important spectral differences in the bands near 655, 729, 958, and 1325 cm−1 can be clearly distinguished; these differences correspond to bands assigned to amino acids, nucleic acid, and proteins.34,35 The resistance mechanism of CREC results from the combination of extended-spectrum β-lactamase production, cephalosporinase overexpression, and/or porin deficiency. Most of these are caused by plasmid-encoded carbapenemases, a form of β-lactamase that hydrolyzes the β-lactam ring, which is an essential component of β-lactam antibiotics such as cephalosporins and carbapenem.36,37 Moreover, the resistant plasmids could be transferred through conjugation and may change the components of the cell wall such as membrane protein and lipopolysaccharide. Thus, the differences of the SERS spectra of CSEC and CREC could be ascribed to the changes of bacterial plasmid and cell wall components. This condition allows fingerprinting potential for bacteria identification and drug resistance detection.
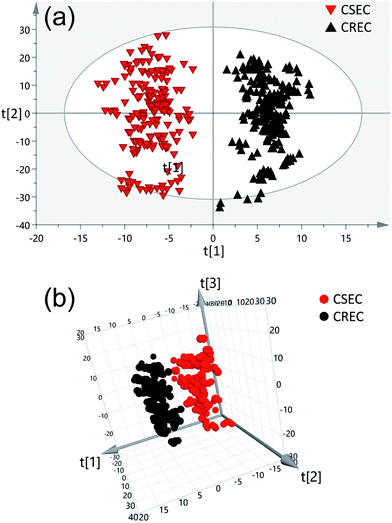
OPLS-DA was performed to further differentiate the bacterial strains based on the SERS spectra, which can provide an accurate and intuitive view of the differences in fingerprint.38 The OPLS-DA was performed in the entire spectral region between 550 and 1700 cm−1 for all examined bacterial stains based on SIMCA 14.0 software (Umetrics, Umea, Sweden). Raman spectral data were preprocessed by removing the autofluorescence background and were smoothened and normalized with Bwspec4 (B&W Tek). Fig. 4a shows the 2D OPLS score plots of the bacteria SERS spectra for CSEC and CREC samples. The model was generated using 89 E. coli stains (41 stains for CSEC and 48 stains for CREC). We conducted five measurements for each of the samples, and all spectra were used to analyze. Data points are clustered into two completely separated groups without overlap, indicating that the SERS spectra of the CSEC and CREC samples can be clearly distinguished. The ellipse is expressed as 95% confidence interval, and the 2D scatter plot of the first two principal components with the largest explain the variance which accounts for 67.7% of the total. Moreover, the differences among the CSEC and CREC can clearly be illustrated by the loading 3D plots presented in Fig. 4b. The three principal components are the most diagnostically significant, which explains the 47.3%, 20.4%, and 15.9% of the variance in the analyzed dataset.
 | ||
| Fig. 4 The 2D OPLS score plots (a) and 3D OPLS score plots (b) of the SERS spectrum for CSEC (red, n = 41 × 5) and CREC (black, n = 48 × 5). | ||
Furthermore, 10-fold cross-validation was applied to estimate the classification efficiency of our method.39,40 In brief, the spectrum data of all bacteria samples were divided into 10 subgroups randomly, and each subgroup (test set) was tested by a training set model built with the remaining nine subgroups. Then, the average accuracy rates of the training and test sets were obtained after 10 operations. The average accuracy rates of the training and test sets are 100% and 99.43%, respectively, thereby indicating the excellent accuracy of the OPLS-DA model (Table S2†). These results proved that the proposed SERRS methods combined with OPLS-DA analysis are a powerful tool to identify CSEC and CREC based on label-free SERS spectra.
In summary, we presented an efficient SERRS method to identify CSEC and CREC. We detected the SERS signals of 41 strains of CSEC and 48 strains of CREC using plasmonic Au@Ag NRs as SERRS substrate and analyzed the SERS spectra with OPLS-DA. Results show that the proposed method has almost 100% accuracy rate for CSEC and CREC identification. This is the first study to confirm that SERRS can potentially be used for rapid and accurate detection of drug-resistant bacterial pathogens.
Conflicts of interest
The authors report no conflicts of interest in this work.Acknowledgements
This research was supported by the National Natural Science Foundation of China (81471994), Jiangsu Provincial Medical Talent (ZDRCA2016053), Six talent peaks project of Jiangsu Province (WSN-135), Advanced health talent of six-one project of Jiangsu Province (LGY2016042). Authors Jia Li and Chongwen Wang contributed equally.References
- J. Chen, S. M. Andler, J. M. Goddard, S. R. Nugen and V. M. Rotello, Chem. Soc. Rev., 2017, 46, 1272–1283 RSC
.
- H. Wang, Y. Zhou, X. Jiang, B. Sun, Y. Zhu, H. Wang, Y. Su and Y. He, Angew. Chem., Int. Ed., 2015, 54, 5132–5136 CrossRef CAS PubMed
.
- R. Zhang, L. Liu, H. Zhou, E. W. Chan, J. Li, Y. Fang, Y. Li, K. Liao and S. Chen, EBioMedicine, 2017, 19, 98–106 CrossRef PubMed
.
- Z. Shi, H. Zhao, G. Li and W. Jia, Front. Microb., 2017, 8, 94 Search PubMed
.
- Y.-T. Wang, Y. Sugawara, Y. Akeda, N. Sakamoto, D. Takeuchi, D. Motooka, S. Nakamura, H. Hagiya, N. Yamamoto, I. Nishi, H. Yoshida, K. Okada, K. N. Zin, M. M. Aye, K. Tonomo and S. Hamada, PLoS One, 2017, 12, e0184720 Search PubMed
.
- T. D. Lee, K. Adie, A. McNabb, D. Purych, K. Mannan, R. Azana, C. Ng, P. Tang and L. M. Hoang, J. Clin. Microbiol., 2015, 53, 2731–2733 CrossRef CAS PubMed
.
- W. T. Fan, T. T. Qin, R. R. Bi, H. Q. Kang, P. Ma and B. Gu, J. Clin. Microbiol., 2017, 36, 1005–1012 CrossRef CAS PubMed
.
- C. Y. Liu, Y. Y. Han, P. H. Shih, W. N. Lian, H. H. Wang, C. H. Lin, P. R. Hsueh, J. K. Wang and Y. L. Wang, Sci. Rep., 2016, 6, 23375 CrossRef CAS PubMed
.
- C. Wang, J. Wang, M. Li, X. Qu, K. Zhang, Z. Rong, R. Xiao and S. Wang, Analyst, 2016, 141, 6226–6238 RSC
.
- J. F. Li, Y. F. Huang, Y. Ding, Z. L. Yang, S. B. Li, X. S. Zhou, F. R. Fan, W. Zhang, Z. Y. Zhou, Y. Wu de, B. Ren, Z. L. Wang and Z. Q. Tian, Nature, 2010, 464, 392–395 CrossRef CAS PubMed
.
- Y. Liu, H. Zhou, Z. Hu, G. Yu, D. Yang and J. Zhao, Biosens. Bioelectron., 2017, 94, 131–140 CrossRef CAS PubMed
.
- W. R. Premasiri, Y. Chen, P. M. Williamson, D. C. Bandarage, C. Pyles and L. D. Ziegler, Anal. Bioanal. Chem., 2017, 11, 3043–3053 CrossRef PubMed
.
- H. Zhou, D. Yang, N. P. Ivleva, N. E. Mircescu, R. Niessner and C. Haisch, Anal. Chem., 2014, 86, 1525–1533 CrossRef CAS PubMed
.
- X. Wu, Y. W. Huang, B. Park, R. A. Tripp and Y. Zhao, Talanta, 2015, 139, 96–103 CrossRef CAS PubMed
.
- W. R. Premasiri, J. C. Lee, A. Sauer-Budge, R. Théberge, C. E. Costello and L. D. Ziegler, Anal. Bioanal. Chem., 2016, 408, 4631–4647 CrossRef CAS PubMed
.
- J. Sundaram, B. Park, A. Hinton, K. C. Lawrence and Y. Kwon, J. Food Meas. Charact., 2013, 7, 1–12 CrossRef
.
- C. Wang, J. Wang, P. Li, Z. Rong, X. Jia, Q. Ma, R. Xiao and S. Wang, Nanoscale, 2016, 8, 19816–19828 RSC
.
- T. Y. Liu, K. T. Tsai, H. H. Wang, Y. Chen, Y. H. Chen, Y. C. Chao, H. H. Chang, C. H. Lin, J. K. Wang and Y. L. Wang, Nat. Commun., 2011, 2, 538 CrossRef PubMed
.
- R. M. Jarvis and R. Goodacre, Chem. Soc. Rev., 2008, 37, 931–936 RSC
.
- S. Schlucker, Angew. Chem., Int. Ed., 2014, 53, 4756–4795 CrossRef PubMed
.
- L. Blanco-Covian, V. Montes-Garcia, A. Girard, M. T. Fernandez-Abedul, J. Perez-Juste, I. Pastoriza-Santos, K. Faulds, D. Graham and M. C. Blanco-Lopez, Nanoscale, 2017, 9, 2051–2058 RSC
.
- A. Hakonen, P. O. Andersson, M. Stenbaek Schmidt, T. Rindzevicius and M. Kall, Anal. Chim. Acta, 2015, 893, 1–13 CrossRef CAS PubMed
.
- A. Chen, A. E. DePrince III, A. Demortiere, A. Joshi-Imre, E. V. Shevchenko, S. K. Gray, U. Welp and V. K. Vlasko-Vlasov, Small, 2011, 7, 2365–2371 CrossRef CAS PubMed
.
- Y. Cheong, Y. Jin Kim, H. Kang, S. Choi and H. Joo Lee, Microsc. Res. Tech., 2017, 80, 177–182 CrossRef CAS PubMed
.
- R. Xiao, C. W. Wang, A. N. Zhu and F. Long, Biosens. Bioelectron., 2016, 79, 661–668 CrossRef CAS PubMed
.
- J. Wang, X. Wu, C. Wang, N. Shao, P. Dong, R. Xiao and S. Wang, ACS Appl. Mater. Interfaces, 2015, 7, 20919–20929 CAS
.
- Y. Bai, C. Gao and Y. Yin, Nanoscale, 2017, 9, 14875–14880 RSC
.
- W. Wang, V. Hynninen, L. Qiu, A. Zhang, T. Lemma, N. Zhang, H. Ge, J. J. Toppari, V. P. Hytönen and J. Wang, Sens. Actuators, B, 2017, 239, 515–525 CrossRef CAS
.
- T. Lemma, A. Saliniemi, V. Hynninen, V. P. Hytönen and J. J. Toppari, Vib. Spectrosc., 2016, 83, 36–45 CrossRef CAS
.
- A. Walter, A. Marz, W. Schumacher, P. Rosch and J. Popp, Lab Chip, 2011, 11, 1013–1021 RSC
.
- B. Xiong, R. Zhou, J. Hao, Y. Jia, Y. He and E. S. Yeung, Nat. Commun., 2013, 4, 1708 CrossRef PubMed
.
- T. Bai, J. Sun, R. Che, L. Xu, C. Yin, Z. Guo and N. Gu, ACS Appl. Mater. Interfaces, 2014, 6, 3331–3340 CAS
.
- K.-K. Liu, S. Tadepalli, G. Kumari, P. Banerjee, L. Tian, P. K. Jain and S. Singamaneni, J. Phys. Chem. C, 2016, 120, 16899–16906 CAS
.
- P. A. Mosier-Boss, K. C. Sorensen, R. D. George and A. Obraztsova, Spectrochim. Acta, Part A, 2016, 153, 591–598 CrossRef CAS PubMed
.
- S. Preciado-Flores, D. A. Wheeler, T. M. Tran, Z. Tanaka, C. Jiang, M. Barboza-Flores, F. Qian, Y. Li, B. Chen and J. Z. Zhang, Chem. Commun., 2011, 47, 4129–4131 RSC
.
- Y. Sugawara, Y. Akeda, N. Sakamoto, D. Takeuchi, D. Motooka, S. Nakamura, H. Hagiya, N. Yamamoto, I. Nishi, H. Yoshida, K. Okada, K. N. Zin, M. M. Aye, K. Tonomo and S. Hamada, PLoS One, 2017, 12, e0184720 Search PubMed
.
- E. De Carolis, S. Paoletti, D. Nagel, A. Vella, E. Mello, I. Palucci, G. De Angelis, T. D'Inzeo, M. Sanguinetti, B. Posteraro and T. Spanu, PLoS One, 2017, 12, e0185935 Search PubMed
.
- R. Xiao, X. Zhang, Z. Rong, B. Xiu, X. Yang, C. Wang, W. Hao, Q. Zhang, Z. Liu, C. Duan, K. Zhao, X. Guo, Y. Fan, Y. Zhao, H. Johnson, Y. Huang, X. Feng, X. Xu, H. Zhang and S. Wang, Nanomedicine, 2016, 12, 2475–2484 CrossRef CAS PubMed
.
- M. M. Abbas, M. M. Mohie-Eldin and Y. El-Manzalawy, PLoS One, 2015, 10, e0119721 Search PubMed
.
- R. M. Simon, J. Subramanian, M. C. Li and S. Menezes, Briefings Bioinf., 2011, 12, 203–214 CrossRef PubMed
.
Footnotes |
| † Electronic supplementary information (ESI) available. See DOI: 10.1039/c7ra13063e |
| ‡ These authors contributed equally to this work. |
| This journal is © The Royal Society of Chemistry 2018 |


