 Open Access Article
Phase-shifted paclitaxel-loaded multifunctional contrast agent for US/MR imaging and synergistic hyperthermal/chemotherapy of metastasis in lymph nodes
Kui Tanga,
Chengcheng Niu *a,
Yan Xua,
Yun Zhua,
Shixiong Tangb,
Meixiang Zhanga and
Qichang Zhou*a
aDepartment of Ultrasound Diagnosis, The Second Xiangya Hospital, Central South University, Changsha, Hunan 410011, China. E-mail: niuchengcheng@csu.edu.cn; zhouqc@csu.edu.cn
bDepartment of Radiology, The Second Xiangya Hospital, Central South University, Changsha, Hunan 410011, China
First published on 31st January 2018
Abstract
The existing approaches used to detect a tumor-induced sentinel lymph node and treat metastasis have limitations. In this study, by encapsulating perfluoropentane (PFP), magnetic iron oxide nanoparticles (Fe3O4) and the chemotherapy drug paclitaxel (PTX), we fabricated novel polymer nanoparticles (NPNs) that can effectively absorb heat after irradiation by near-infrared irradiation (NIR), thereby synergistically enhancing tumor therapy via a phase-shift thermoelastic expansion effect. These NPNs can be used for dual-modal ultrasound (US) and magnetic resonance (MR) imaging and to treat metastasis in lymph nodes under NIR irradiation-triggered drug delivery. The enhancement of US/MR imaging proved effective in vitro and in vivo, and NIR irradiation proved valid, promoting PTX release at the target site. A lower proliferation index and density and a higher tumor cell apoptotic index in the histopathology results confirmed the effectiveness of NPN chemotherapy for lymph nodes.
1. Introduction
As the main component of the immune system, the lymphatic system plays an important part in draining extra fluids, proteins and waste products into the vascular system from the extracellular space. Consequently, the lymphatic system could spread cancer cells and may also induce the dissemination of infection.1 Therefore, clear visualization of the lymphatic system is particularly important. However, the existing lymphatic imaging methods have exhibited many limitations (i.e., weak sensitivity and poor resolution) when visible dyes and radioisotope tracers are used.2 Furthermore, current methods to deliver drugs to the tumor site through the lymphatic system have failed due to the constraints and retardation of drug target integration technology.3 To solve this problem, a new method that could clearly display and deliver drugs to the lymphatic system is urgently needed.With the development of medical technology, much effort has been exerted to develop a new method to successfully deliver chemotherapy drugs tailored for delivery through the lymphatic system, such as targeted drugs, nanobiotechnology, and micro-molecule organic polymer conjugation.1,4 Lu et al. reported paclitaxel (PTX) loaded polymeric nanoparticles significantly reduced rats tumor weight and ascites volume, and induced apoptosis of tumor cells as compared with pure PTX. The paclitaxel concentration of pelvic lymph nodes in nanoparticles treated animals was 20-fold higher than that of free PTX treated animals at 48 h after intraperitoneal administration.5 These results indicated that PTX-loaded nanoparticles could sustainably release PTX, resulting in increased accumulation of PTX in tumors and tumor lymph nodes and prolonged persistence in the blood.
Importantly, polymeric nanoparticles can be used not only as therapeutic agents for drug delivery systems, but also as the contrast agents for lymphatic imaging. Our research group has developed polymeric ultrasonographic contrast agent poly(lactide-co-glycolide) (PLGA) for lymph nodes localization several years.6–8 ICG loaded PLGA microbubbles could be used as a tool for near-infrared fluorescence (NIRF) imaging and ultrasound (US) of lymph nodes, which improved the photo-stability of ICG and prolonged its retention time in the SLN under physiological conditions.6 Sudan black B carried PLGA microbubbles could be used for preoperative and intraoperative localization of lymph nodes as well as for ultrasonographically guided core needle biopsy of lymph nodes.7 A doxorubicin loaded superparamagnetic PLGA-iron oxide multifunctional theranostic agent used for dual-mode US/magnetic resonance (MR) imaging of lymph nodes, and for low frequency US triggered therapy of metastasis in lymph nodes, which might provide a strategy for the imaging and chemotherapy of primary tumor and their metastases.8
Iron oxide (Fe3O4) nanoparticles have been widely used in biomedical research for MR imaging.9 It is noteworthy that our research group and other research groups reported that microbubbles loaded with Fe3O4 nanoparticles exhibited advantages such as better contrast for US imaging and an increased transversal relaxation rate in MR.8,10,11 Furthermore, our research group and Zhao et al. reported Fe3O4 nanoparticles could be employed for hyperthermia therapy (HTT), which applied localized thermal energy to burn cancer cells that resulted in cell protein denaturation and coagulation necrosis.12,13 In these studies, perfluorocarbon (PFC) liquid droplets, which could produce excellent ultrasound imaging contrast by transforming from a liquid to gas state via acoustic or optical vaporization,14,15 were instead of gas encapsulated microbubbles as ultrasound contrast agents. Rapoport et al. reported phase-shift PFC nanoemulsions combined properties of polymeric drug carriers, ultrasound imaging contrast agents, and enhancers of ultrasound-mediated drug delivery. For drug-loaded PFC nanoemulsions, microbubbles are formed by ultrasound activated vaporization and drug is released locally into tumor region in this process.16–18 The most used phase-shift liquid core is perfluoropentane (PFP) with a boiling point of approximately 29 °C. The PFP nanodroplets easily convert into nano and/or microbubbles upon heating to physiological temperatures.12,15,16
Near-infrared (NIR) refers to electromagnetic radiation in the region between 780 and 2526 nm. NIR light has the characteristics of controllable radiation scope, high penetration of cancer tissue without obvious damage to the surrounding normal tissues and organs and can potentially be used to treat tumors without surgical resection. NIR irradiation is a simple procedure with high repeatability. Zhao et al. used an NIR experiment to trigger the phase transition of Fe3O4 and PFC included nanocapsules and demonstrated that NIR could effectively promote the phase transition with an increased irradiation time and temperature, especially when the temperature was 50 °C.13 Xu et al. fabricated a thermal-sensitive Fe3O4 and PFC loaded nanotheranostic agent, which effectively absorbs heat to achieve HTT in response to NIR irradiation, synergistically enhancing tumor therapy via a phase-shift thermoelastic expansion effect, and can be used as a dual-modal contrast agent for US/MR imaging guided HTT.12 Therefore, Fe3O4 nanoparticles in contrast agent could absorb the energy of NIR irradiation, promote the phase transition of PFC and trigger drug release at the target site.
In this study, we developed a novel polymer nanoparticles (NPNs), which encapsulated PTX, PFP and Fe3O4 nanoparticles for dual-modal US/MR imaging of lymph node and treatment of metastasis in lymph nodes under NIR irradiation triggered drug delivery.
2. Materials and methods
2.1 Materials
PLGA was purchased from the Shandong Key Laboratory of Medical Polymer Materials (lactide![[thin space (1/6-em)]](https://www.rsc.org/images/entities/char_2009.gif) :
:![[thin space (1/6-em)]](https://www.rsc.org/images/entities/char_2009.gif) glycolide = 50
glycolide = 50![[thin space (1/6-em)]](https://www.rsc.org/images/entities/char_2009.gif) :
:![[thin space (1/6-em)]](https://www.rsc.org/images/entities/char_2009.gif) 50, MW = 11
50, MW = 11![[thin space (1/6-em)]](https://www.rsc.org/images/entities/char_2009.gif) 000 Da). PFP was purchased from Alfa Aesar (U.K.). Fe3O4 nanoparticles, processed with oleic acid (mean diameter of 10 nm), were obtained from Ocean NanoTech Inc. (Arkansas, USA). PTX was obtained from Haoxuan CO (Xi'an, China). Poly vinyl alcohol (PVA, Mw = 30
000 Da). PFP was purchased from Alfa Aesar (U.K.). Fe3O4 nanoparticles, processed with oleic acid (mean diameter of 10 nm), were obtained from Ocean NanoTech Inc. (Arkansas, USA). PTX was obtained from Haoxuan CO (Xi'an, China). Poly vinyl alcohol (PVA, Mw = 30![[thin space (1/6-em)]](https://www.rsc.org/images/entities/char_2009.gif) 000–70
000–70![[thin space (1/6-em)]](https://www.rsc.org/images/entities/char_2009.gif) 000 Da) was obtained from Sigma-Aldrich (USA). Water was purified by using a Milli-Q system (Millipore, USA). The NIR lamp, obtained from Warren HongliHLH-1 (Model UTG 1025, Chongqing, China), produced a wavelength of 0.78–2.8 μm (1.5 W cm−2). The infrared thermometer was purchased from Fluke Ti32 (USA). All chemicals used in the present study were of analytical grade and used without further processing. Animals were performed in accordance with the guidelines of the Department of Laboratory Animals, Central South University, China, and approved by the Ethics Committee of Central South University.
000 Da) was obtained from Sigma-Aldrich (USA). Water was purified by using a Milli-Q system (Millipore, USA). The NIR lamp, obtained from Warren HongliHLH-1 (Model UTG 1025, Chongqing, China), produced a wavelength of 0.78–2.8 μm (1.5 W cm−2). The infrared thermometer was purchased from Fluke Ti32 (USA). All chemicals used in the present study were of analytical grade and used without further processing. Animals were performed in accordance with the guidelines of the Department of Laboratory Animals, Central South University, China, and approved by the Ethics Committee of Central South University.
2.2 Fabrication of NPNs
Based on the method introduced by Niu et al. with minor modifications,8 we innovated a new modified emulsion evaporation process and successfully fabricated novel polymer nanoparticles (NPNs). A total of 100 mg of PLGA and 10 mg of PTX was placed into a 50 mL beaker, and 3 mL of methylene chloride solution was added. Then, the beaker was sealed with plastic wrap until the PLGA and PTX were completely dissolved. Subsequently, the beaker was placed in an ice bath, 100 μL of PFP was added, and the beaker was sealed again. Next, 200 μL of oleic acid-processed Fe3O4 suspension was added to the beaker and gently shaken for a few seconds. Subsequently, 15 mL of 4% PVA solution was added to the beaker and gently oscillated for a few seconds. The beaker was placed under an ultrasonic crusher at 75 W for 1 min. Next, the beaker was placed in an ice bath for at least 5 h, and the plastic wrap was removed to extract the organic solvent. The remaining solution was washed using double-distilled water, followed by centrifugation at 9000 rpm for 5 min at −4 °C. The washing and centrifugation steps were repeated three times. Finally, the successfully fabricated NPNs were stored away from light at 4 °C until further use. The pure PLGA nanoparticles, PLGA nanoparticles encapsulating PFP (PFP@PLGA), PLGA nanoparticles encapsulating PTX (PTX@PLGA), PLGA nanoparticles encapsulating PFP and Fe3O4 (PFP/Fe3O4@PLGA), and PLGA nanoparticles encapsulating PFP and PTX (PFP/PTX@PLGA) were fabricated and used as controls.2.3 Basic characterization of NPNs
The basic characterization of NPNs included the morphology, mean diameter, size distribution and the embedding rate of Fe3O4. The morphology of these NPNs was studied using a scanning electron microscope (SEM, JEOL-7800F, Japan), and the mean diameter and size distribution of the NPNs were evaluated by using a dynamic light scattering Zetasizer instrument (Nano ZS unit Malvern Instrument, UK). To confirm the existence of the Fe3O4 nanoparticles in the NPN shell, the NPNs were analyzed under a transmission electron microscope (TEM, HitachiH-7600, Japan). To further validate the amount of Fe3O4 nanoparticles with different iron concentrations embedded in the shell of the NPNs, inductively coupled plasma atomic emission spectroscopy (ICP-AES; 180-80 Hitachi, Japan) was used.2.4 Evaluation of PTX loading
By determining the amount of PTX recovered from the washed supernatants during preparation (Wres) at an excitation wavelength, we evaluated the encapsulation efficiency and drug loading using ultraviolet-visible (UV-vis) spectrophotometry (λex = 233 nm). The drug payload (WNP) was calculated as the difference between the total amount of PTX (Wtot) and Wres. The encapsulation efficiency (%) equals WNP/Wtot multiplied by 100%, while the loading efficiency (%) equals WNP/WT multiplied by 100%. WNP is the total drug amount in the nanoparticles; Wtot is the total weight of PTX used in the preparation of the nanoparticles; and WT is the total weight of the nanoparticles.2.5 In vitro PTX release
To assess the PTX release procedure upon NIR irradiation, a movable NIR device with a wavelength from 0.78–2.8 μm (Model UTG 1025, Chongqing, China) was performed in vitro. We set a fixed distance between the light and the samples of 15 cm.13 A total of 5 mL of NPNs with an Fe3O4 concentration of 189.49 μg mL−1 was fabricated in 1× phosphate-buffered solution (PBS) at pH 7.4 and subsequently placed in a sample holder at 37 °C to iminate the body temperature for a few minutes with stirring at 100 rpm.8 The sample was irradiated by NIR light with 1.5 W cm−2 and 20 min. The concentration of PTX was determined using UV-vis spectrophotometry. Subsequently, the accumulative ratios of the released PTX were calculated with the accumulation of time. The same procedures, but without NIR irradiation, were also performed on the controls.2.6 NIR-induced phase transition for US imaging with NPNs in vitro
In this experiment, we used a custom-made mold. Three holes with a depth of 2 cm and a diameter of 1 cm were generated in the center of the mold. The molds were produced from 1% agarose in water. A 1 mL volume of de-gassed and de-ionized water (I), pure PLGA (II), Fe3O4@PLGA with Fe3O4 concentrations of 13.8, 69 and 345 μg mL−1 (III–V), PFP@PLGA (VI), or Fe3O4/PFP@PLGA with Fe3O4 concentrations of 13.8, 69 or 345 μg mL−1 (VII–IX) was injected into an agarose hole via a syringe. Once filled with these solutions, the samples were irradiated with NIR light (1.5 W cm−2). The temperature of the samples in the agarose holes was monitored using an infrared thermometer (Fluke Ti32; USA). A Siemens S3000 (Acuson S3000, Siemens Medical Solutions USA, Inc.) scanner ultrasonic imaging system equipped with a 7.5 MHz US transducer was used. US images of group I–IX were acquired. All images were acquired and stored with the same instrument parameters (mechanical index, MI = 0.5; gain = 10 dB). Ultrasonography was performed before and after NIR irradiation and was monitored by the infrared thermometer. The corresponding results are presented as grayscale values of the US images Table 1.| Sample | Mean grayscale value | ||
|---|---|---|---|
| Before irradiation | After irradiation (50 °C) | ||
| a *p < 0.05 compared with the de-gassed and de-ionized water group. #p < 0.05 compared with the Fe3O4/PFP@PLGA (345 μg mL−1 Fe3O4 concentration) group. | |||
| De-gassed and de-ionized water | 0.33 ± 0.45 | 0.33 ± 0.45# | |
| Pure PLGA | 0.43 ± 0.12 | 0.43 ± 0.12# | |
| Fe3O4@PLGA with different Fe3O4 concentration | 13.8 μg mL−1 | 0.41 ± 0.25 | 28.1 ± 0.5*,# |
| 69 μg mL−1 | 0.41 ± 0.11 | 42.7 ± 1.0*,# | |
| 345 μg mL−1 | 0.50 ± 0.20 | 49.1 ± 1.9*,# | |
| PFP@PLGA | 0.45 ± 0.07 | 55.4 ± 2.9# | |
| Fe3O4/PFP@PLGA with different Fe3O4 concentration | 13.8 μg mL−1 | 0.43 ± 0.17 | 65.7 ± 3.1*,# |
| 69 μg mL−1 | 0.37 ± 0.06 | 84.4 ± 5.4*,# | |
| 345 μg mL−1 | 0.49 ± 0.18 | 123.0 ± 5.2* | |
2.7 In vitro MRI experiments
The in vitro MRI experiment was performed under a Siemens Skyra 3.0T MRI scanner (Siemens Healthcare, Andover, MA). NPNs possessing different concentrations of Fe3O4 was placed in Eppendorf tubes with a diameter of 1 cm. The T2-weighted (T2WI) gradient-echo imaging parameters were set as follows: fast field (FFE), repetition time (TR) = 72 ms, echo time (TE) = 9 ms, flip angle = 45°, slice thickness = 3 mm, and field of view (FOV) = 180 mm. Images were displayed with a size of 256 × 256 in the matrix. We calculated the transverse relaxation rate (1/T2) as a function of the nanoparticle volume fraction by using MatLab (The MathWorks, Inc., Natick, MA).2.8 In vitro cytotoxicity assay
Cytotoxicity of NPNs was evaluated using cell counting kit (CCK-8) assays with mouse breast cancer 4T1 cell line. 4T1 cells (104 cells per well) were incubated in 96-well plates at 37 °C for 24 h. Different dosages (0.2, 0.4, 0.6 and 0.8 mg mL−1, 0.1 mL per well) of NPNs suspension were added for incubation for 4 h. Cells not exposed to NPNs or not irradiated with NIR as the controls. The cells in each experimental well were exposed to NIR irradiation (1.5 W cm−2) for 10 min, and control samples were exposed to NIR irradiation. All experiments were conducted for three times and cell viability was calculated.2.9 Animal model
Fifty-four New Zealand white rabbits of both sexes weighing 2.0–2.5 kg were used as experimental animals. Tumor-bearing rabbits with a VX2 tumor in the thigh were provided by the laboratory of the Second Xiangya Hospital. Following peritoneal anesthesia by injecting 3% pentobarbital sodium (1.5 mL kg−1), the tumor areas were depilated by 8% sodium sulfide and sterilized. Subsequently, the fish-meat-like tissue that remained after removing the necrotic areas in the tumor tissue was excised from the tumor-bearing rabbits, soaked in 20 mL of physiological saline solution, and then sheared into small pieces of approximately 1.0 × 1.0 mm3. The vaccine-awaiting rabbits were fixed and routinely disinfected at the right hind leg, and a 2 mL suspension containing approximately 5 pieces of fractured tumor tissue was injected into the right hind legs intramuscularly. After tumor transplantation, the experimental rabbits were intramuscularly administered a dose of penicillin (120 mg, 1670 U mg−1) to further prevent potential infection. The tumor-bearing rabbits were euthanized by a lethal dose of 3% pentobarbital peritoneal injection.2.10 US and MR imaging of rabbit tumor popliteal lymph nodes in vivo
Two weeks after tumor vaccination, the tumor grew to a diameter of 1 cm, and the rabbits bearing VX2 tumors were used to study the enhancement effects of NPNs for US and MR contrast imaging. Eighteen rabbits bearing VX2 tumors were selected and randomly divided into three groups: (I) saline, (II) pure PLGA, and (III) NPNs with Fe3O4 concentration of 345 μg mL−1. In each group, the tumor-bearing rabbits were administered a subcutaneous injection of 2 mL of saline, pure PLGA, or NPNs at the right hind foot pad and were massaged for 5 minutes before MR and US imaging.MR scanning was conducted using a Siemens Skyra 3.0 T MRI scanner (Siemens Healthcare, Andover, MA, USA). The following imaging parameters were set for T2-weighted (T2WI) gradient-echo: TR = 72 ms, TE = 9 ms, flip angle = 45°, slice thickness = 3 mm, and FOV = 180 mm. Images were obtained with a matrix size of 256 × 256.
After MR imaging, the three groups of rabbits were exposed to NIR irradiation for US imaging. An infrared thermometer was used to monitor the surface temperature of the tumor tissue during irradiation. Ultrasonography was performed at popliteal lymph node sites in all rabbits before NIR irradiation and at 2, 5, and 12 min after irradiation. The corresponding US contrast images were recorded and stored. The grayscale mode at a depth of 2 cm, MI = 0.1 was first performed to position the tumor lymph nodes. Contrast-enhanced harmonic mode imaging was subsequently performed by using a linear 9L4 probe (Acuson S3000, Siemens Medical Solutions USA, Inc.). All rabbits were operated under sedation with 3% pentobarbital sodium peritoneal injection.
2.11 Therapy plan
We randomly divided the remaining 36 rabbits into 6 groups: group I (saline), II (PTX@PLGA), III (PFP@PLGA with NIR irradiation), IV (PFP@PLGA/Fe3O4 with NIR irradiation), V (NPNs with NIR irradiation), and VI (NPNs without NIR irradiation). In group I, 4 mL of saline was percutaneously injected slowly via the foot pad of the right hind legs after lidocaine anesthesia. In group II (PTX@PLGA), 1 mL of PTX@PLGA nanoparticles carrying approximately 2 mg of PTX was diluted to 4 mL and percutaneously injected as in group I; in groups III (PFP@PLGA) and IV (PFP@PLGA/Fe3O4), 1 mL of PFP@PLGA and PFP@PLGA/Fe3O4 was diluted to 4 mL and percutaneously injected as described above; in groups V and VI, 1 mL of NPNs carrying approximately 2 mg of PTX diluted to 4 mL was percutaneously injected using the same method; groups III, IV and V were irradiated with a movable infrared therapy device with a wavelength ranging from 0.78–2.8 μm (1.5 W cm−2) at a distance of 15 cm from the light source to the lymph nodes for 12 min. We inserted thermocouple thermometer probe (TES 1310, Taiwan) into the tumor lymph nodes to monitor the temperature in all groups. Treatments were repeated every other day.2.12 Tissue immunohistochemical analysis
After sustained treatment for two weeks, the 36 rabbits were euthanized by a lethal dose of pentobarbital, and all tumor lymph nodes were ablated for histological analysis on day 14. We fixed the ablated tumor lymph nodes in formalin, embedded in paraffin, and sliced and stained the tissues with hematoxylin and eosin in succession for histopathological analysis. Additionally, the sectioned tumor lymph node tissues were stained with antibodies against proliferating cell nuclear antigen (PCNA) for tumor cell proliferation and subjected to TdT-mediated dUTP nick end labeling (TUNEL) assays to assess tumor apoptosis. We also evaluated these sectioned tumor lymph nodes by using antibodies against CD34 and lymphatic vessel endothelial hyaluronan receptor (LYVE)-1 to detect the blood vessel density and lymphatic vessel density, which are related with tumor angiogenesis and lymphangiogenesis in tumor lymph nodes and correlated with regional lymph node metastasis and patient survival.19,20 Under a microscope (CKX41, Olympus America, Inc., Center Valley, PA), the tissue sections were assessed for PCNA expression, apoptosis expression, blood vessel density and lymphatic vessel density. We defined positive cells as the number of cells stained positively by high magnification from at least 5 randomly selected visual fields. The proliferating index (PI) and apoptotic index (AI), defined as the ratio of positively stained tumor cells to all cells, were determined from at least 5 randomly selected high-power visual fields and used to evaluate the cell survival state. Each stained canal was deemed a solitary countable vessel. We selected areas distributing the highest vascular density to evaluate the blood vessel density and lymphatic vessel density, which were defined as all CD34-positive vessels at a summation high magnification and all LYVE-1-positive vessels at a summation high magnification, respectively. Different observers who were blinded to the data were used throughout the entire experiment.2.13 Statistical analysis
All results are expressed as the mean values ± standard deviation (SD). The significant differences among groups were analyzed by one-way ANOVA, and individual groups were compared by Student's t-test. p < 0.05 was considered statistically significant.3. Results and discussion
3.1 Hypothesis, synthesis and structural characterization of NPNs
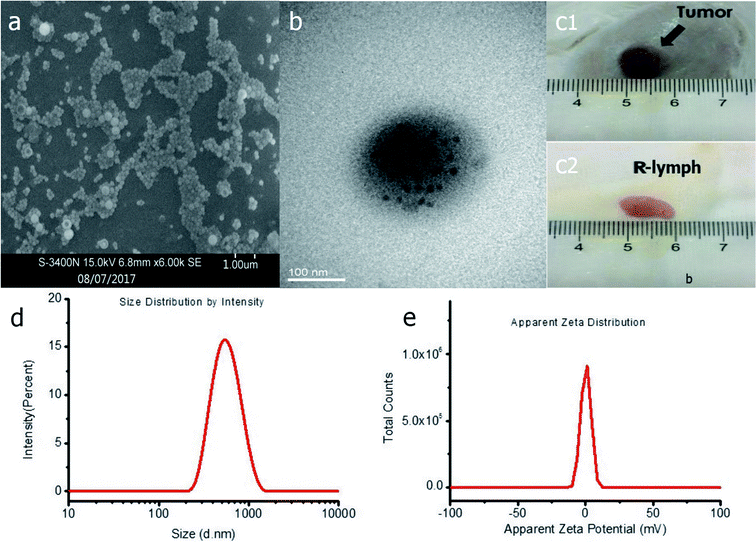
Fig. 1 shows the abridged general three-dimensional view of the PTX-loaded multiple microbubbles, with PFP as the nucleus and PLGA as the polymer shell embedded with Fe3O4 (black particles) and PTX (red particles). We hypothesized that these NPNs are delivered via the lymphatic system and that the site-specific release of the drugs can be controlled by NIR irradiation. These NPNs exhibited a smooth surface and uniform spherical morphology (Fig. 2a). TEM showed the surface distribution of Fe3O4 (Fig. 2b), a slightly negative voltage on the sphere surface (Fig. 2e, zeta potential: −0.5 mV) with a size distribution range of 290–620 nm and a mean diameter equal to 350 ± 56.56 nm (Fig. 2d). The naked shell refers to the blank structure of PLGA in the absence of PFP/Fe3O4/PTX with a mean diameter of approximately 330 ± 40.29 nm, revealing that the PFP/Fe3O4/PTX was much smaller than the PLGA shell and apparently does not interfere with the NPN size distribution. The different concentrations of Fe3O4 nanoparticles with different iron concentrations embedded in the NPNs by the atomic absorption spectrometry method was 0 ± 0, 1.45 ± 0.06, 2.90 ± 0.09, 5.80 ± 0.28, 14.80 ± 0.29, 28.76 ± 0.53, 56.87 ± 0.39, and 189.49 ± 1.11 μg mL−1.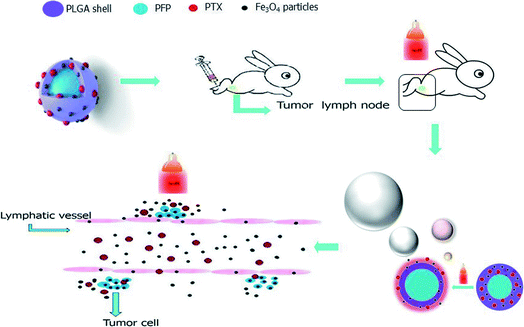 | ||
| Fig. 1 Schematic of the NPNs and a theoretical illustration showing how PTX-loaded particles are delivered into lymph nodes and the controlled release of PTX triggered by NIR. | ||
3.2 PTX loading efficiency and NIR-induced phase transition for US imaging with NPNs
A gross specimen from a tumor-bearing rabbit and the ablated tumor lymph node are shown in Fig. 2c. To evaluate the effectiveness of the NPNs as a trigger, the PTX encapsulation efficiency and loading efficiency were measured. The encapsulation efficiencies of PTX in the NPNs with different concentration of Fe3O4 are shown in the histogram (Fig. 3). The PTX loading efficiencies of these NPNs were 5.73 ± 0.15% (w/w), 5.69 ± 0.32% (w/w), 6.47 ± 0.27% (w/w), 5.74 ± 0.22% (w/w), 6.43 ± 0.19% (w/w), 5.82 ± 0.19% (w/w), and 5.89 ± 0.22% (w/w). From the results above, it is clear that the addition of Fe3O4 in the polymer shell did not influence PTX encapsulation efficiency or its loading efficiency (Fig. 3).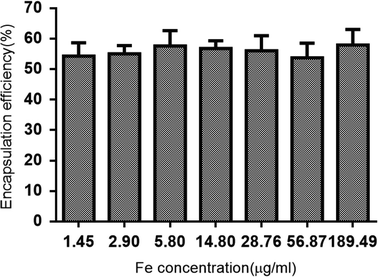 | ||
| Fig. 3 Encapsulation efficiency of paclitaxel in NPNs with different concentrations of Fe3O4 (n = 3). | ||
We used the release curve to determine the release profiles of PTX from NPNs (Fe3O4 concentration of 189.49 ± 1.11 μg mL−1) with or without NIR irradiation. In the group of without NIR irradiation, no phase transition of the NPNs occurred, no gas bubbles was generated, and a low level PTX was detected. By contrast, in the group of with NIR irradiation, gas bubbles were produced more and more, and PTX was released gradually (Fig. 4a). We used the time of half-release (THR) to represent the time at which 50% of the PTX was released from these NPNs. Results showed the release rate of PTX with NIR irradiation was faster than that without NIR irradiation, the mean THR for NPNs with and without NIR irradiation was approximately 8 min and 8 h, respectively. Based on these results, PTX-loaded nanoparticles can undergo triggered release and deposition at the target sites with NIR irradiation.
 | ||
| Fig. 4 Release of paclitaxel from NPNs with (NPNs + NIR) and without (NPNs) NIR irradiation in vitro (a). Relationship between paclitaxel release and temperature (b) (n = 3). | ||
In Fig. 4b, the release curve of released PTX with temperature increased is shown. The release rate of PTX increased with the temperature and reached a peak at approximately 50 °C. With the temperature rise from 50 °C to 70 °C, the release rate showed a platform period. We conclude maybe the phase transition of nanoparticles happened at maximum extent at 50 °C and no more new microbubbles generated, so the PTX seemed stoping release from NPNs with the temperature increased, but with the time increased, the release of PTX still went on slowly.
3.3 In vitro US and MR imaging of NPNs
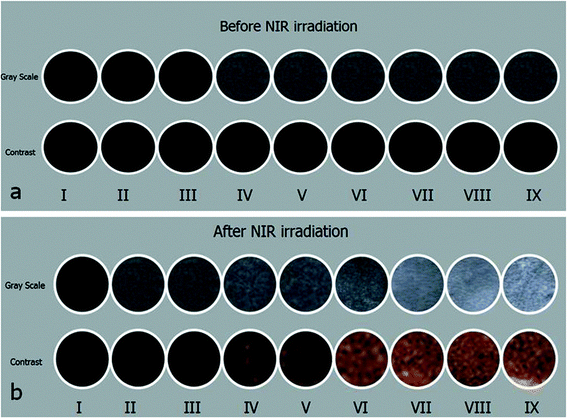
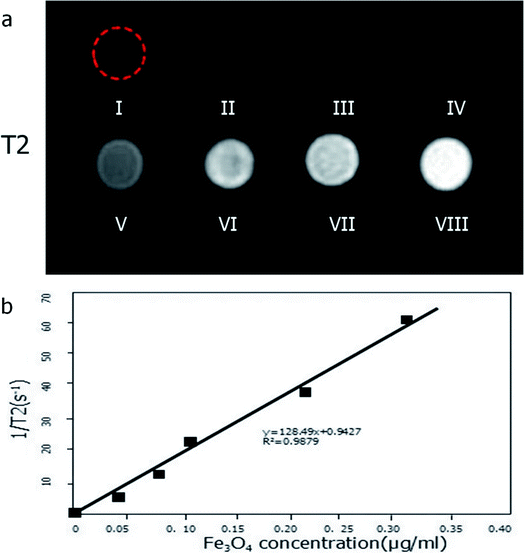
Before and after NIR irradiation, grayscale US and contrast images of (I) de-gassed and de-ionized water; (II) pure PLGA; (III–V) Fe3O4@PLGA with three different concentrations of Fe3O4; (VI) PFP@PLGA; and (VII–IX) Fe3O4/PFP@PLGA with different concentrations of Fe3O4 were acquired (Fig. 5). Echo or enhancement in grayscale or contrast mode was absent in all samples before NIR irradiation (Fig. 5a). By contrast, after NIR irradiation, when the temperature reached 50 °C, a significant increase in US backscatter signals was observed for the III–IX sample groups (Fig. 5b), especially for groups IV–IX. The brightness of groups IV–IX was dependent on the concentration of Fe3O4 in the nanoparticles and increased as the Fe3O4 concentration increased. This result may suggest that the Fe3O4-integrated nanoparticles contributed to US backscattering echo intensity, which is consistent with the research of previous studies.10,11 In addition, for groups with the same Fe3O4 concentration, the brightness of groups with PFP were higher than those without PFP. This result indicates that the nanoparticles absorbed the NIR and converted it to heat, inducing the liquid–gas phase transition and generating abundant gas bubbles, which further enhanced the grayscale and contrast US imaging, which is consistent with previous published results.13 By contrast, the grayscale and contrast images of groups I and II showed no obvious increase in echogenicity or contrast enhancement at 50 °C.In addition, to determine the effect of these nanoparticles on MR imaging, the relaxation rate (1/T2) was measured by a Siemens Skyra 3.0 T MRI device. The results of the T2-weighted MR images of these nanoparticle samples with different iron concentrations are shown in Fig. 6a. As shown in the figure, the lower the concentration of iron, the brighter the images. Fig. 6b shows the linear relationship between 1/T2 and iron concentration, the data fitted to a linear function with R2 = 0.9879. Based on these results, we conclude that nanoparticles can also effectively serve as an MRI negative contrast agent.
3.4 In vitro cytotoxicity of NPNs
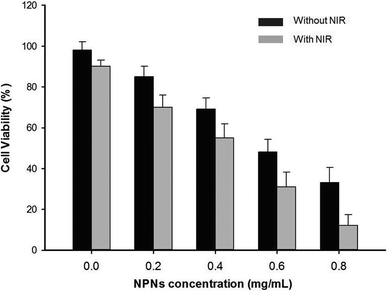
To investigate the cytotoxicity of NPNs, 4T1 cells were incubated with various concentrations of NPNs for 4 h and then treated with or without NIR irradiation (1.5 W cm−2, 10 min) before cell viability was measured via CCK-8 assay. As shown in Fig. 7, obvious decrease in cell viability was observed upon exposure to various concentrations of NPNs without NIR irradiation due to the chemotherapy effect of PTX from NPNs. More enhanced cancer cell ablation was observed with increasing concentrations of NPNs under NIR irradiation due to the synergistic effect of chemotherapy and hyperthermal therapy.3.5 Dual-modal US and MR imaging of rabbit tumor lymph nodes
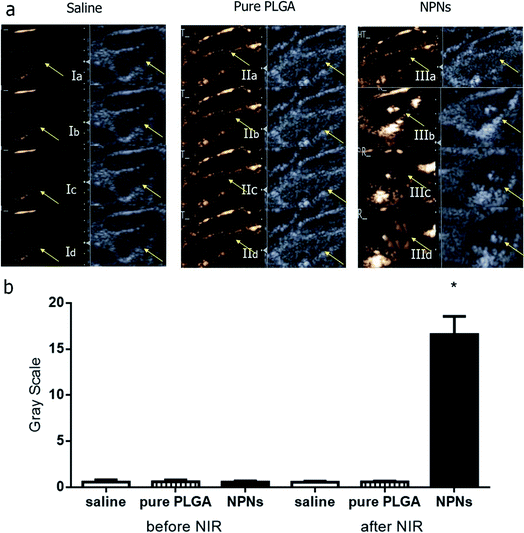
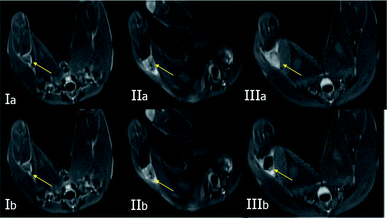
To verify the effectiveness of NPNs for dual-modal biological imaging, we executed further experiments in vivo. Three groups were generated, saline (control group I), pure PLGA (group II) and NPNs (group III), and all three groups were irradiated with NIR. Neither the control tumor lymph nodes injected with saline (I) nor those injected with pure PLGA (II) showed any increase in echogenicity over the duration of the imaging period before and after NIR irradiation (Fig. 8Ia–d and IIa–d). Similarly, the nodes injected with NPNs (III) showed no enhancement of the image before NIR irradiation (Fig. 8IIIa). By contrast, after NIR irradiation, group III exhibited persistent enhancement as the temperature increased (Fig. 8IIIb–d), peaking at 50 °C. The physical action of massaging at the injection site not only promoted the movement of the contrast agents in the lymphatic channels but also caused a subsequent increase in the reflectivity of the affected popliteal lymph nodes. These results suggest that the nanoparticles co-encapsulated with PFP are superior to pure PLGA nanoparticles with respect to US imaging enhancement, that NIR irradiation can promote the phase transition at an optimum temperature, and that vaporized gas bubbles after irradiation further increase the enhancement. Furthermore, the addition of Fe3O4 synergistically improves the effect of PLGA as a US contrast agent.As these nanoparticles are co-encapsulated with Fe3O4, they can also produce an arresting effect in T2-weighted MR imaging for lymph nodes. Fig. 9 show the MR images of tumor lymph nodes before and after the injection of the nanoparticles. The entire signal of the tumor lymph nodes was negatively increased after the injection of NPNs (Fig. 9IIIa and b), and the group injected with PLGA nanoparticles without Fe3O4 showed similar but slightly negative enhancement in T2-weighted images (Fig. 9IIa and b), while the T2-weighted signal in control tumor lymph nodes did not change after the injection of saline (Fig. 9Ia and b). The results suggest the Fe3O4 inclusion nanoparticles could effectively serve as an MRI negative contrast agent for lymph nodes imaging.
3.6 Results of antitumor therapy in tumor lymph nodes
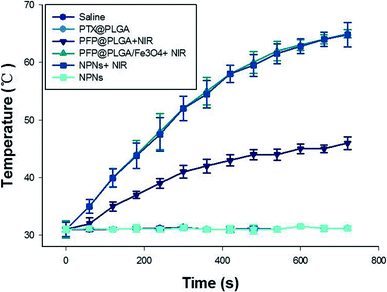
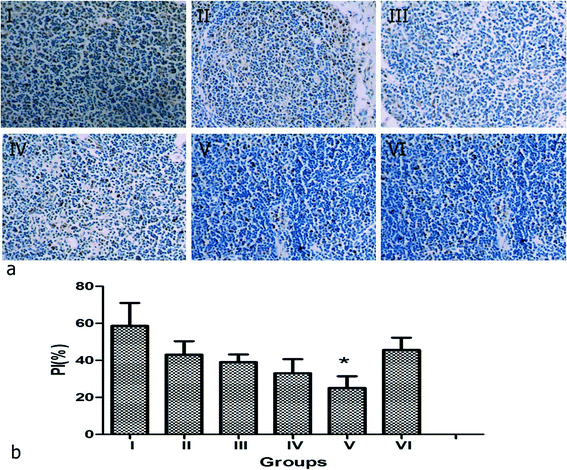
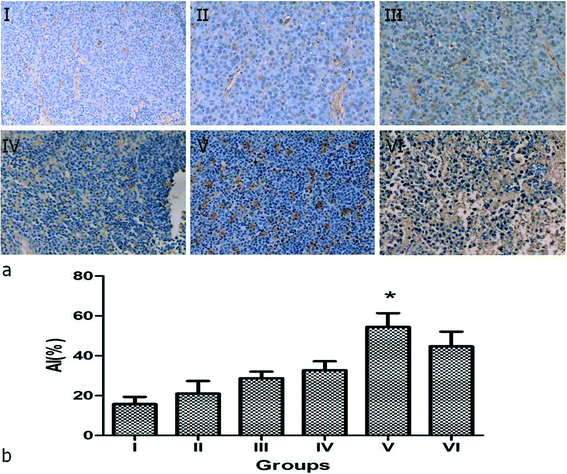
The remaining 36 rabbits were divided into 6 groups to assess the effect of NPNs resistance to the tumor in lymph nodes by histological and immunohistochemical analysis: group I (saline), group II (PTX@PLGA), group III (PFP@PLGA + NIR), group IV (PFP@PLGA/Fe3O4 + NIR), group V (NPNs + NIR) and group VI (NPNs). The temperature in tumor lymph nodes in groups I–VI were monitored with a thermocouple thermometer during NIR irradiation. The temperature rapidly rose and continued to increase to 65.0 °C after 12 min of NIR irradiation in mice who received PFP@PLGA/Fe3O4 (group IV) or NPNs (group V). However, the temperature in mice who received PFP@PLGA (group III) showed a little increase upon NIR irradiation for the same duration. The temperature in mice treated with saline (group I), PTX@PLGA (group II) or NPNs without NIR irradiation (group VI) did not significantly increase (Fig. 10). A large number of bubbles were observed on the surface of tumor lymph nodes excised from the rabbit of group III, IV and V with PFP inclusion, similar phenomena were not observed in group I, II and VI, which further confirmed liquid to gas phase transition of PFP happened under NIR irradiation.Then, PCNA, TUNEL, micro blood vessel density (MVD), and lymphatic microvessel density (LMVD) were used to evaluate the treatment effects. For the evaluation of cell proliferation, PCNA expression was observed in all six groups (Fig. 11a), shown as brown particles in the cell nuclei. The PI, which is equal to the ratio of positively stained tumor cells to all cells in the high-power fields, was significantly lower in group V (NPNs + NIR) than in group I–IV (![[thin space (1/6-em)]](https://www.rsc.org/images/entities/char_2009.gif) p < 0.05) and slightly lower than group VI (Table 2, Fig. 11b). Cell apoptosis in tissue sections was evaluated by the TUNEL assay, the apoptotic cells exhibited a brown stain in their nuclei (Fig. 12a). The AI, expressed as the ratio of positively stained tumor cells to all cells in the high-power fields, was significantly higher in group V (NPNs + NIR) than in group I–IV (
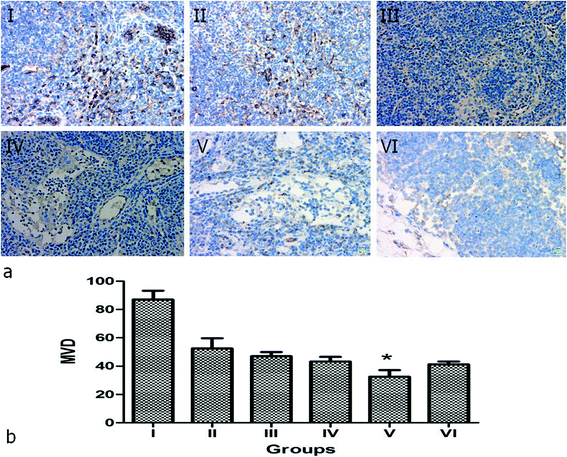
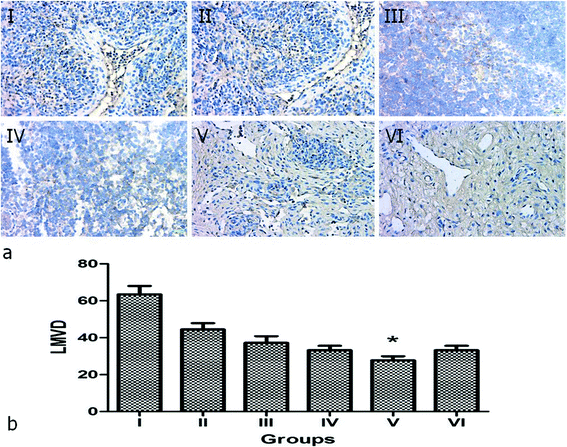
p < 0.05) and slightly lower than group VI (Table 2, Fig. 11b). Cell apoptosis in tissue sections was evaluated by the TUNEL assay, the apoptotic cells exhibited a brown stain in their nuclei (Fig. 12a). The AI, expressed as the ratio of positively stained tumor cells to all cells in the high-power fields, was significantly higher in group V (NPNs + NIR) than in group I–IV (![[thin space (1/6-em)]](https://www.rsc.org/images/entities/char_2009.gif) p < 0.05) and slightly higher than group VI (Table 2, Fig. 12b). This results indicate the chemotherapy of PTX plays an important role in tumor cell proliferation and apoptosis, and effectively increases the synergistic effect of hyperthermal therapy by NIR irradiation. To assess the MVD and LMVD of the tumor lymph nodes, the tissue sections were stained with CD34 and LYVE-1. The counts of CD34-positive and LYVE-1-positive vessels stained in one high-power field were quantified, and we selected the areas with the highest vascular density as the regions of interest. From these results, we observed that both CD34-positive MVD and LYVE-1-positive LMVD of tumor lymph nodes in group V (NPNs + NIR) was significantly lower than in group I–III (
p < 0.05) and slightly higher than group VI (Table 2, Fig. 12b). This results indicate the chemotherapy of PTX plays an important role in tumor cell proliferation and apoptosis, and effectively increases the synergistic effect of hyperthermal therapy by NIR irradiation. To assess the MVD and LMVD of the tumor lymph nodes, the tissue sections were stained with CD34 and LYVE-1. The counts of CD34-positive and LYVE-1-positive vessels stained in one high-power field were quantified, and we selected the areas with the highest vascular density as the regions of interest. From these results, we observed that both CD34-positive MVD and LYVE-1-positive LMVD of tumor lymph nodes in group V (NPNs + NIR) was significantly lower than in group I–III (![[thin space (1/6-em)]](https://www.rsc.org/images/entities/char_2009.gif) p < 0.05) and slightly lower than group IV and VI (Table 2, Fig. 13 and 14). This results indicate both the chemotherapy of PTX and hyperthermal therapy by NIR irradiation are important in tumor angiogenesis and lymphangiogenesis in tumor lymph nodes, furthermore, combination of chemotherapy and hyperthermal therapy will work the best. In summary, we conclude that the tumor regression rate in tumor lymph nodes is negatively related to the PI, MVD and LMVD and positively related to the AI.
p < 0.05) and slightly lower than group IV and VI (Table 2, Fig. 13 and 14). This results indicate both the chemotherapy of PTX and hyperthermal therapy by NIR irradiation are important in tumor angiogenesis and lymphangiogenesis in tumor lymph nodes, furthermore, combination of chemotherapy and hyperthermal therapy will work the best. In summary, we conclude that the tumor regression rate in tumor lymph nodes is negatively related to the PI, MVD and LMVD and positively related to the AI.
| Group | PI (%) | AI (%) | MVD | LMVD | n |
|---|---|---|---|---|---|
| a Values are presented as the mean ± SD. Groups I–VI represent saline, PTX@PLGA, PFP@PLGA + NIR, PFP@PLGA/Fe3O4 + NIR, PFP@PLGA/Fe3O4/PTX + NIR, and PFP@PLGA/Fe3O4/PTX, respectively. *p < 0.05 compared with the control group I. #p < 0.05 compared with the group V. | |||||
| I | 69.87 ± 5.12# | 13.48 ± 3.14# | 92.13 ± 10.89# | 70.34 ± 8.81# | 6 |
| II | 47.35 ± 5.13*,# | 28.59 ± 3.89*,# | 55.56 ± 6.78*,# | 48.89 ± 7.21*,# | 6 |
| III | 33.45 ± 4.87*,# | 32.48 ± 4.23*,# | 43.34 ± 4.44*,# | 41.22 ± 5.13*,# | 6 |
| IV | 26.53 ± 3.44*,# | 44.39 ± 5.39*,# | 36.65 ± 4.91* | 37.55 ± 3.21* | 6 |
| V | 19.69 ± 3.18* | 52.19 ± 4.98* | 29.84 ± 4.58* | 30.45 ± 3.24* | 6 |
| VI | 23.44 ± 2.96* | 49.47 ± 4.39* | 33.52 ± 3.32* | 34.31 ± 4.12* | 6 |
4. Conclusion
In the present study, we synthesized novel multifunctional nanoparticles and applied NIR simultaneously for dual-modal US/MR imaging and tumor lymph node chemotherapy and hyperthermal therapy. By using the portable NIR lamp, the PFP droplet-encapsulated nanoparticles absorbed the heat with the help of Fe3O4 and vaporized into microbubbles, this progress promoted the release of PTX and high temperature generated by the NIR irradiation makes certain damages to tumor lymph nodes. Thus, the NPNs are not only a suitable contrast agent for US/MR imaging, but also an effective chemo-/hyperthermal therapy agent to treat tumor metastasis in lymph nodes.Conflicts of interest
The authors declare that they have no conflicts of interest. Animals were performed in accordance with the guidelines of the Department of Laboratory Animals, Central South University, China, and approved by the Ethics Committee of Central South University. Informed consent was obtained from all human participants included in the study.Acknowledgements
This study was supported partially by the National Natural Science Foundation of China (Grant No. 81401431 and 81271593) and the Hunan Provincial Natural Science Foundation of China (Grant No. 2017JJ3443).References
- S. K. Nune, P. Gunda, B. K. Majeti, P. K. Thallapally and M. L. Forrest, Adv. Drug Delivery Rev., 2011, 63, 876–885 CrossRef CAS PubMed.
- S. M. Cohen, B. G. Fishinghawk and M. S. Cohen, Adv. Drug Delivery Rev., 2011, 63, 956–962 CrossRef CAS PubMed.
- J. D. McAllaster and M. S. Cohen, Adv. Drug Delivery Rev., 2011, 63, 867–875 CrossRef CAS PubMed.
- Y. Xie, T. R. Bagby, M. S. Cohen and M. L. Forrest, Expert Opin. Drug Delivery, 2009, 6, 785–792 CrossRef CAS PubMed.
- H. Lu, B. Li, Y. Kang, W. Jiang, Q. Huang, Q. Chen, L. Li and C. Xu, Cancer Chemother. Pharmacol., 2007, 59, 175–181 CrossRef CAS PubMed.
- L. Wang, Y. H. Hu, Q. H. Peng, J. W. Zhou, Q. C. Zhou, S. B. An and C. C. Niu, RSC Adv., 2016, 6, 50513–50520 RSC.
- C. Niu, Z. Wang, G. Zuo, T. M. Krupka, H. Ran, P. Zhang, P. Li, Y. Chen, H. Chen and Y. Zheng, Clin. Breast Cancer, 2012, 12, 199–206 CrossRef CAS PubMed.
- C. Niu, Z. Wang, G. Lu, T. M. Krupka, Y. Sun, Y. You, W. Song, H. Ran, P. Li and Y. Zheng, Biomaterials, 2013, 34, 2307–2317 CrossRef CAS PubMed.
- Y. D. Xiao, R. Paudel, J. Liu, C. Ma, Z. S. Zhang and S. K. Zhou, Int. J. Mol. Med., 2016, 38, 1319–1326 CrossRef CAS PubMed.
- F. Yang, Y. Li, Z. Chen, Y. Zhang, J. Wu and N. Gu, Biomaterials, 2009, 30, 3882–3890 CrossRef CAS PubMed.
- Z. Liu, T. Lammers, J. Ehling, S. Fokong, J. Bornemann, F. Kiessling and J. Gatjens, Biomaterials, 2011, 32, 6155–6163 CrossRef CAS PubMed.
- Y. Xu, C. C. Niu, S. B. An, S. X. Tang, P. Xiao, Q. H. Peng and L. Wang, RSC Adv., 2017, 7, 40791–40802 RSC.
- Y. Zhao, W. Song, D. Wang, H. Ran, R. Wang, Y. Yao, Z. Wang, Y. Zheng and P. Li, ACS Appl. Mater. Interfaces, 2015, 7, 14231–14242 CAS.
- C. Niu, L. Wang, Z. Wang, Y. Xu, Y. Hu and Q. Peng, Sci. Rep., 2017, 7, 43408 CrossRef PubMed.
- C. Niu, Y. Xu, S. An, M. Zhang, Y. Hu, L. Wang and Q. Peng, Sci. Rep., 2017, 7, 5490 CrossRef PubMed.
- N. Rapoport, K. H. Nam, R. Gupta, Z. G. Gao, P. Mohan, A. Payne, N. Todd, X. Liu, T. Kim, J. Shea, C. Scaife, D. L. Parker, E. K. Jeong and A. M. Kennedy, J. Controlled Release, 2011, 153, 4–15 CrossRef CAS PubMed.
- N. Rapoport, Wiley Interdiscip. Rev.: Nanomed. Nanobiotechnol., 2012, 4, 492–510 CrossRef CAS PubMed.
- N. Rapoport, Prog. Polym. Sci., 2007, 32, 962–990 CrossRef CAS.
- K. Datta, M. Muders, H. Zhang and D. J. Tindall, Future Oncol., 2010, 6, 823–836 CrossRef PubMed.
- S. Ran, L. Volk, K. Hall and M. J. Flister, Pathophysiology, 2010, 17, 229–251 CrossRef PubMed.
| This journal is © The Royal Society of Chemistry 2018 |

