 Open Access Article
Experimental and model research on chloride ion gas–solid distribution in the process of desulfurization wastewater evaporation
Ma Shuangchen *a,
Chai Jina,
Wu Kaia,
Xiang Yajuna,
Wan Zhongchengb and
Zhang Jingruib
aSchool of Environmental Science and Engineering, North China Electric Power University (Baoding), Baoding, 071003, He Bei province, China. E-mail: msc1225@163.com; Tel: +86-3127525521
bShengfa Environmental Protection Co., XiaMen, 361000, Fu Jian province, China
First published on 23rd July 2018
Abstract
In this paper, research on chloride ion gas–solid distribution in the process of desulfurization wastewater evaporation was carried out. The factor analysis of temperature, pH, and concentrations of Cl– Na+, Ca2+ and Mg2+ was explored by orthogonal experiments. Results show that the distribution coefficient increases with increasing temperature and Mg2+ concentration and decreasing pH, but decreases with increasing concentrations of Cl−, Ca2+ and Na+; The interaction and significance of each factor were compared and analyzed, and the order of influence significance on the chloride ion gas–solid distribution coefficient is listed as: temperature (0.781) > pH (0.611) > Cl− concentration (0.366 ) > Mg2+ concentration (0.211) > Ca2+ concentration (0.079) > Na+ concentration (0.03). A chloride ion gas–solid phase distribution coefficient model ranging from 180 °C to 380 °C was built based on phase equilibrium theory and state equations. The study clarifies the gas phase transformation mechanism of chloride ions, and achieves the quantification and prediction of chloride ion volatilization under different environmental and water quality parameters; an important theoretical and practical reference for the application of high temperature flue gas evaporation technology is provided through the research.
1 Introduction
The wet limestone–gypsum flue gas desulfurization process is adopted in most coal-fired power plants in China to remove SO2.1,2 In terms of this technology, the desulfurization wastewater needs to be discharged periodically to keep the chloride ion concentration under 20![[thin space (1/6-em)]](https://www.rsc.org/images/entities/char_2009.gif) 000 mg L−1, thereby protecting the desulfurization system from corrosion and maintaining the normal operation of the desulfurization system.3–6 The water quality of desulfurization wastewater is shown as follows:
000 mg L−1, thereby protecting the desulfurization system from corrosion and maintaining the normal operation of the desulfurization system.3–6 The water quality of desulfurization wastewater is shown as follows:
(1) The desulfurization wastewater is weakly acidic; the pH value remains at 4.5–6.5.
(2) The desulfurization wastewater has high content of suspended solids (SS) and turbidity; the main SS species are gypsum particles and SiO2.
(3) The desulfurization wastewater contains a variety of heavy metals, such as Cr, As, Cd, Pb, Hg and so on.
(4) The total dissolved solids (TDS) in wastewater is high; the anions are mainly Cl− and SO42− and cations are mainly Ca2+ and Mg2+.
With respect to desulfurization wastewater treatment, previous studies mainly focused on single pollutant removal and membrane purification to meet the discharge or reuse standards. Yong H. Huang explored the removal performance of heavy metals in desulfurization wastewater using hybrid zero-valent iron.7,8 The results revealed that the removal efficiencies of Se and Hg were more than 99%; Lin Cui studied electrolysis–electrodialysis process removing chloride ion from wet flue gas desulfurization wastewater and the removal efficiency reached 83.3%;9 Na Yin investigated the process feasibility of ultrafiltration–nanofiltration–reverse osmosis applying for desulfurization wastewater treatment, which could produce sulfuric acid and ammonium salt at the same time, results showed that the process could treat desulfurization wastewater to the discharge standard and the by-product purity was high.10 On April 16, 2015, the State Council of China issued the “Water Pollution Control Action Plan”, to emphasize the management of various types of water pollution. As the terminal wastewater in power plants, desulfurization wastewater has complex components and water quality is poor. Zero liquid discharge (ZLD) of desulfurization wastewater is required by Environmental Protection Departments in some regions.11 Under this background, the technologies of single pollutant removal and membrane purification are difficult to promote owing to their high investment, complex process and high risk of recycling. Thus, a series of ZLD technologies are being developed gradually, the comparison for ZLD technology routines in recent years are shown in Table 1 in detail.12–17
| Traditional flue evaporation | Evaporating crystallization | Mechanical atomizing evaporation | Evaporation pond | High temperature flue gas evaporation | |
|---|---|---|---|---|---|
| Water quality requirements | Low solid content in wastewater | High inlet water quality | Atomizer is sensitive to particulate impurities | No | No |
| Equipment investment | Medium | High | Low | High | Low |
| Area occupied | Less | Medium | Less | Big | Medium |
| Operating costs | Medium | High | Low | Low | Low |
| Risk assessment | Incomplete evaporation | Scaling problem in evaporation process | Wind loss for the surrounding environment | Enough capacity for wastewater storage | A little energy consumption |
| Application conditions | Stable load and small quantity of wastewater | No ash field and no concentrating liquid outlet | Drought area | A large area or ash field | All kinds of power plants |
Two feasible technical routes were put forward to achieve ZLD of desulfurization wastewater in China. Flue gas evaporation drying and crystallization were suggested.18 In flue gas evaporation process, the hot flue gas is extracted before air-preheater, and contacts with wastewater droplets atomized by the atomizer, then the droplets are dried by the high temperature flue gas. Finally, the evaporation products return to the original flue duct with flue gas and are caught by downstream dust collector.
Desulfurization wastewater is a mixed salt system with high chloride ion content, resulting in the release of gaseous HCl in high temperature evaporation process. The gaseous HCl in flue gas will finally enter into the desulfurization system, it will undoubtedly affect the original desulfurization system chloride ion balance and result in adverse effects. Facing the rapid development of ZLD, how to quantify and predict the gas–solid phase distribution of chloride ion under different working conditions becomes the core problem for application of high temperature flue gas evaporation technology.
As for the phase distribution of chloride ion, J. M. Simonson probed into the gas–liquid phase distribution law of chloride ion from 50 °C to 350 °C. It was pointed out that the distribution coefficient could be affected by temperature, pH, chloride ion content, salt content, salt composition and other factors;19–21 M. S. Gruszkiewicz and Liu CK combined the phase equilibrium theory and activity coefficient with the dissolution-carryover theory of boiler water under high temperature and high pressure conditions. The results showed that under normal conditions, chloride ion usually volatilized to the gas phase in the form of HCl and NH4Cl, but in low ammonia environment, the main species was HCl;22–26 Otakar Jonas studied the change of pH with temperature in pure water. He found that the pH of pure water showed a decreasing trend with increasing temperature, it reached the minimum pH of 5.6 at 430 °C.27 When Cl− is contained in water, the H+ generated from hydrolysis can easily bind with Cl−, and then volatilize in the form of gaseous HCl. At present, the study of chloride ion heterogeneous distribution model is still scarce, especially, related research on the gas–solid phase distribution is blank. The models available are only gas–liquid phase distribution that J. M. Simonson and M. S. Gruszkiewicz once put forward, but the influence of the key environmental factors and water quality parameters on the distribution in the model come to nothing.
In this paper, the essential effects of the environmental factors and water quality parameters such as temperature, pH, concentrations of Cl−, Na+, Ca2+ and Mg2+ on the gas–solid phase distribution coefficient of chloride ion were detected by orthogonal experiment. The interaction and significance of each factor were compared and analyzed. The empirical model containing essential influencing factors was proposed based on the orthogonal experimental data, in combination with the theoretical gas–solid phase distribution coefficient model in process of mass transfer and separation, the correction constant φ was determined. Finally, an integrated chloride ion gas–solid phase distribution coefficient model can be calculated ranging from 180 °C to 380 °C. The study obtains the quantification and prediction of chloride ion volatilization in the process of desulfurization wastewater evaporation, the theoretical basis on chloride ion gas transformation inhibition is established, which provides series of key data and important theoretical reference for the application of high temperature flue gas evaporation technology.
2 Orthogonal experiment
2.1 Experimental system
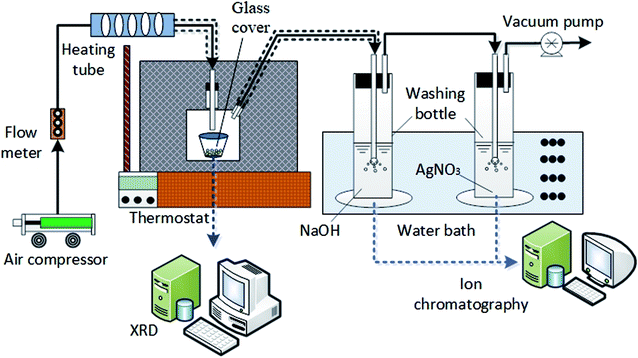
The HCl volatilization experiment was carried out in self-made experimental system as shown in Fig. 1. Experimental equipment consisted of air compressor, flow meter, heating tube, thermostat, self-made glass cover, two washing bottles, water bath, vacuum pump and ion chromatography (IC6000) etc. The measuring span of flow meter was 1–15 L min−1, the maximum power of heating tube was 12 kW and the highest heating temperature of thermostat kept at 500 °C, the evaporation product was characterized by online XRD (Bruker D8 advance) and common XRD (TD3500).2.2 Experimental method
Sample solution with constant amount per time was placed in the crucible and heated in the thermostat; the air providing by air compressor was pumped into sealed glass cover after heated by heating tube; glass wool was used to keep constant temperature for the gas; the evaporated gas was discharged to the first washing bottle by the vacuum pump at the end of the experimental system. The volatilized gaseous chloride was absorbed by NaOH solution in the washing bottle; AgNO3 solution was placed in the second washing bottle to monitor whether the gaseous chloride has been absorbed completely in the first one. The bottles were placed in a thermostatic water bath to maintain a constant absorption temperature; the remaining gas was extracted; flow meter was used to maintain a dynamic equilibrium between the inlet gas from air compressor and the outlet gas through vacuum pump. The dissolved Cl− in the absorption liquid in washing bottle was quantitatively analyzed using IC6000 ion chromatography and the evaporation product was characterized by XRD. The operation conditions of experiment are shown in Table 2.| Condition | Parameter |
|---|---|
| Temperature, °C | 180–380 |
| pH | 3.0–9.0 |
| Cl− concentration, mol L−1 | 0.01–0.04 |
| TDS, mg L−1 | 2645–10![[thin space (1/6-em)]](https://www.rsc.org/images/entities/char_2009.gif) 580 580 |
| Absorption solution volume, mL | 200 |
| Absorption solution concentration, mol L−1 | 0.04 |
| Detection solution volume, mL | 200 |
| Detection solution volume, mol L−1 | 0.01 |
| Temperature of water bath, °C | 20 |
| Sample volume, mL | 10 |
| Air flow rate, L h−1 | 600–800 |
| IC import flow rate, mL min−1 | 0.8 |
| IC inhibition current, mA | 40 |
| Online XRD temperature,°C | 150–350 |
3 Results and discussions
Aiming at six essential effects of environmental factors and water quality parameters such as temperature, pH, concentrations of Cl−, Na+, Ca2+ and Mg2+ on the gas–solid phase distribution coefficient of chloride ion, the “Six Factors and Four Levels” orthogonal experiment was designed to compare the interaction and significance of each factor. The mechanism of chloride ion gas phase transformation was analyzed, and the most suitable parameters of controlling the minimum chloride ion gas–solid phase distribution coefficient were obtained. For convenient calculation, the chloride ion gas–solid phase distribution coefficient is defined as KCl−–Salt, and log![[thin space (1/6-em)]](https://www.rsc.org/images/entities/char_2009.gif) KCl−–Salt is set as the dependent variable. log
KCl−–Salt is set as the dependent variable. log![[thin space (1/6-em)]](https://www.rsc.org/images/entities/char_2009.gif) KCl−–Salt is calculated by the formula as follows.
KCl−–Salt is calculated by the formula as follows.
 | (1) |
The results of range are analyzed according to the results shown in table above, the significance of various factors on the chloride ion gas–solid phase distribution coefficient can be compared from the size of N value. The order is: N1 (0.781) > N2 (0.611) > N3 (0.366) > N6 (0.211) > N5 (0.079) > N4 (0.03), that is to say temperature is the most dominant influencing factor for chloride ion gas–solid phase distribution coefficient, followed by pH and Cl− concentration. As for the cations containing in the water, Mg2+ is the most significant one, followed by Ca2+ and Na+, compared with temperature and pH, the others are secondary. Therefore, in the actual operation process, the temperature and pH should be properly regulated during the evaporation process of desulfurization wastewater in order to relieve the harm caused by chloride ion gas phase transformation (Table 3).
| Factors | T (A) °C | pH (B) | Cl− (C) mol L−1 | Na+ (D) mol L−1 | Ca2+ (E) mol L−1 | Mg2+ (F) mol L−1 |
|---|---|---|---|---|---|---|
| Kij | 0.067 | 0.843 | 0.731 | 0.582 | 0.609 | 0.443 |
| Kij | 0.582 | 0.708 | 0.692 | 0.560 | 0.553 | 0.498 |
| Kij | 0.753 | 0.466 | 0.430 | 0.552 | 0.557 | 0.654 |
| Kij | 0.848 | 0.232 | 0.395 | 0.555 | 0.530 | 0.654 |
| Nj | 0.781 | 0.611 | 0.336 | 0.03 | 0.079 | 0.211 |
The horizontal values Kij of six factors are analyzed. The Kij is the average of experimental results for each group of factors, it stands for different levels effects of each factor on chloride ion gas–solid phase distribution. It can be seen from the table that in the factor of temperature, K41 > K31 > K21 > K11; in the pH factor, K12 > K22 > K32 > K42; as for the Cl− concentration, K13 > K23 > K33 > K43; in Na+ concentration, K14 > K24 > K44 > K34; in Ca2+ factor, K15 > K35 > K25 > K45; in the factor of Mg2+ concentration, K46 > K36 > K26 > K16. So, the optimal technological parameters for reducing the chloride ion gas–solid phase distribution coefficient are in the following, i.e., temperature 200 °C, pH 9.0, Cl− concentration 0.04 mol L−1, Na+ concentration 0.03 mol L−1, Ca2+ concentration 0.04 mol L−1 and Mg2+ concentration 0.01 mol L−1. The minimum value of log![[thin space (1/6-em)]](https://www.rsc.org/images/entities/char_2009.gif) KCl−–Saltmin is −1.80 measured by experiment.
KCl−–Saltmin is −1.80 measured by experiment.
The analysis results of variance when confidence values level a = 0.1, 0.05 and 0.01 are shown in Table 4. As seen from the table, F0.01 > FT > F0.05, therefore, temperature is a very significant factor. However, the other factors are significant only when the confidence values level a = 0.1 that they belong to significant factors. In practical application, temperature regulation should be strengthened to reduce the gas phase distribution of chloride ion.
| Factors | Sum of deviance square | Degree of freedom | F ratio | Critical value Fa=0.1 | Significance |
|---|---|---|---|---|---|
| T | 2.909 | 3 | 4.337 | −1.000 | ****** |
| pH | 1.747 | 3 | 2.604 | −1.000 | ***** |
| Cl- | 0.726 | 3 | 1.082 | −1.000 | **** |
| Na+ | 0.004 | 3 | 0.006 | −1.000 | * |
| Ca2+ | 0.027 | 3 | 0.040 | −1.000 | ** |
| Mg2+ | 0.282 | 3 | 0.420 | −1.000 | *** |
| Errors | 6.04 | 27 |
| Factors | Sum of deviance square | Degree of freedom | F ratio | Critical value Fa=0.05 | Significance |
|---|---|---|---|---|---|
| T | 2.909 | 3 | 4.337 | 2.960 | * |
| pH | 1.747 | 3 | 2.604 | 2.960 | |
| Cl- | 0.726 | 3 | 1.082 | 2.960 | |
| Na+ | 0.004 | 3 | 0.006 | 2.960 | |
| Ca2+ | 0.027 | 3 | 0.040 | 2.960 | |
| Mg2+ | 0.282 | 3 | 0.420 | 2.960 | |
| Errors | 6.04 | 27 |
| Factors | Sum of deviance square | Degree of freedom | F ratio | Critical value Fa=0.01 | Significance |
|---|---|---|---|---|---|
| T | 2.909 | 3 | 4.337 | 4.600 | |
| pH | 1.747 | 3 | 2.604 | 4.600 | |
| Cl- | 0.726 | 3 | 1.082 | 4.600 | |
| Na+ | 0.004 | 3 | 0.006 | 4.600 | |
| Ca2+ | 0.027 | 3 | 0.040 | 4.600 | |
| Mg2+ | 0.282 | 3 | 0.420 | 4.600 | |
| Errors | 6.04 | 27 |
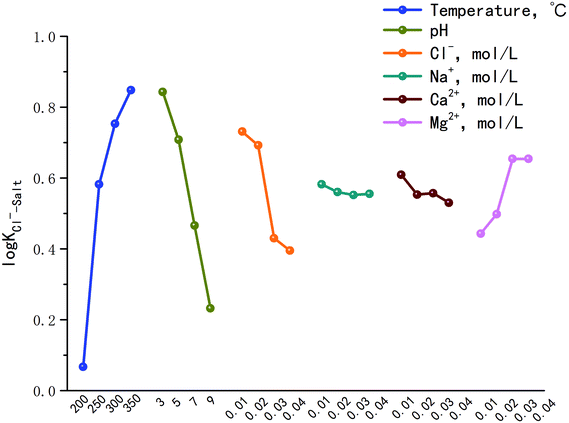
Fig. 2 is the factors analysis on the chloride ion gas–solid phase distribution coefficient.
It can be seen from Fig. 2 that:
(1) The log![[thin space (1/6-em)]](https://www.rsc.org/images/entities/char_2009.gif) KCl−–Salt = 0.067 when the temperature is 200 °C, and increases to 0.848 as the temperature reaches 350 °C. It illustrates that chloride ion gas–solid distribution coefficient increases with the increasing temperature. With the increase of pH, log
KCl−–Salt = 0.067 when the temperature is 200 °C, and increases to 0.848 as the temperature reaches 350 °C. It illustrates that chloride ion gas–solid distribution coefficient increases with the increasing temperature. With the increase of pH, log![[thin space (1/6-em)]](https://www.rsc.org/images/entities/char_2009.gif) KCl−–Salt shows a decrease trend, the factor is 0.843 when pH is 3.0, and it turns to 0.232 when pH is 9.0. Improving the concentration of Cl− will also lead to the decrease of log
KCl−–Salt shows a decrease trend, the factor is 0.843 when pH is 3.0, and it turns to 0.232 when pH is 9.0. Improving the concentration of Cl− will also lead to the decrease of log![[thin space (1/6-em)]](https://www.rsc.org/images/entities/char_2009.gif) KCl−–Salt. It is necessary to clarify the gas phase distribution mechanism of chloride ion in high temperature liquid phase: chloride ion usually volatilizes to the gas phase in the form of HCl and NH4Cl, but in low ammonia phenomenon, the main species is HCl. When the concentration of H+ in liquid phase agent is low, H+ mainly derives from the high temperature ionization of H2O itself and the reaction is as follows:
KCl−–Salt. It is necessary to clarify the gas phase distribution mechanism of chloride ion in high temperature liquid phase: chloride ion usually volatilizes to the gas phase in the form of HCl and NH4Cl, but in low ammonia phenomenon, the main species is HCl. When the concentration of H+ in liquid phase agent is low, H+ mainly derives from the high temperature ionization of H2O itself and the reaction is as follows:
| H2O ⇌ H+ + OH− | (2) |
| H+ + Cl− = HCl↑ | (3) |
Under the condition of constant temperature, the main internal influencing factors of the above reaction are pH and Cl− concentration while the water contains without other impurities. When pH decreases, reaction (2) is the control step. Although it can cause the reverse movement of reaction (1) and the ionization of H2O is blocked, the total amount of free H+ in the liquid phase is increased that provides adequate cation for gas phase transformation of HCl. When there is sufficient Cl−, the reaction strength of H+ and Cl− combination will improve. When Cl− concentration improves, reaction (1) becomes the control step that does not affect the chemical equilibrium, it just provides enough anions for the gas phase transformation of HCl. When the temperature condition is constant, the free H+ in the liquid phase is invariant, namely Cl− is excessive relative to H+. The macro performance is the increase of Cl− concentration makes the decrease of log![[thin space (1/6-em)]](https://www.rsc.org/images/entities/char_2009.gif) KCl−–Salt.
KCl−–Salt.
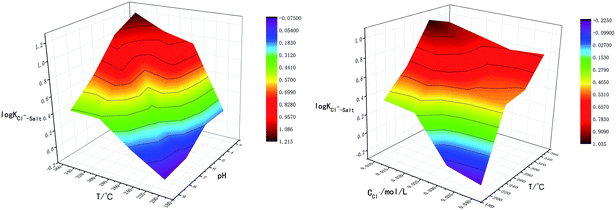
The reactions above are also influenced by external factors, especially temperature. The interactions between T-pH and T-Cl− concentration were studied in order to analyze the influence of temperature on chloride ion gas phase transformation comprehensively, the results are shown in Fig. 3. The results are similar to the single-factor experiment, log![[thin space (1/6-em)]](https://www.rsc.org/images/entities/char_2009.gif) KCl−–Salt reached the minimum value when temperature was 200 °C, pH was 9.0 and Cl− concentration was 0.04 mol L−1. The effect of temperature on the gas phase transformation of chloride ion can be mainly reflected by mechanism that the temperature rise cannot promote the movement of chemical equilibrium. However, temperature rise will accelerate the reaction rate of H2O ionization, lead to increase the amount of free H+, thus chloride ion gas phase transformation is improved ultimately.
KCl−–Salt reached the minimum value when temperature was 200 °C, pH was 9.0 and Cl− concentration was 0.04 mol L−1. The effect of temperature on the gas phase transformation of chloride ion can be mainly reflected by mechanism that the temperature rise cannot promote the movement of chemical equilibrium. However, temperature rise will accelerate the reaction rate of H2O ionization, lead to increase the amount of free H+, thus chloride ion gas phase transformation is improved ultimately.
(2) The influences of main cations in desulfurization wastewater such as Na+, Ca2+ and Mg2+ on the chloride ion gas–solid phase distribution coefficient are discussed. It can be seen from Fig. 2 that with the increase of Mg2+ concentration, log![[thin space (1/6-em)]](https://www.rsc.org/images/entities/char_2009.gif) KCl−–Salt increased first, then maintains constant, the maximum value was 0.654 when Mg2+ concentration was 0.03 mol L−1. However, Na+ and Ca2+ inhibited the gas phase transformation of chloride ion and the difference between the two factors were not obvious. Why the three cations have different effects on log
KCl−–Salt increased first, then maintains constant, the maximum value was 0.654 when Mg2+ concentration was 0.03 mol L−1. However, Na+ and Ca2+ inhibited the gas phase transformation of chloride ion and the difference between the two factors were not obvious. Why the three cations have different effects on log![[thin space (1/6-em)]](https://www.rsc.org/images/entities/char_2009.gif) KCl−–Salt? The reasons should be analyzed from two stages: liquid phase reaction and solid phase reaction.
KCl−–Salt? The reasons should be analyzed from two stages: liquid phase reaction and solid phase reaction.
Liquid phase reaction stages: for Na+, Ca2+ and Mg2+, there are two kinds of effects namely hydrolysis and cations attraction in solution. First, the three ions have different degrees of hydrolysis under high temperature conditions. Reactions are as follows:
| NaCl + 2H2O ⇌ NaOH + HCl↑ | (4) |
| CaCl2 + 2H2O ⇌ Ca(OH)2 + 2HCl↑ | (5) |
| MgCl2 + 2H2O ⇌ Mg(OH)2 + 2HCl↑ | (6) |
Ca2+ and Mg2+ own stronger hydrolysis ability, but Na+ is weaker that can even ignore. Meanwhile, Na+, Ca2+ and Mg2+ all have certain attraction to Cl− when the three species exist in form of free phase in solution, they will block the binding of Cl− to free H+ and inhibit formation and gas phase transition of HCl. From the perspective of theory of ionic attraction, the anions and cations in the liquid phase are regarded as stationary point charges in the ideal liquid phase, according to the Coulombs law:
 | (7) |
In the formula, k represents the electrostatic constant, the value is 9.0 × 10⁹ Nm2 C−2; Q1 and Q2 are charged quantity of point charges; r is the distance between two point charges. In liquid phase agent, the attraction order of the three cations to Cl− is Na+ < Ca2+ < Mg2+, namely the effect of inhibition on gas phase transformation of chloride ion is Na+ < Ca2+ < Mg2+.
Solid phase reaction stages: after the liquid phase reaction stages, NaCl itself does not form new substances; the evaporation product also exists in form of NaCl crystal. However, hydration occurs during evaporations of CaCl2 and MgCl2, hydrated magnesium chloride and hydrated calcium chloride are precipitated at high temperature respectively. In addition to the dehydration reaction, the solid hydrated magnesium chloride also produces hydrolysis reaction to form HCl in high temperature environment, while hydrated calcium chloride only loses crystal water. The XRD diagram of hydrated magnesium chloride and hydrated calcium chloride after evaporation at high temperature are shown in Fig. 4, the intermediate product MgOHCl is detected after hydrolysis of hydrated magnesium chloride.28,29
| MgCl2·nH2O → MgOHCl + HCl + H2O | (8) |
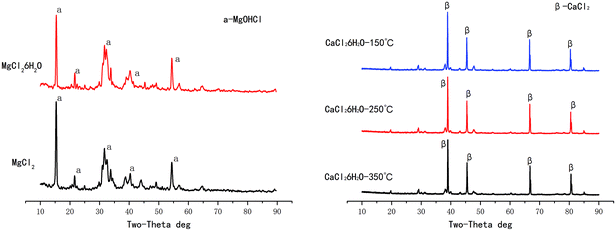 | ||
| Fig. 4 The XRD diagram of hydrated magnesium chloride and hydrated calcium chloride after evaporation at high temperature. | ||
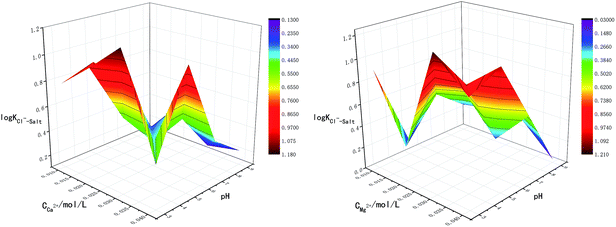
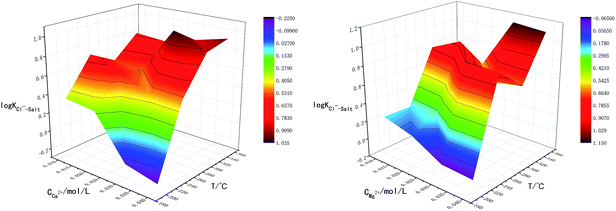
The main factors affecting the above reaction (5) and (6) are concentrations of Ca2+, Mg2+ and OH−. The interaction between pH-Ca2+ and pH-Mg2+ on log![[thin space (1/6-em)]](https://www.rsc.org/images/entities/char_2009.gif) KCl−–Salt was explored in this experiment as shown in Fig. 5. It can be seen that the interaction between pH-Ca2+ and pH-Mg2+ is very complex. The increase of pH will increase the concentration of OH− in the liquid phase, thus causing the chemical equilibriums of reaction (5) and (6) to move reversely, inhibiting the hydrolysis of Ca2+ and Mg2+ from forming HCl. The reason for the complex interaction is that the increase of OH− concentration will affect the solubility of Ca2+ and Mg2+ in the liquid phase. Under the common influence of the three functions of electrostatic attraction, hydrolysis and solubility, it is hardly to draw a unified conclusion now.
KCl−–Salt was explored in this experiment as shown in Fig. 5. It can be seen that the interaction between pH-Ca2+ and pH-Mg2+ is very complex. The increase of pH will increase the concentration of OH− in the liquid phase, thus causing the chemical equilibriums of reaction (5) and (6) to move reversely, inhibiting the hydrolysis of Ca2+ and Mg2+ from forming HCl. The reason for the complex interaction is that the increase of OH− concentration will affect the solubility of Ca2+ and Mg2+ in the liquid phase. Under the common influence of the three functions of electrostatic attraction, hydrolysis and solubility, it is hardly to draw a unified conclusion now.
What's more, another essential condition that affecting the reaction rates of (5), (6) and (8) is temperature. The interaction between T-Ca2+ concentration and T-Mg2+ concentration was carried out for comprehensive analysis about the influence of temperature on chloride ion gas phase transformation. The results are shown in Fig. 6. The increase of temperature will accelerate hydrolysis of forming HCl in different salt systems, as for hydrated magnesium chloride, the hydrolysis of solid phase can also be accelerated with the increasing temperature, thus leading to the increase of log![[thin space (1/6-em)]](https://www.rsc.org/images/entities/char_2009.gif) KCl−–Salt.
KCl−–Salt.
4 Model of chloride ion gas–solid distribution coefficient
4.1 Fitting of empirical model
The experimental data of orthogonal experiment were used as the source data. Multivariate nonlinear regression function of NLINFIT and multiple linear regression function of REGRESS in MATLAB were used to calculate the fitting model, empirical formula were gotten as three forms showed in Table 5.30–32 The results indicate that fitting degree R2 (1) is 0.8158 and R2 (2) is 0.8083, R2 (3) is maximum with the value 0.9258, it illustrates that the form 3 is the most accurate and meets the calculation precision requirements.The REGRESS function was adopted to determine the parameters in the model. Finally, an empirical model of chloride ion gas–solid distribution coefficient was obtained as shown in formula (9):
 | (9) |
4.2 Correction of constant in theoretical model
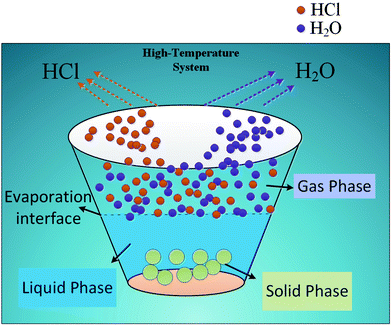
According to the theoretical model of mass transfer separation process, the chloride ion gas phase transformation was simplified as the mass transfer, heat transfer and separation process between HCl and H2O in the ideal HCl–H2O system, the ideal mechanism is shown in Fig. 7.33–35The gas–solid phase distribution coefficient of chloride ion is defined as the ratio of KHCl to KH2O, and the gas–solid distribution coefficient of chloride ion in HCl–H2O system can be obtained:
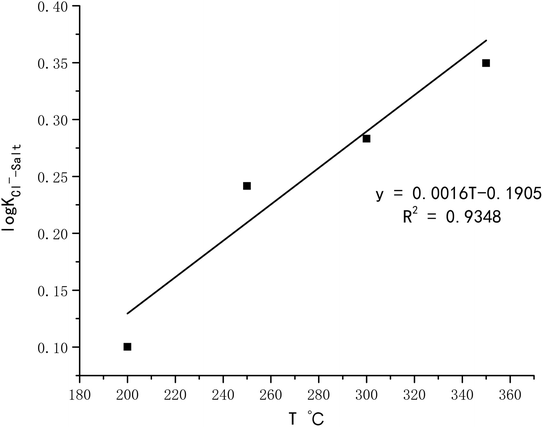
 | (10) |
exp(log![[thin space (1/6-em)]](https://www.rsc.org/images/entities/char_2009.gif) KHCl–H2O) = 0.0023T − 0.334 KHCl–H2O) = 0.0023T − 0.334
| (11) |
When the ideal system switches to desulfurization wastewater, the ideal state was replaced by actual system (referred to as Cl−–Salt system), the gas–solid phase distribution coefficient in actual Cl−–Salt system was listed as follows:
 | (12) |
The final chloride ion gas–solid phase distribution coefficient model is showed in the form of formula (13):
 | (13) |
| ε = 1.068, φ = 0.0016T − 0.1905–0.1101pH − 11.35[Cl−] − 7.7[Na+] + 4.39[Ca2+] + 1.94[Mg2+] |
The comparison of the calculated results for the heterogeneous distribution coefficient of chloride ion with the other similar studies is shown in Table 6. It can be obviously seen that the experiment object of this study is aimed at the distribution of chloride ion between gas and solid phase, while the other researches focused on gas and liquid phase. The minimum temperature of the model is moderate and the maximum temperature is increased according to comparison. What's more, besides the temperature variable, the density of the liquid phase agent was used as the correction term. In this study, the temperature variables are integrated into the gas–liquid equilibrium theory, and the correction constant of model contain essential influencing factors on chloride ion gas phase transformation which is more suitable for actual operating conditions.
5 Conclusions
In this paper, the factors analysis on the gas–solid phase distribution coefficient of chloride ion was detected. The comparisons on the interaction and significance of each factor were analyzed by range and variance analysis. Finally, an integrated chloride ion gas–solid phase distribution coefficient model was obtained ranging from 180 °C to 380 °C through data fitting, the conclusions obtained are as follows:(1) Temperature is the most dominant influencing factor for chloride ion gas–solid phase distribution coefficient, followed by pH. In practical application, temperature regulation and pH control should be strengthened to reduce the gas phase distribution of chloride ion.
(2) The chloride ion gas–solid distribution coefficient increases with the increasing temperature, Mg2+ concentration and the decreasing pH, but decreases with the increasing concentrations of Cl−, Ca2+ and Na+.
(3) Based on the phase equilibrium theory and state equation, chloride ion gas–solid phase distribution coefficient model was calculated ranging from 180 °C to 380 °C, which can be used to predict the chloride ion volatilization in practical application.
Conflicts of interest
There are no conflicts to declare.Acknowledgements
The authors are thankful for the financial support of National Key R&D Program of China (2018YFB0604305-01) and Central University Foundation of North China Electric Power University (2017XS124).References
- H. Zhang, X. F. Zhao and W. D. Zhong, Electr. Power Surv. Des., 2013, 6, 39–44 Search PubMed.
- C. Brogren and H. T. Karlsson, Chem. Eng. Sci., 1997, 52, 3101–3106 CrossRef.
- USEPA, Pilot plant tests of chloride ion effects on wet FGD system performance, Washington, September, 1984 Search PubMed.
- P. Córdoba, Fuel, 2015, 144, 274–286 CrossRef.
- S. Kiil, H. Nygaard and J. E. Johnsson, Chem. Eng. Sci., 2002, 57, 347–354 CrossRef.
- USEPA, Steam electric power generating point source category: Final detailed study report, Washington, October, 2009 Search PubMed.
- Y. H. Huang, P. K. Peddi and C. Tang, Sep. Purif. Technol., 2013, 118, 690–698 CrossRef.
- Y. H. Huang, P. K. Peddi and H. Zeng, Water Sci. Technol., 2013, 67, 239–246 CrossRef PubMed.
- L. Cui, G. Li and Y. Li, Chem. Eng. Res. Des., 2017, 1, 240–247 CrossRef.
- Y. Na, L. Fei and Z. Zhong, Ind. Eng. Chem. Res., 2010, 49, 3337–3341 CrossRef.
- Ministry of environmental protection of China, http://zfs.mep.gov.cn/fg/gwyw/201504/t20150416_299146.htm, (accessed April 2015).
- S. Hoque, T. Alexander and P. L. Gurian, IDA J. Desalin. Water Reuse, 2010, 2, 72–78 CrossRef.
- B. Pakzadeh and J. Wos, Flue gas desulfurization wastewater treatment for coal-fired power industry, ASME Power Conference, Baltimore, Maryland, America, 2014 Search PubMed.
- W. A. Shaw, Power, 2008, 152, 60–63 Search PubMed.
- H. Shintaro, S. Takeo, N. Yoshio, MHI wet-FGD waste water treatment technologies, available at http://www.aecom.com/wp-content/uploads/2012/03/MHI-Wet-FGD-Waste-Water-Treatment-Technologies-102-AWMA-Paper.pdf, 2012 (accessed 20.12.3).
- C. Mosti and V. Cenci, ZLD systems applied to ENEL coal-fired power plants, VGB PowerTech., 2012, 92, 1–5 Search PubMed.
- S. Ma and J. Chai, Renewable Sustainable Energy Rev., 2016, 58, 1143–1151 CrossRef.
- Ministry of Environmental Protection of China, http://www.mep.gov.cn/gkml/hbb/bgg/201701/t20170117_394809.htm, (accessed October 2017).
- J. M. Simonson and A. P. Donald, Geochim. Cosmochim. Acta, 1993, 57, 1–7 CrossRef.
- J. M. Simonson and A. P. Donald, Geotherm. Resour. Counc., Trans., 1998, 22, 20–23 Search PubMed.
- J. M. Simonson and D. A. Palmer, Office Sci. Tech. Inf. Tech. Rep., 1997, vol. 4, pp. 1–7 Search PubMed.
- M. S. Gruszkiewicz, S. L. Arshall and D. A. Palmer, The Partitioning of Acetic, Formic, and Phosphoric Acids Between Liquid Water and Steam, Office of Scientific Technical Information Technical Reports, Washington, US, 1999 Search PubMed.
- S. Q. Zhou and T. Alan, Steam Turbine Operating Conditions, Chemistry of Condensates, and Environment Assisted Cracking – A Critical Review, NPL Report MATC, Washington, US, 2002 Search PubMed.
- M. S. Guszkiewicz, D. B. Joyce and S. L. Marshall, The Partitioning of Acetate, Formate and Phosphates Around the Water/Steam Cycle. Office of Scientific Technical Information Technical Reports, Washington, US, 2000 Search PubMed.
- C. K. Liu, Group-contribution methods in estimating liquid-liquid partitioning coefficients. Texas Tech. University, 1981.
- S. Ma and W. Yu, J. Chin. Soc. Power Eng., 2016, 36, 894–900 Search PubMed.
- J. Otakar, Effective cycle chemistry control, ESAA Power Station Chemistry Conference, Rockhampton Queensland, Australia, 2000 Search PubMed.
- K. NejadS, R. Harris and K. W. Ng, Metall. Mater. Trans. B, 2005, 35, 405–406 Search PubMed.
- K. NejadS and R. Harris, Magnesium Technol. Global Age, Proc. Int. Symp., 2006, 1, 81–92 Search PubMed.
- A. Q. Rocío and M. A. García, Behav Res Methods, 2013, 45, 972 CrossRef PubMed.
- J. B. Whitney and A. L. Hill, Nature, 2014, 512, 74 CrossRef PubMed.
- B. L. White and H. M. Nepf, Water Resour. Res., 2008, 44, 1–15 CrossRef.
- J. M. Smith, Introduction to chemical engineering thermodynamics. McGraw-Hill, US, 1987 Search PubMed.
- J. M. Walas. Phase Equilibria in Chemical Engineering, Butterworth Publishers, Boston, US, 1985 Search PubMed.
- K. C. Chao and R. A. Greenkorn, Thermodynamics of Fluids an Introduction to Equilibrium Theory, Marcel Dekker Inc, New York, US, 1975 Search PubMed.
| This journal is © The Royal Society of Chemistry 2018 |

