 Open Access Article
Complimentary effects of annealing temperature on optimal tuning of functionalized carbon–V2O5 hybrid nanobelts for targeted dual applications in electrochromic and supercapacitor devices†
Remya Narayanan *a,
Anweshi Dewana and
Debanjan Chakrabortyb
aCenter of Energy Sciences and Department of Physics, Indian Institute of Science Education and Research, Pune – 411008, India. E-mail: remyan@iiserpune.ac.in
bDepartment of Chemistry, Indian Institute of Science Education and Research, Pune – 411008, India
First published on 26th February 2018
Abstract
Herein, carbon nanosphere-decorated vanadium pentoxide (C@V2O5) hybrid nanobelts were grown via a single step hydrothermal route with improved electronic conductivity as compared to that of pristine oxide. This hybrid nanomaterial exhibits different complimentary ranges of optimum post-growth annealing temperatures, which are suitable for dual applications either in electro-chromic smart windows or in supercapacitors. C@V2O5 nanobelts annealed at 350 °C appear to favor electro-chromic applications. They exhibit maximum dynamic optical transmission modulation as they switch from yellow to dark green, fast switching response, and high visible transmittance. In contrast, C@V2O5nanobelts annealed at 250 °C have been found to be most suitable for supercapacitor applications. They display a high specific capacity and an enhanced diffusion coefficient. Moreover, they exhibit long lifetimes with a capacity retention of ∼94% even after 5000 cycles of operation. Therefore, the obtained results clearly indicate that optimization of the post-growth annealing temperatures is very important and rather complementary in nature in terms of determining the most favorable device functionalities. It enables us to optimally tune these hybrid nanomaterials for targeted, device-specific, energy applications in either electrochromic or supercapacitor technologies simply based on the annealing temperature alone.
1. Introduction
Electroactive films can intercalate guest species, such as lithium, sodium, and potassium ions, and these can be used for energy storage devices, fuel cells, and electrochromic displays.1–3 Among various transition metal oxides, V2O5 is considered as one of the most important transition metal oxide and an active lithium-ion intercalation host. It has been exhaustively studied as an electrochromic material and also as an electrode material for battery and supercapacitor applications4–7 owing to its layered crystal structure, high energy density, multivalent oxidation states, and low cost. V2O5 changes its optical transmittance between coloured and bleached states upon charge insertion and extraction;8 thus, it is also recommended for use in electrochromic films to control sunlight through windows for building-integrated energy saving applications.9,10 However, practical applications of V2O5-based electrode materials for supercapacitor and electrochromic devices are hampered by the low electrical and ionic conductivity, slow lithium ion diffusion, and poor structural stability of V2O5.11–13To improve the Li-ion intercalation kinetics in V2O5 layers, the most common approach is forming hybrids using various carbon nanostructures or electronically conductive polymers.14–16 A combination of carbon allotropes and their derivatives with different nanostructures of V2O5 can significantly improve the surface area as well as the conductivity of the composite. The hybrid can reduce volume changes due to ion intercalation/de-intercalation. Thus, it ensures better cycling stability and prevents agglomeration of the metal oxide nanoparticles.17–19 Activated carbon, carbon nanotubes, and graphene have been widely investigated to improve the conductivity of V2O5. Recently, enhanced electrochemical energy storage achieved using nanostructures of the V2O5/graphene composite due to the combined effects of pseudocapacitance and double layer capacitance has been reported.20,21 The V2O5/f-MWCNT hybrid nanocomposite provides an excellent energy density of 57 W h kg−1 and better rate capability.22
V2O5/graphene nanocomposite films have been found to expand the optical modulatory range in the visible region by exploiting the enhanced intercalation properties of Li+ ions.23 A Mg-doped V2O5 film exhibited superior transmittance modulation over pristine V2O5.24 Silver vanadium oxide-based electrochromic devices show 60% transmittance contrast, whereas the V2O5 nanowires exhibit only 25% transmittance contrast.25 In another study, a V2O5–poly(aniline) or PANI hybrid was synthesized using a layer-by-layer assembly method, and the authors obtained superior performances in terms of electrochromic contrast and charge storage capacity for the hybrid.26
Chemical composition, crystallinity, and morphology have been found to have a significant effect on the lithium ion intercalation/de-intercalation capacities.27,28 A larger interlayer spacing facilitates Li+ diffusion within the V2O5 matrix.29,30 It has been found that V2O5 films can possess significantly different lithium ion intercalation properties and cyclic stability when annealed under different conditions. A N2-annealed V2O5 sample possesses better lithium ion storage capacity in contrast to air-annealed films.31
In the present study, we have synthesized single-step C-nanosphere-decorated V2O5 nanobelts (C@V2O5) by a facile low-temperature hydrothermal process. The presence of carbon nanospheres on the surface of V2O5 nanobelts significantly improves the electrical conductivity of the hybrid. We have demonstrated that the C@V2O5nano-hybrid exhibits dual characteristics suitable for both supercapacitor and electrochromic window applications. Interestingly, this device-specific optimization depends crucially on the final ex situ annealing temperature of the nanohybrid material. C@V2O5 that was annealed at 350 °C appeared to favour electrochromic applications rather than supercapacitor applications. This C@V2O5@350 exhibits a transmission modulation of 25% and 30% at 620 and 790 nm, respectively, which is superior to the devices based on pristine V2O5 and C@V2O5 annealed at other temperatures. However, C@V2O5 annealed at 250 °C has been found to be an excellent candidate for supercapacitor applications. The cumulative effect of the conductive carbon nanodots and V2O5 nanobelts with a large surface area actually delivers a specific capacitance of 260 F g−1 at 1 A g−1, which is ∼78% higher than that of similar devices based on pristine V2O5 and ∼40% higher than that of the unannealed C@V2O5.
These results clearly indicate that the post-growth annealing temperature can be a powerful tool in nanotechnology. This can allow us to adequately functionalize these nanohybrids for two different energy applications. Thus, we can easily tune the specific characteristics of the same nanomaterial suitable for use either in electrochromic film-based windows in building-integrated devices or as supercapacitor electrodes with a comparatively higher specific capacitance.
2. Experimental
2.1 Materials and chemicals
Vanadium pentoxide (V2O5), glucose, propylene carbonate (PC), and acetone were obtained from Merck. Lithium perchlorate (LiClO4, purity > 98%) was procured from Sigma-Aldrich. Deionized water (DI) was obtained from the Millipore Direct-Q3 system. Transparent SnO2:F (FTO)-coated glass substrates with a sheet resistance of about 15 Ω sq−1 were purchased from Sigma-Aldrich, washed with a soap solution, flushed with a copious amount of water, and finally rinsed with acetone before use.2.2 Synthesis of C@V2O5 nanoflakes
Carbon-coated V2O5 nanobelts were synthesized using a simple procedure previously reported in literature.32 The molar ratios of V2O5 and glucose were fixed as 0.75![[thin space (1/6-em)]](https://www.rsc.org/images/entities/char_2009.gif) :
:![[thin space (1/6-em)]](https://www.rsc.org/images/entities/char_2009.gif) 1, and V2O5 and glucose were dispersed in 40 mL of DI water and then stirred vigorously for 1 h at room temperature. The resulting yellow coloured suspension was transferred into a 50 mL Teflon lined autoclave and maintained at 140 °C for 5 h in a vacuum oven. The obtained products were centrifuged, washed, and dried at 60 °C for 12 h. The final precipitates were dark green in colour and labelled as C@V2O5.
1, and V2O5 and glucose were dispersed in 40 mL of DI water and then stirred vigorously for 1 h at room temperature. The resulting yellow coloured suspension was transferred into a 50 mL Teflon lined autoclave and maintained at 140 °C for 5 h in a vacuum oven. The obtained products were centrifuged, washed, and dried at 60 °C for 12 h. The final precipitates were dark green in colour and labelled as C@V2O5.
The V2O5 films were prepared by spin coating over FTO substrates. The resulting films were dried in air at room temperature. The as-deposited C@V2O5 was annealed in air at different temperatures, i.e. 250, 300, 350, and 400 °C, for 3 hours to improve the crystallinity of the material and then cooled down naturally. The films annealed at ≥300 °C appear yellow in color.
2.3 Material characterization
The surface morphology and structure of all the films were investigated by field emission scanning electron microscopy (FESEM, Zeiss Ultra Plus), transmission electron microscopy (TEM) (FEI Tecnai T20 with an FEG source operating at 220 kV), X-ray diffraction (XRD, Bruker D8 Advance X-ray diffractometer with Cu Kα radiation (1.54 Å)). XPS was conducted using a PHI 5000 VersaProbe II equipped with a monochromatic Al Kα (1486.6 eV), an X-ray source, and a hemi-spherical analyser. Appropriate electrical charge compensation was employed, and Raman spectroscopy (LabRAM HR 800 (HORIBA Jobin Yvon)) and vibrational spectroscopic studies for all the films were carried out using a Thermo Scientific system; moreover, thermogravimetric analysis (TGA) data were obtained using the thermal analysis instrument NETZSCH STA 449F1 at the heating rate of 10 °C min−1 from room temperature to 800 °C. The optical transmission spectra were obtained using the Shimadzu UV-3600 Plus UV-Vis-NIR spectrophotometer. Switching time characteristics for the films between coloured and bleached states were determined using an automated, home built setup consisting of a quartz-tungsten-halogen lamp from Newport, monochromator (Princeton Instruments SP2500), a Si photodetector (FDS 1010), and custom-mode microprocessor-controlled versatile units (Lock-in-Amplifier SR850, Low Noise Current Preamplifier SR570) hooked with a computer. The electrochemical properties of all the films were investigated using a standard three-electrode system with a large surface area platinum (Pt) mesh as the counter electrode, Ag/AgCl as the reference electrode, and pristine and C@V2O5 at different annealing temperatures deposited over FTO as the working electrode. LiClO4 in PC (1 M) acted as an electrolyte during all the measurements. Cyclic voltammetry (CV), galvanostatic charge discharge characteristics (GCD), and electrochemical impedance spectroscopy (EIS) measurements were performed using a PAR potentiostat/galvanostat (model PARSTAT 2273).3. Result and discussion
3.1 Morphological and structural characterization
The FESEM images clearly show that the morphology of C@V2O5 is greatly affected by the annealing temperature and the presence of carbon nanospheres. Pristine V2O5 is well crystallized with short grains and appears as a rod with a size of ∼1 μm, whereas the carbon nanosphere-coated V2O5 has a predominant nanobelt like morphology (Fig. 1a). As has been discussed earlier, the presence of glucose leads to the formation of these belts.32 However, it was observed that there was a significant change in morphology with the increasing annealing temperature. All these annealed films with a randomly aligned nanobelt kind of morphology have widths in the range of 40–100 nm, whereas their lengths extend over few micrometers. These nanostructures are organized in an overlapping assembly of each other and therefore are capable of exhibiting a higher surface area, which in turn can enhance the Li ion intake. The thickness of the nanobelts of the sample annealed at 350 °C decreased significantly to ∼40–50 nm. The presence of a carbon nanosphere is expected to improve the electronic conductivity of the hybrid material. The FESEM images of the as-prepared C-dot shows that it appears to be fairly uniform and monodisperse with diameters in the range of 200–220 nm under similar experimental conditions (Fig. s1†). Material specific energy dispersive X-ray spectroscopy (EDS) analyses were conducted by obtaining multiple spectra over different regions of the samples (Fig. 1f and g). The spectra show dominant patches of vanadium, oxygen, and carbon within C@V2O5. For the films annealed at ≥300 °C, the estimated atomic ratio of V and O is ∼1![[thin space (1/6-em)]](https://www.rsc.org/images/entities/char_2009.gif) :
:![[thin space (1/6-em)]](https://www.rsc.org/images/entities/char_2009.gif) 5, whereas for C@V2O5@250, the ratio is 1
5, whereas for C@V2O5@250, the ratio is 1![[thin space (1/6-em)]](https://www.rsc.org/images/entities/char_2009.gif) :
:![[thin space (1/6-em)]](https://www.rsc.org/images/entities/char_2009.gif) 3.3. Annealing at higher temperatures under an ambient atmosphere can actually supply ample amounts of oxygen, which in turn leads to the formation of the pure V2O5 crystalline phase. The high resolution TEM images evidence the presence of a thin layer of carbon, which covers the surface of the V2O5 nanobelts (Fig. 2). The lattice scale images of C@V2O5@250 show an inter-fringe spacing of 0.58 nm, and this matches with the (200) plane of V2O5, whereas the inter-fringe spacing of 0.43 of C@V2O5@350 matches with the (001) plane of V2O5.
3.3. Annealing at higher temperatures under an ambient atmosphere can actually supply ample amounts of oxygen, which in turn leads to the formation of the pure V2O5 crystalline phase. The high resolution TEM images evidence the presence of a thin layer of carbon, which covers the surface of the V2O5 nanobelts (Fig. 2). The lattice scale images of C@V2O5@250 show an inter-fringe spacing of 0.58 nm, and this matches with the (200) plane of V2O5, whereas the inter-fringe spacing of 0.43 of C@V2O5@350 matches with the (001) plane of V2O5.
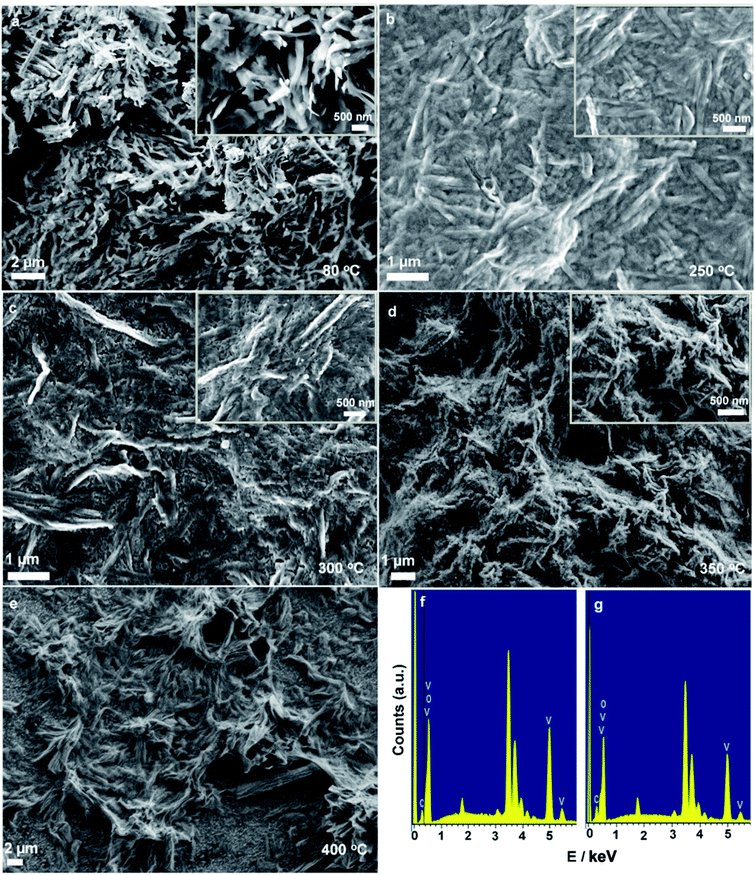 | ||
| Fig. 1 FE-SEM images show morphological changes of C@V2O5 nanobelts at different annealing temperatures (a, b, c, d, & e) and EDX plots of (f) C@V2O5@250 and (g) C@V2O5@350. | ||
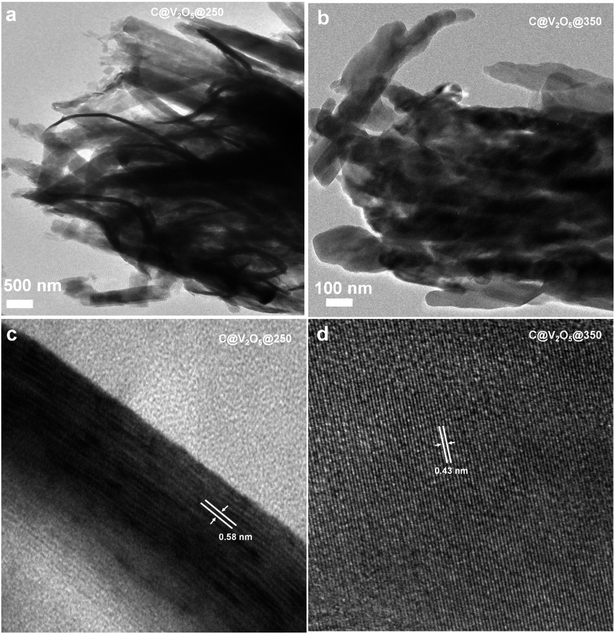 | ||
| Fig. 2 TEM and lattice scale images of C@V2O5@250 and C@V2O5@350 (a and b) and (c and d), respectively. | ||
The crystallinity and purity of the films were analysed using X-ray diffraction (XRD); Fig. 3 presents the respective XRD patterns of the films annealed at different temperatures ranging from 250 °C to 400 °C. The diffraction peaks of pristine V2O5 match well with the orthorhombic crystal structure of layered V2O5, in concurrence with the JCPDS file no. 41-1426. The unannealed C@V2O5 samples exhibit mixed +4 and +5 oxidation states of vanadium. In the presence of glucose, V5+ underwent partial reduction to form V4+. Since there is no other external reducing agent, glucose is speculated to be responsible for the reduction step. Moreover, glucose is polymerized into polysaccharides by intermolecular dehydration and finally carbonized into carbon dots under hydrothermal conditions. Nucleation starts when the solution reaches a critical supersaturation, and these C-dot nuclei grow uniformly until the final size is obtained. Dehydration and aromatization normally reduce the functional group, but still some functional groups remain attached to the carbon dots.32–35
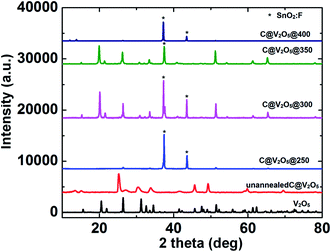 | ||
| Fig. 3 XRD pattern of pristine V2O5 and C@V2O5 at different annealing temperatures. Unannealed and C@V2O5@250 films show the mixed oxidation states. | ||
The diffraction peaks at 25.2° (102) and 33.73° (212) correspond to the tetragonal crystal structure of VO2 (JCPDS file no. 42-0876). On the other hand, the other diffraction peaks at d = 3.4 (110), 2.8 (400), 2.18 (400), 1.99 (411), 1.83 (112), 1.56 (412), and 1.34 (013) Å agree with the orthorhombic crystal structure of V2O5. Moreover, for the film annealed at 250 °C, the tetragonal phase of VO2 decreases significantly, and majority of the peaks originate from the orthorhombic crystal structure of V2O5. The film appears dark green in color, which is an indirect evidence of the presence of V4+ ions.36 The characteristics peaks of pristine V2O5 in the low 2θ regions 15.3° (200), 20.26° (001), and 21.7° (110) do not appear for C@V2O5@250. This suggests incomplete formation of α-V2O5. An increase in the annealing temperature increases the crystalline nature with the preferred orientation along the (001) plane of α-V2O5. The XRD pattern of the as-grown nanobelts at the annealed temperatures of 300 and 350 °C closely matched that of the standard orthorhombic V2O5 (JCPDS No. 41-1426 with the lattice constants a = 1.151 Å, b = 0.3565 Å, and c = 0.4372 Å). The films annealed at a temperature ≥ 300 °C appear yellow in color; this indicates the purity of the sample. It has already been reported that 300 °C is the necessary annealing temperature to induce phase transition in vanadium oxide.37
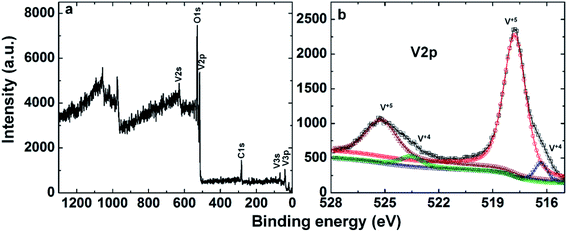
The XPS scan illustrating the presence of various elements, i.e. C, O, and V, is shown in Fig. 4a. The core levels of the valence state of vanadium (V) were also investigated by XPS measurements, as shown in Fig. 4b. The V 2p3/2 peak spectra of C@V2O5 demonstrate two peaks at 516.3 and 517.7 eV, which are attributed to the V4+ and V5+ components of the sample, respectively. The line width of V 2p1/2 is much broader than that of V 2p3/2 due to the Coster–Kronig Auger transitions.38 Moreover, two V 2p1/2 peaks observed at 523.5 and 525.1 eV are due to V4+ and V5+, respectively, confirming the presence of the V4+ state, which originates by the reduction of V5+.
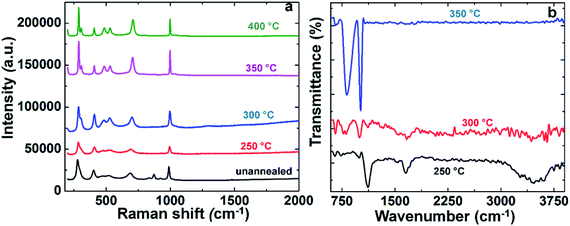
The respective Raman spectra of all the films are presented in Fig. 5a. The well-resolved Raman lines indicate the good crystallinity of the sample. Moreover, two lower frequency peaks located at 280 and 406 cm−1 are assigned to the bending vibrations of the V![[double bond, length as m-dash]](https://www.rsc.org/images/entities/char_e001.gif) O bonds. The band located at 306 cm−1 corresponds to the triply coordinated oxygen (V3–O) bonds, and this peak is fully formed for the C@V2O5 films annealed at 300, 350, and 400 °C, whereas for C@V2O5@250 °C, it is just slightly visible. The peak corresponding to 470 cm−1 is due to the bending vibrations of the doubly coordinated oxygen (V–O–V).39 On the other hand, the band at 530 cm−1 appearing for C@V2O5 at 300 °C, 350 °C, and 400 °C corresponds to the triply coordinated oxygen (V3–O) stretching mode, which results from edge-shared oxygen common to three pyramids. The band at 690 cm−1 can be assigned to the doubly coordinated oxygen (V2–O) stretching mode, which arises from the corner-shared oxygen common to two pyramids. The high frequency peak at 997 cm−1 is due to the (V5+
O bonds. The band located at 306 cm−1 corresponds to the triply coordinated oxygen (V3–O) bonds, and this peak is fully formed for the C@V2O5 films annealed at 300, 350, and 400 °C, whereas for C@V2O5@250 °C, it is just slightly visible. The peak corresponding to 470 cm−1 is due to the bending vibrations of the doubly coordinated oxygen (V–O–V).39 On the other hand, the band at 530 cm−1 appearing for C@V2O5 at 300 °C, 350 °C, and 400 °C corresponds to the triply coordinated oxygen (V3–O) stretching mode, which results from edge-shared oxygen common to three pyramids. The band at 690 cm−1 can be assigned to the doubly coordinated oxygen (V2–O) stretching mode, which arises from the corner-shared oxygen common to two pyramids. The high frequency peak at 997 cm−1 is due to the (V5+![[double bond, length as m-dash]](https://www.rsc.org/images/entities/char_e001.gif) O) terminal oxygen stretching mode, which results from an unshared oxygen.40 The C@V2O5 unannealed sample shows an additional peak at 880 cm−1, which is due to the stretching vibration of the V4+
O) terminal oxygen stretching mode, which results from an unshared oxygen.40 The C@V2O5 unannealed sample shows an additional peak at 880 cm−1, which is due to the stretching vibration of the V4+![[double bond, length as m-dash]](https://www.rsc.org/images/entities/char_e001.gif) O bond, indicating the presence of V4+; moreover, this peak is absent in the annealed samples.
O bond, indicating the presence of V4+; moreover, this peak is absent in the annealed samples.
Fig. 5b shows the FTIR spectra of the C@V2O5@ film at the annealing temperatures of 250, 300, and 350 °C. All these films exhibit bands at 656 cm−1 and 820 cm−1 corresponding to the symmetric and asymmetric stretching modes of the V–O–V bridges, respectively.41,42 C@V2O5@350 shows a characteristic line at 1020 cm−1 originating in the shortest V![[double bond, length as m-dash]](https://www.rsc.org/images/entities/char_e001.gif) O bond (1.58 Å) of V2O5. This signal gradually shifts to a lower wavelength for C@V2O5@250; this indicates the presence of V4+ on the surface.42 The absorption bands appearing at 1657 cm−1 are due to the bending mode of the O–H vibrations, and the intensity of this peak decreases with the increasing temperature and vanishes at 350 °C due to the decomposition of organic phases and bound water. The broad absorption band at 3100–3600 cm−1, which appears up to 250 °C, is assigned to the O–H stretching vibrations arising from the hydroxyl group of the nanoparticles, originating from glucose. TGA analysis was carried out to evaluate the water content and chemical composition of C@V2O5. The hybrid material was heated to 800 °C under a nitrogen atmosphere. The first weight loss between 25 °C and 200 °C should be ascribed to the dehydration of the samples due to the loss of surface adsorbed water and crystal water. The subsequent weight loss between 300 and 450 °C is due to the burning of the carbon sketch of the carbon nanosphere (Fig. s2†).43,44
O bond (1.58 Å) of V2O5. This signal gradually shifts to a lower wavelength for C@V2O5@250; this indicates the presence of V4+ on the surface.42 The absorption bands appearing at 1657 cm−1 are due to the bending mode of the O–H vibrations, and the intensity of this peak decreases with the increasing temperature and vanishes at 350 °C due to the decomposition of organic phases and bound water. The broad absorption band at 3100–3600 cm−1, which appears up to 250 °C, is assigned to the O–H stretching vibrations arising from the hydroxyl group of the nanoparticles, originating from glucose. TGA analysis was carried out to evaluate the water content and chemical composition of C@V2O5. The hybrid material was heated to 800 °C under a nitrogen atmosphere. The first weight loss between 25 °C and 200 °C should be ascribed to the dehydration of the samples due to the loss of surface adsorbed water and crystal water. The subsequent weight loss between 300 and 450 °C is due to the burning of the carbon sketch of the carbon nanosphere (Fig. s2†).43,44
3.2 Electrochromic performance
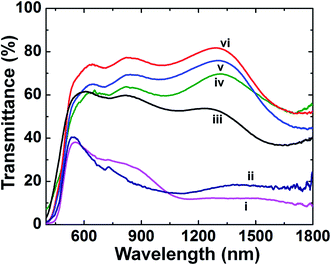
As the annealing temperature increases, the organic component burns out. This is accompanied by the formation of an oxide network and certain changes in the electrochromic behaviour. The optical transmittance of the pristine V2O5 and C@V2O5 films at different annealing temperatures (60, 250, 300, 350, and 400 °C) was measured over the visible region from 300 to 800 nm and also over the near infrared (NIR) wavelength range of 900–1900 nm (Fig. 7). Among all, C@V2O5@350 °C shows the highest transmittance value of 74% at 620 nm and ∼80% at 790 nm, which is followed by C@V2O5@300 °C. However, the unannealed C@V2O5 and C@V2O5@250 °C films show a blue shift and maximum transmittance values of 38% and 40%, respectively, at a wavelength of 540 nm as the sample appears green in color due to the presence of V4+ ions along with V5+. Since these films have nearly identical thicknesses, this significant enhancement in transmittance is exclusively attributed to the effect of the annealing temperature. The nanobelts formed at 350 °C possess less thickness, which can considerably decrease the scattering effect and enhancement in transmittance. Pristine V2O5 and the films annealed (≥300 °C) undergo a colour change from yellow to green. This happens by applying a constant voltage of −1.5 V for 20 seconds. Over this potential range, V2O5 electrodes are expected to undergo Li+ ion insertion, accompanied by colour change, which occurs in two consecutive steps as follows:45| V2O5 + 0.5 Li+ + 0.5 e− → Li0.5V2O5 |
| Li0.5V2O5 + 0.5 Li+ + 0.5 e− → LiV2O5 |
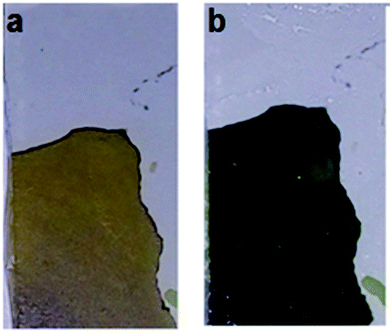 | ||
| Fig. 6 Images depicting reversible color change from yellow to green of C@V2O5@350. (a) bleached (+1 V) and (b) colored state (−1.5 V). | ||
The observed color change can be attributed to the progressive reduction of V5+ ions. The film gets bleached at a potential of +1 V for 20 s (Fig. 8). The reversible colour change is from yellow to green. As the temperature increases, the oxide network formation proceeds, and V4+ ions formed during the hydrothermal process get oxidized and convert completely into the more stable V5+ state. The film switches between yellow and green for the pristine V2O5 and the films annealed at temperatures ≥300 °C. However, the film annealed below 300 °C is green in colour, which indicates a mixture of V4+ and V5+ ions.
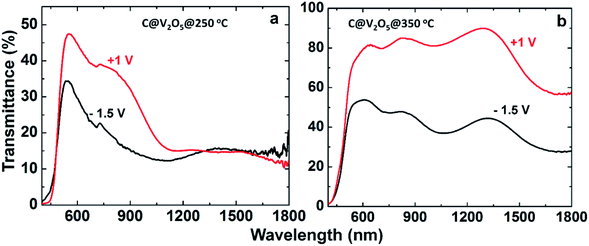 | ||
| Fig. 8 Transmittance spectra of the colored and bleached state of films of (a) C@V2O5@250 and (b) C@V2O5@350. | ||
The transmission modulation factor (ΔT) is an important parameter for the evaluation of electrochromic materials. It can be defined at a specific wavelength as ΔT% (λ) = Tb − Tc (%), where Tb and Tc are the transmittance in the bleached and coloured states, respectively. The maximum ΔT value is observed for C@V2O5@350 °C: 26% at 620 nm and 35% at 810 nm (Fig. 6). At the near-infrared wavelength of 1240 nm, a transmittance contrast of 44% is obtained. Table 1 shows the transmittance modulations of all the films. Previously reported ΔT% values are also comparable with these values. In previous studies, Mg-doped V2O5 (15% Mg) exhibited a maximum transmittance value of 34.4% at 560 nm,24 whereas the V2O5/graphene composite showed a maximum transmittance modulation of 30.8% at a wavelength of 664 nm.23
| Sample | ΔT (%) | ||
|---|---|---|---|
| 620 nm | 790 nm | 1280 nm | |
| V2O5 | 11 | 14.3 | 16.4 |
| C@V2O5@350 °C | 26 | 35.1 | 44 |
| C@V2O5@300 °C | 22.1 | 30.2 | 39.3 |
| C@V2O5 | 10.2 (545 nm) | 13.2 (730 nm) | |
| C@V2O5@250 °C | 12.3 (545 nm) | 16.1 (730 nm) | |
However, another important parameter for electrochromic materials is the temporal spectral response under alternating potentials. Intercalation/de-intercalation of Li+ ions at alternating potentials results in coloration/bleaching switching. Switching time is defined as the time required for reaching a 90% full transmittance change in a material. The switching characteristics of C@V2O5 were examined by monitoring the transmittance at 620 nm and 790 nm as a function of time by applying a square wave voltage between +1 V and −1.5 V (Fig. 9). It is observed that coloration kinetics is slower than the bleaching kinetics for all the film regardless of their annealing temperatures like the case of other transition metal oxide, such as MoO3 and WO3, films because in the bleaching cycle, the back emf (electromotive force) acts in the same direction as the applied emf. Thus, a larger magnitude of driving force is available for electron ejection from the oxide layer.46
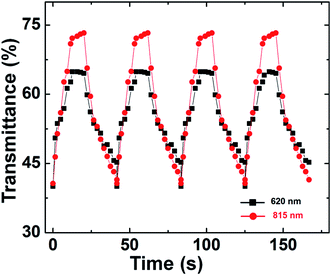 | ||
| Fig. 9 Switching response curve of C@V2O5@350 at 620 and 790 nm under the potentials of +1 and −1.5 V. | ||
3.3 Electrochemical analysis for supercapacitor applications
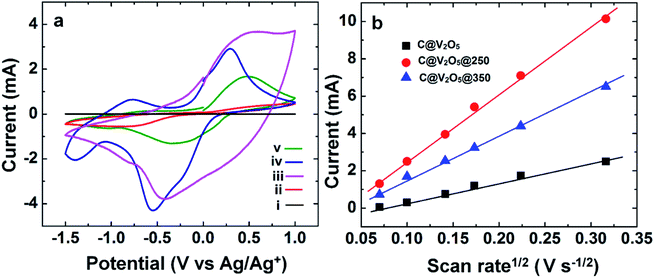
The effect of the annealing temperature and the presence of carbon on electrochemical performance was first investigated by cyclic voltammetry (CV). Fig. 10a shows the CV scan in the potential window from −1.5 to +1 V versus Ag/AgCl at the scan rate of 10 mV s−1. The CV profile of V2O5 shows well-defined cathodic peaks at +0.26, 0.01, and −0.8 and a less distinct peak at −1.35 V, indicating the multiple steps of Li+ intercalation, corresponding to the formation of α, ε, δ, and γ phases, respectively. Upon comparing the cyclic voltammograms of all the films, it has been found that C@V2O5@250 has the highest current density followed by C@V2O5@300. C@V2O5@250 can provide more access for Li+ ion insertion than its crystalline counterpart and can exhibit improved capacity for Li+ ions. It has been suggested that surface defects and low crystallinity play a vital role in improving Li ion intercalation and cyclic stability.47 In addition, the conductivity of the film was proven to be enhanced due to the presence of lower valence vanadium ions and associated oxygen vacancies.48 This indicates that the structure, chemical composition, and morphology have a great impact over the electrochemical properties. Among all the films, pristine V2O5 possesses very low current density in the same potential window as the carbon network is expected to improve the conductivity, which in turn increases the Li ion insertion, as has already been mentioned in our previous study.32 Zhu et al. reported that a C dot-decorated RuO2 nanohybrid-based supercapacitor exhibits excellent rate capability and exceptional cycling stability.43 The specific capacitance value of the hybrid is greatly improved as compared to that of pristine RuO2. The presence of the C-dot greatly decreases the resistance of electron pathways and reduces the diffusion paths; this facilitates fast charge transport and ionic motion during the charge discharge process and leads to a rapid redox reaction. Recently, Xu et al. also reported a C-dot/nickel oxide (CD/NiO) nanorod-based supercapacitor, where a high specific capacitance exceptional rate capability (84.6%, 75.7%, 65.3%, 56.1%, and 51.5% capacity retention rates at 2, 3, 5, 7, and 10 A g−1, respectively) and excellent cycling stability (93% of the initial capacity retention over 1000 cycles at 2 A g−1) are observed due to the coupled effect of faradaic pseudocapacitance from the NiO nanorods and the excellent electrical conductivity of the C-dot nanohybrid.45 In an another study, high performance carbon-coated V2O5 nanorods were prepared by a hydrothermal route. The carbon coating on V2O5 significantly enhances the electronic conductivity and ion diffusion at the electrode/electrolyte interface.49In a previous study, it has been shown that as compared to crystalline V2O5, amorphous V2O5 xerogel offers higher capacitance due to its enhanced Li+ ion insertion, acting as a more versatile host for Li ion intercalation and exhibiting improved capacity for lithium.50
The dependence of peak current and square root of the scan rate of pure V2O5 and C@V2O5 at different annealing temperatures is displayed in Fig. 10b. The relationship between the peak current and the scan rate can provide a better understanding of various electrochemical mechanisms such as diffusion, adsorption, charge transfer and transport etc. The linear relationship between the peak current and scan rate indicates diffusion-controlled Li ion intercalation and de-intercalation in the films. The Li+ diffusion coefficient can be calculated using this linear relationship by employing the Randels–Sevcik equation.51
| ip = D1/2 × 2.72 × 105 × n3/2 × A × C0 × v1/2 | (1) |
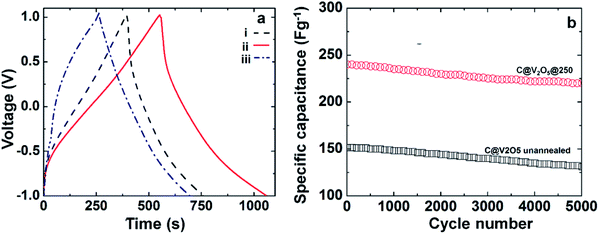
Furthermore, the charge–discharge characteristics of C@V2O5 electrodes under galvanostatic conditions were studied to evaluate the electrochemical specific capacitance at different current densities. The charge–discharge profile of C@V2O5 at different annealing temperatures at a fixed current density of 1 A g−1 over a voltage range from 1 V to −1 V is shown in Fig. 11a. The profile shows a small transition in the linear portion of the charge–discharge behaviour since the overall capacitance is contributed from both EDLC and pseudocapacitance. During the charge–discharge process, reversible Li+ ion intercalation into the V2O5 crystal structure takes place with concurrent electron transport. The specific capacitances of the electrodes are calculated using the following equation:
| SC = I × Δt/ΔV × m | (2) |
In eqn (2), SC is the specific capacitance, I is the current applied for discharge, Δt is the time in seconds for discharge, ΔV is the voltage window, and m is the mass of the active material of the working electrode. Among all the films, C@V2O5@250 provides a higher specific capacitance value of 260 F g−1, which is ∼1.43 times lesser that of C@V2O5. The specific capacitance values of C@V2O5 at different annealing temperatures at a current density of 1 A g−1 are shown in Table 2. The intercalated carbon provides high electrical conductivity, which in turn enhances the electrochemical double layer capacitance of the electrode material. Moreover, the C@V2O5@250 nanobelts have a higher surface area and a layered kind of crystal structure, which in turn can improve the electron propagation property of the electrodes and hence increase the specific capacitance. The presence of V4+ can enhance the electronic conductivity. Annealing at a moderate temperature, such as 250 °C, ensures the adherence of the active material over FTO. As the annealing temperature increases, more crystallization is observed, and the film displays a cyclic degradation.
| Sample | Specific capacitance, F g−1 at 1 A g−1 |
|---|---|
| V2O5 | 78 |
| C@V2O5 | 211 |
| C@V2O5@250 °C | 260 |
| C@V2O5@300 °C | 225 |
| C@V2O5@350 °C | 181 |
The cyclic stability of the electrodes has been studied in detail by measuring the variation in specific capacity at the current density of 5 A g−1 as a function of charge discharge cycles, as shown in Fig. 11b. After 5000 cycles, C@V2O5@250 retained ∼92% of its initial capacitance; this indicated the excellent stability of the material as a capacitor. In comparison, the as-prepared C@V2O5 retained ∼88% of its initial capacitance. The carbon network prevents the dissolution of the active material in the electrolyte. It has already been observed in earlier studies that poor crystallinity favours cycling stability.41
To obtain better insights into the electrochemical performance of the electrodes, electrochemical impedance measurements (EIS) were performed to analyse the kinetic behaviour in the frequency range from 10−2 to 106 Hz using an ac rms of 10 mV. Fig. 12 shows the Nyquist plot of C-dot@V2O5, C-dot@V2O5@250, and C-dot@V2O5@300. The electrodes were held at an open circuit potential during the analysis. The impedance data was fitted to an equivalent circuit model consisting of bulk solution resistance (Rs), charge transfer resistance (Rct), double layer capacitance (Cdl), and Warburg resistance (W). The resulting spectrum consists of a semicircle in the high frequency region and a linear portion in the low frequency regime. The semicircle represents the resistive nature of the supercapacitor that is related to the charge transfer resistance (Rct) associated with faradaic reactions (inset of Fig. 10). The Rct values for C@V2O5@250, C@V2O5@300, and C@V2O5 were found to be 11.4, 12.5, and 14 Ω, respectively. As shown in the figure, C@V2O5@250 shows lower Rct values as compared to other films. The lower Rct value of the hybrid suggests higher specific capacitance, whereas the inclined line in the low frequency region represents the Warburg impedance (Ws) corresponding to ion diffusion into the bulk of the electrodes through the pores. The perpendicular slope in the low frequency region shows a better capacitive behaviour.
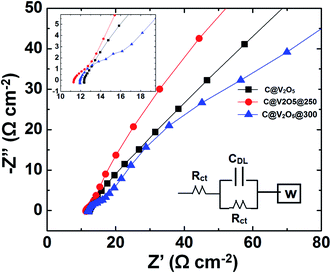 | ||
| Fig. 12 Nyquist plot for C@V2O5, C@V2O5@250, and C@V2O5@300 along with the equivalent circuit diagram. | ||
4. Conclusion
Herein, C@V2O5 films were fabricated and annealed at different temperatures, and their applicability in electrochromic smart windows and supercapacitor was investigated. The structural, optical, and electrochemical analysis of this hybrid material was conducted in detail. The presence of a carbon network enhances the electrical conductivity. The film annealed at the temperature of 350 °C is more favourable for electrochromic applications. Post annealing treatment of the film at 350 °C results in a smooth texture of the film. It demonstrates a higher optical transmittance (∼80%) and higher transmission modulation of 26% at 620 nm, 35% at 810 nm, and 44% at 1200 nm. The enhanced electrochromic nature of the film can be ascribed to the smooth texture of the film. The pure phase of V5+ in C@V2O5@350 facilitates faster switching responses. On the other hand, the C@V2O5 film annealed at 250 °C exhibits a less crystalline phase, but is found to be more suitable for supercapacitor applications. The presence of a lower valence vanadium ion and associated oxygen vacancies improves the lithium-ion intercalation capacity and cyclic stability. The C@V2O5@250 film exhibits a specific capacitance of 260 F g−1 at 1 A g−1, which is nearly 1.43 times higher than that of the as-prepared C@V2O5. C@V2O5@250-based electrodes retained ∼94% of the initial capacitance after 5000 cycles.To the best of our knowledge, it is for the first time that this hybrid material has been used for two different applications by varying the annealing temperatures. These results clearly point towards the critical and complimentary roles of post-growth annealing temperatures to effectively optimize the same nanomaterial for different device functionalities. Variation of post-growth annealing temperature can effectively alter the functional attributes of the carbon-containing V2O5 nanobelts and make them more suitable for either electrochromic or supercapacitor use. Therefore, this study opens up novel but simple ways to optimally tune these hybrid nanomaterials for targeted, device-specific applications of nanotechnology for sustainable energy solutions.
Conflicts of interest
There are no conflict of interest to declare.Acknowledgements
Financial support received from the Science and Engineering Research Board DST CERI Grant#DST/TM/CERI/C99(G), DST Nano Thematic Unit grant #DST/SR/NM/TP13/2016, and Centre for Energy Science, IISER-Pune is gratefully acknowledged. RN acknowledges DST-SERB's NPDF Fellowship (PDF/2015/000715), and AD acknowledges DST's Inspire Scholarship for PhDNotes and references
- H. K. Park and W. H. Smyrl, J. Electrochem. Soc., 1994, 141, L25–L26 CrossRef CAS.
- M. Armand and J. M. Tarascon, Nature, 2008, 451, 652–657 CrossRef CAS PubMed.
- K. Kang, Y. S. Meng, J. Bréger, C. P. Grey and G. Ceder, Science, 2006, 311, 977–980 CrossRef CAS PubMed.
- C. Y. Foo, A. Sumboja, D. J. H. Tan, J. Wang and P. S. Lee, Adv. Energy Mater., 2014, 4, 1400236 CrossRef.
- Y. Wang, K. Takahashi, K. H. Lee and G. Z. Cao, Adv. Funct. Mater., 2006, 16, 1133–1144 CrossRef CAS.
- P. Senguttuvan, S.-D. Han, S. Kim, A. L. Lipson, S. Tepavcevic, T. T. Fister, I. D. Bloom, A. K. Burrell and C. S. Johnson, Adv. Energy Mater., 2016, 6, 1600826 CrossRef.
- L. Hua, Z. Ma, P. Shi, L. Li, K. Rui, J. Zhou, X. Huang, X. Liu, J. Zhu, G. Sun and W. Huang, J. Mater. Chem. A, 2017, 5, 2483–2487 CAS.
- Z. Tong, H. Lv, X. Zhang, H. Yang, Y. Tian, N. Li, J. Zhao and Y. Li, 2015, 5, 16864.
- Z. Tong, J. Hao, K. Zhang, J. Zhao, B.-L. Su and Y. Li, J. Mater. Chem. C, 2014, 2, 3651–3658 RSC.
- G. Salek, B. Bellanger, I. Mjejri, M. Gaudon and A. Rougier, Inorg. Chem., 2016, 55, 9838–9847 CrossRef CAS PubMed.
- M. Prześniak-Welenc, J. Karczewski, J. Smalc-Koziorowska, M. Łapiński, W. Sadowski and B. Kościelska, RSC Adv., 2016, 6, 55689–55697 RSC.
- C. O'Dwyer, V. Lavayen, D. A. Tanner, S. B. Newcomb, E. Benavente, G. González and C. M. S. Torres, Adv. Funct. Mater., 2009, 19, 1736–1745 CrossRef.
- M. Li, G. Sun, P. Yin, C. Ruan and K. Ai, ACS Appl. Mater. Interfaces, 2013, 5, 11462–11470 CAS.
- J. Muster, G. T. Kim, V. Krstić, J. G. Park, Y. W. Park, S. Roth and M. Burghard, Adv. Mater., 2000, 12, 420–424 CrossRef CAS.
- S. Mateti, M. M. Rahman, L. H. Li, Q. Cai and Y. Chen, RSC Adv., 2016, 6, 35287–35294 RSC.
- Y. Zhang, A. Pan, Y. Wang, W. Wei, Y. Su, J. Hu, G. Cao and S. Liang, ACS Appl. Mater. Interfaces, 2016, 8, 17303–17311 CAS.
- Y. Wang and G. Cao, Chem. Mater., 2006, 18, 2787–2804 CrossRef CAS.
- H. Zhao, L. Pan, S. Xing, J. Luo and J. Xu, J. Power Sources, 2013, 222, 21–31 CrossRef CAS.
- D. Kong, X. Li, Y. Zhang, X. Hai, B. Wang, X. Qiu, Q. Song, Q.-H. Yang and L. Zhi, Energy Environ. Sci., 2016, 9, 906–911 CAS.
- S. D. Perera, A. D. Liyanage, N. Nijem, J. P. Ferraris, Y. J. Chabal and K. J. Balkus, J. Power Sources, 2013, 230, 130–137 CrossRef CAS.
- M. Fu, C. Ge, Z. Hou, J. Cao, B. He, F. Zeng and Y. Kuang, Phys. B, 2013, 421, 77–82 CrossRef CAS.
- B. Saravanakumar, K. K. Purushothaman and G. Muralidharan, RSC Adv., 2014, 4, 37437–37445 RSC.
- X. Zhang, H. Sun, Z. Li, J. Xu, S. Jiang, Q. Zhu, A. Jin and G. S. Zakharova, J. Electrochem. Soc., 2013, 160, H587–H590 CrossRef CAS.
- M. Panagopoulou, D. Vernardou, E. Koudoumas, N. Katsarakis, D. Tsoukalas and Y. S. Raptis, J. Phys. Chem. C, 2017, 121, 70–79 CAS.
- C. Xiong, A. E. Aliev, B. Gnade and K. J. Balkus, ACS Nano, 2008, 2, 293–301 CrossRef CAS PubMed.
- L. Shao, J.-W. Jeon and J. L. Lutkenhaus, Chem. Mater., 2012, 24, 181–189 CrossRef CAS.
- J. Wang, C. J. Curtis, D. L. Schulz and J.-G. Zhang, J. Electrochem. Soc., 2004, 151, A1–A7 CrossRef CAS.
- R. Baddour-Hadjean, J. P. Pereira-Ramos, C. Navone and M. Smirnov, Chem. Mater., 2008, 20, 1916–1923 CrossRef CAS.
- Q. Liu, Z.-F. Li, Y. Liu, H. Zhang, Y. Ren, C.-J. Sun, W. Lu, Y. Zhou, L. Stanciu, E. A. Stach and J. Xie, 2015, 6, 6127.
- V. Petkov, P. N. Trikalitis, E. S. Bozin, S. J. L. Billinge, T. Vogt and M. G. Kanatzidis, J. Am. Chem. Soc., 2002, 124, 10157–10162 CrossRef CAS PubMed.
- D. Liu, Y. Liu, B. B. Garcia, Q. Zhang, A. Pan, Y.-H. Jeong and G. Cao, J. Mater. Chem., 2009, 19, 8789–8795 RSC.
- R. Narayanan, J. Solid State Chem., 2017, 253, 103–112 CrossRef CAS.
- X. Sun and Y. Li, Angew. Chem., Int. Ed., 2004, 43, 597–601 CrossRef PubMed.
- G. C. A. Luijkx, F. van Rantwijk, H. van Bekkum and M. J. Antal Jr, Carbohydr. Res., 1995, 272, 191–202 CrossRef CAS PubMed.
- Q. Wang, H. Li, L. Q. Chen and X. J. Huang, Solid State Ionics, 2002, 152–153, 43–50 CrossRef CAS.
- D. Zhang, L. Su, H. Li, X. Qian and J. Xu, J. Cryst. Growth, 2006, 294, 437–441 CrossRef CAS.
- Y. Wang, H. Shang, T. Chou and G. Cao, J. Phys. Chem. B, 2005, 109, 11361–11366 CrossRef CAS PubMed.
- E. Antonides, E. C. Janse and G. A. Sawatzky, Phys. Rev. B: Solid State, 1977, 15, 4596–4601 CrossRef CAS.
- R. Baddour-Hadjean, V. Golabkan, J. P. Pereira-Ramos, A. Mantoux and D. Lincot, J. Raman Spectrosc., 2002, 33, 631–638 CrossRef CAS.
- C. Sanchez, J. Livage and G. Lucazeau, J. Raman Spectrosc., 1982, 12, 68–72 CrossRef CAS.
- A. Šurca and B. Orel, Electrochim. Acta, 1999, 44, 3051–3057 CrossRef.
- I. L. Botto, M. B. Vassallo, E. J. Baran and G. Minelli, Mater. Chem. Phys., 1997, 50, 267–270 CrossRef CAS.
- Y. Zhu, X. Ji, C. Pan, Q. Sun, W. Song, L. Fang, Q. Chen and C. E. Banks, Energy Environ. Sci., 2013, 6, 3665–3675 CAS.
- M. Chen, L.-L. Shao, J.-J. Li, W.-J. Pei, M.-K. Chen and X.-H. Xie, RSC Adv., 2016, 6, 35228–35238 RSC.
- X. Liu, C. Huang, J. Qiu and Y. Wang, Appl. Surf. Sci., 2006, 253, 2747–2751 CrossRef CAS.
- Z. Lu, M. D. Levi, G. Salitra, Y. Gofer, E. Levi and D. Aurbach, J. Electroanal. Chem., 2000, 491, 211–221 CrossRef CAS.
- E. Hosono, T. Kudo, I. Honma, H. Matsuda and H. Zhou, Nano Lett., 2009, 9, 1045–1051 CrossRef CAS PubMed.
- H. S. Jung, H. Shin, J.-R. Kim, J. Y. Kim, K. S. Hong and J.-K. Lee, Langmuir, 2004, 20, 11732–11737 CrossRef CAS PubMed.
- J. Xu, Y. Xue, J. Cao, G. Wang, Y. Li, W. Wang and Z. Chen, RSC Adv., 2016, 6, 5541–5546 RSC.
- D. R. Rolison and B. Dunn, J. Mater. Chem., 2001, 11, 963–980 RSC.
- S. R. Bathe and P. S. Patil, Sol. Energy Mater. Sol. Cells, 2007, 91, 1097–1101 CrossRef CAS.
- M. Seman, J. Marino, W. Yang and C. A. Wolden, J. Non-Cryst. Solids, 2005, 351, 1987–1994 CrossRef CAS.
Footnote |
| † Electronic supplementary information (ESI) available. See DOI: 10.1039/c7ra13357j |
| This journal is © The Royal Society of Chemistry 2018 |

