 Open Access Article
Broadband visible luminescence in tin fluorophosphate glasses with ultra-low glass transition temperature
Yajie Wangab,
Yue Yuab,
Ya Zouc,
Liyan Zhang*a,
Lili Hua and
Danping Chen *a
*a
aKey Laboratory of Materials for High Power Laser, Shanghai Institute of Optics and Fine Mechanics, Chinese Academy of Sciences, Shanghai 201800, China. E-mail: jndxzly@hotmail.com; dpchen2008@aliyun.com
bUniversity of Chinese Academy of Sciences, Beijing 100049, China
cShanghai University, Shanghai 201800, China
First published on 29th January 2018
Abstract
The structure of tin fluorophosphate glasses and their low melting point properties have attracted a great deal of attention recently, but their own luminescent features have not been well studied. Photoluminescence properties of ultra-low glass transition temperature (<200 °C) tin fluorophosphate glasses with varying SnO/SnF2 molar ratios at room temperature have been investigated in the present study. Broad photoluminescence in the range from 400 nm to 700 nm, originating from the S1–S0 and T1–S0 transitions of Sn2+ with the ultra-high concentration (70 mol%), was obtained. And the SnF2–SnO–P2O5 glasses exhibited a fast decay lifetime of 2 ns. Both wavelengths of the excitation peak and emission peak depend on the local structure of Sn2+, which is influenced by different SnO/SnF2 molar ratios. White light can be generated by appropriately altering the SnO/SnF2 molar ratios in the SnF2–SnO–P2O5 glasses. The ultra-low glass transition temperature SnF2–SnO–P2O5 glasses without rare earth elements are a possible candidate for future high white light emission.
Introduction
In recent years, low glass transition temperature (Tg) glasses, of which the Tg value is generally lower than 200 °C, have received widespread attention because of broad applications in different fields of science and technology such as glass–metal sealing, IC packaging, photon conversion and filler.1–6 Fluorophosphate glasses are of great significance to these applications. In addition to the low transition temperature, fluorophosphate glasses have attracted much interest by combining the common advantages of phosphate glasses and fluoride glasses, such as high thermal expansion coefficients, perfect glass forming ability and excellent optical properties.7–11 The divalent Sn with a lone electron pair has low activation energy for glass network rearrangement, which is preferable to obtain lower Tg value glasses. Meanwhile, the Sn ion can improve the chemical durability due to its large polarizability to fluorophosphate glasses.Owing to Tick's report that tin fluorophosphate glasses have a low transition temperature,12 they are considered as potential sealing materials instead of glasses containing PbO. Since then, a great deal of work has been done to study the preparation and properties of SnO–SnF2–P2O5 glasses. Shaw et al.,13 Ding et al.14 and York-Winegar et al.2 etc. employed Fourier transform infrared spectroscopy, Raman microscopy, X-ray photoelectron spectroscopy and magic angle spinning nuclear magnetic resonance spectroscopy techniques to understand tin fluorophosphate glass structure, respectively. They concluded that the structural feature of tin fluorophosphate glasses are the high ratio between non-bridging and bridging oxygen, occupation of fluorine in two different chemical states (F–P and F–Sn), two types of Sn-containing building blocks (preferably Sn–O2F and secondary Sn–F2O) and P atoms (P–O3F structural units) in a single chemical environment. Liu et al.4 investigated the effect of composition and melting time on the structure and properties of SnO–SnF2–P2O5 glasses and found that F/Sn molar ratios and melting time can influence the glass network dimension which decided the properties of the glasses. Radic et al.15 researched the effect of photorefraction was studied in different tin-fluorophosphate compositions and reported that the photorefraction property of tin fluorophosphate glasses is comparable with those seen in GeO2–SiO2 glasses. Induja et al.16 studied that the 45SnF2–25SnO–30P2O5 glass has excellent dielectric properties both in radio (εr of 20 and tan![[thin space (1/6-em)]](https://www.rsc.org/images/entities/char_2009.gif) δ of 0.007 at 1 MHz) and microwave frequencies (εr of 16 [6.2 GHz], Qu*f = 990 GHz with a τf value of −290 ppm °C−1) and found that ultralow-temperature sinterable alumina-45SnF2–25SnO–30P2O5 glass is a possible candidate for ultralow-temperature cofired ceramics applications. With their low melting point properties, a large number of studies have also been made on the luminescent properties of tin fluorophosphate glasses doped with organic dyes such as rhodamine 6G17 and stilbene-3.18 Although extensive work has been reported on the structure and properties of tin fluorophosphate glasses, few attempts were made to study the intrinsic photoluminescence (PL) properties. Liu et al.18 just observed the emission peaked about 440 nm from the lead–tin-fluorophosphate glass at low temperature but quenched at room temperature.
δ of 0.007 at 1 MHz) and microwave frequencies (εr of 16 [6.2 GHz], Qu*f = 990 GHz with a τf value of −290 ppm °C−1) and found that ultralow-temperature sinterable alumina-45SnF2–25SnO–30P2O5 glass is a possible candidate for ultralow-temperature cofired ceramics applications. With their low melting point properties, a large number of studies have also been made on the luminescent properties of tin fluorophosphate glasses doped with organic dyes such as rhodamine 6G17 and stilbene-3.18 Although extensive work has been reported on the structure and properties of tin fluorophosphate glasses, few attempts were made to study the intrinsic photoluminescence (PL) properties. Liu et al.18 just observed the emission peaked about 440 nm from the lead–tin-fluorophosphate glass at low temperature but quenched at room temperature.
In the present study, we reported that PL and PL excitation (PLE) properties of SnO–SnF2–P2O5 glasses without any addition of active ions at room temperature. The effect of different compositions on the luminescence properties of SnO–SnF2–P2O5 glasses has been investigated in detail.
Experimental
Sample preparation
A series of tin fluorophosphate glasses having the composition range of 30–70 mol% SnF2 and 0–40 mol% SnO were prepared by conventional melt quenching technique. The batched materials used in the glass melts were SnF2 (99.9%, Shanghai Macklin Biochemical Co., Ltd), SnO (>99%, Shanghai Aladdin Bio-Chem Technology Co., Ltd) and NH4H2PO4 (>99%, Sinopharm Chemical Reagent Co., Ltd). These glasses were expressed as (70 − x)SnF2–xSnO–30P2O5 glasses (x = 0, 10, 20, 30, 40) named as SSP0, SSP1, SSP2, SSP3, SSP4, respectively. A two-step melting process was adopted to minimize fluorine loss. NH4H2PO4 was first pre-decomposed at 400 °C for 30 minutes. After that, a certain proportion of SnF2 and SnO were mixed into the same crucible and then transferred into the furnace once again and melted at 400 °C for 30 min. The melt was cast into preheated steel molds and annealed at the corresponding transition temperature in a muffle furnace. All of the samples were cooled down to room temperature, then cut and polished for tests. In order to prevent moisture absorption, all of the samples were saved in the electronic moisture-proof cabinet (FU1200, Hangzhou FRK Precision Electronics Co. Ltd, China) which maintained a constant relative humidity of 5% and a constant temperature of 20 °C.Characterization
The XPS measurements were conducted with a high-performance K-Alpha X-ray photoelectron spectrometer (XPS, Thermo Fisher Scientific, United States) in ultra-high vacuum. The binding energies of all elements were corrected by assuming the adventitious alkyl (C–C) peak at 284.6 eV. The glass transition temperatures (Tg) of the glasses were measured using a NetzschSTA449/C differential scanning calorimeter (DSC) at a heating rate of 10 °C min−1. The powder X-ray diffraction (XRD) patterns of the samples were recorded on a PANalytical Empyrean X-ray diffractometer using Cu Kα1 radiation. The PL, PLE spectra and the emission decay were measured by a high-resolution spectrofluorometer (Edinburgh Instruments FLS 920, UK). The absorption spectra were recorded using a Lambda 950 UV-VIS-NIR spectrophotometer in the range of 300–800 nm. The structure of the glasses was measured by the KBr pellet method utilizing a tensor Fourier transform infrared spectroscopy (FTIR, Nicolet 6700). The data was recorded between 1600 and 400 cm−1. Raman spectra were recorded by a Renishaw inVia Raman microscope in the range of 200–1400 cm−1 using the 488 nm laser line for excitation. All measurements were carried out at room temperature.Results and discussion
XPS spectra
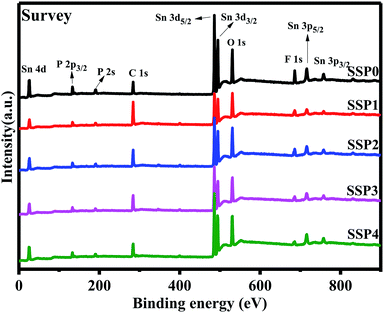
XPS measurements were performed to identify the actual composition of the glasses. Fig. 1 shows the XPS survey spectrum for all the samples. According to the ref. 4, all the glasses contained P, Sn, O, and F elements. Sn and F of the theoretical composition and the experimental value measured by XPS are shown in Table 1. About 20% of SnF2 is volatilized in all samples because of the low melting point of SnF2. Table 1 also shows the theoretical and experimental values of Sn/F molar ratios. In spite of volatilization, the experimental value of Sn/F molar ratios is the same as the theoretical value gradually increases which is in line with our expectation.| Sample | Theoretical elemental composition (at%) | Experimental elemental composition (at%) | Sn/F | |||
|---|---|---|---|---|---|---|
| Sn | F | Sn | F | Theoretical | Experimental | |
| SSP0 | 16.70 | 33.32 | 13.03 | 22.28 | 0.50 | 0.58 |
| SSP1 | 17.11 | 29.25 | 13.85 | 19.49 | 0.58 | 0.71 |
| SSP2 | 17.53 | 24.99 | 14.29 | 16.24 | 0.70 | 0.87 |
| SSP3 | 17.98 | 20.50 | 15.95 | 12.96 | 0.88 | 1.23 |
| SSP4 | 18.45 | 15.79 | 15.46 | 9.61 | 1.17 | 1.60 |
XRD and Tg
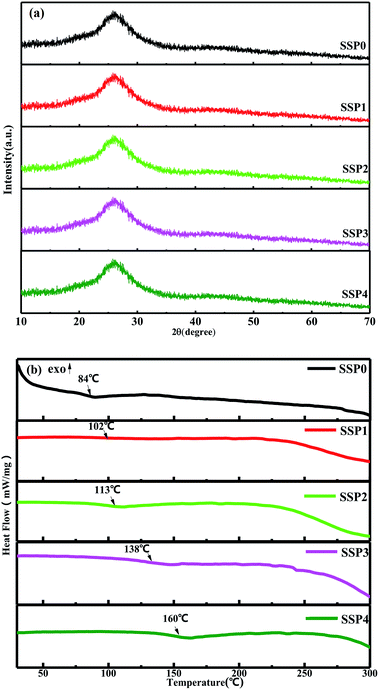
XRD patterns of the SSP glasses with varying SnO/SnF2 molar ratios are depicted in Fig. 2(a). There were just two broad, amorphous humps and no crystalline phase detected from XRD, indicating that all the glasses samples were amorphous regardless of the compositions. As shown in Fig. 2(b), Tg increased from 84 °C to 160 °C with the increase of the SnO/SnF2 molar ratios. The trend is the same as the previous report.4,6 The difference in the Tg value between the present study and the previous literature may be caused by the difference in origin and purity of and furnace heating conditions which have an influence on the decomposition and volatilization of NH4+ and OH−. The increase of Tg may due to the higher field strength cations (O2− > F−) create a more tightly bonded glass structure with SnO replacing SnF2 in these glasses.19 Although the temperature increased, the maximum Tg is below 200 °C, which meets the requirements of low-temperature sealing glasses.Structural analysis
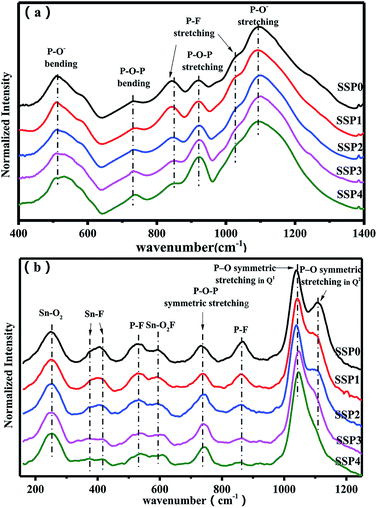
The variations of glass structure with varying SnO/SnF2 molar ratios were studied by FTIR spectra, as show Fig. 3(a). The bands at 730 cm−1 and 920 cm−1 were attributed to P–O–P (bridging oxygen) bending and stretching vibrations,4,5,20 respectively. The bands at 840 cm−1 and 1027 cm−1 were assigned to the P–F stretching vibrations of the [PO4−xFx] tetrahedral structures.4,5,20 The bands at 507 cm−1 and 1093 cm−1 originated from P–O− (non-bridging oxygen) bending and stretching vibrations,4,5,20 respectively. Notably, with the addition of SnO, the weakened P–F vibrations at 847 cm−1 and 1025 cm−1 were observed which is due to the increased amount of oxygen atoms and the decreased amount of fluorine atoms resulting in less F− ions entering into [PO4] to form the [PO4−xFx] tetrahedron.5 Meanwhile, more O link with P to form P–O–P (bridging oxygen) bonds leading to the enhancement of the vibrations at 740 cm−1 and 929 cm−1.4Raman spectra of SSP glasses were given by Fig. 3(b) to further explain the structural changes. In the high-frequency region of the spectrum, the peak near 1105 cm−1 is associated with the P–O symmetric stretch of the metaphosphate Q2 unit (where Qn denotes a PO4 tetrahedron with n bridging oxygen atoms), the peak at 1037 cm−1 is assigned to the P–O symmetric stretching vibration of the pyrophosphate Q1 unit.2,21,22 The band near 865 cm−1 is associated with the P–F symmetric stretch and the band near 730 cm−1 is related to a P–O–P symmetric stretching mode.23,24 In the 600 cm−1 peak was connected with SnO2–F structural units.2 The band in the 530 cm−1 regions was associated with P–F bending modes.25 The peaks near 370 cm−1 and 415 cm−1 to Sn–F fragments, the band near 250 cm−1 have been associated with Sn–O2 bending modes.24 Obviously, the intensity of P–F stretching mode at 530 cm−1 and 865 cm−1 decreases with the increase of SnO, which is in good agreement with these FTIR results. Meanwhile, the weakened Sn–F vibrations at near 370 and 415 cm−1 are observed with the increase of SnO due to the decreased amount of fluorine atoms. Furthermore, a decrease in intensity of the band near 1125 cm−1 that is associated with Q2 units. This change is consistent with the depolymerization of the phosphate chain as the [P]/[O] ratio decreases when SnO replaces SnF2. No significant changes in other groups are observed.
Taking into account the results of FTIR and Raman spectroscopy, the Sn–F and P–F bonds decrease, the Q2 group depolymerize and the P–O–P bond increase when SnO gradually replaces SnF2. These results suggested a progressive break of the linear phosphate chains by insertion of SnO. On the other hand, Q2 units gradually transformed into Q1 units when SnO replaces SnF2. No significant change in other tin-related bonds implies that SnO is incorporated into the glass as a network modifier and the liberation of Sn2+ in the glass network.
Excitation and emission spectra of SSP glass
Fig. 4(a) shows normalized PLE and absorption spectra of SSP0 glass. The PLE spectrum was measured at the peak photon energy of PL spectrum. The ultraviolet absorption edge of fluorophosphate glass is around 165 nm,26 which is much smaller than that of SSP0 glasses (∼325 nm). Apparently, the introduction of Sn results in a massive peak shift of the optical band edge energy, which indicates that the absorption edge derives from a Sn2+ species. Therefore, it can be said that a strong absorption band of the Sn2+ species exists within the band gap of the host tin fluorophosphate glasses. Comparing the absorption spectrum with the PLE spectrum, it can be found that the central excitation band position locates in the vicinity of the optical band edge. Normalized PL spectrum of SSP0 glass is given in Fig. 4(b). It is also found that PL spectrum shows a broad emission in the range from 400 nm to 700 nm, which is characteristic of a parity-allowed ns2-type emission center. It was reported that two fold-coordinated Sn2+ in the 60ZnO–40P2O5 glass shows a triplet (T1)–singlet (S0) relaxation band in the range from 310 nm to 620 nm.27,28 To the best of our knowledge, pure fluorophosphate glass has no emission, which indicates that a Sn2+ species is the origin of both the absorption edge and the PLE band in the SSP0 glass, and gives strong emission under irradiation with a light whose photon energy corresponds to the optical band gap of Sn2+ center. The inset of Fig. 4(a) shows energy scheme for PLE and PL process of Sn2+. PLE spectra apparently consist of two bands: the shorter wavelength absorption band (named as S1) around 275 nm and the longer wavelength absorption band (named as S′1) around 335 nm in the Fig. 4(a). As shown in Fig. 4(b), it is also found that PL spectrum in present glass is composed of two bands, the longer wavelength emission band around 520 nm and the shorter wavelength emission band around 432 nm, which is deconvoluted by the Gaussian functions. It was reported that the two fold coordinated Sn in SiO2 and borate glass shows two emission bands: α-band [singlet (S1)–singlet (S0)] and β-band [triplet (T1)–singlet (S0)] and the Sn in phosphate glass just shows an emission band [triplet (T1)–singlet (S0)].29–31 Based on the above facts, we put forward that the shorter wavelength emission band around 432 nm can be mainly attributed to the S1–S0 transition and the longer wavelength emission band around 520 nm can be ascribed to the T1–S0 transition. Compared with Sn2+-doped 60ZnO–40P2O5 glass,27,32 the broadband luminescence of the SSP0 glass is in the visible wavelength range, which could be a new light source.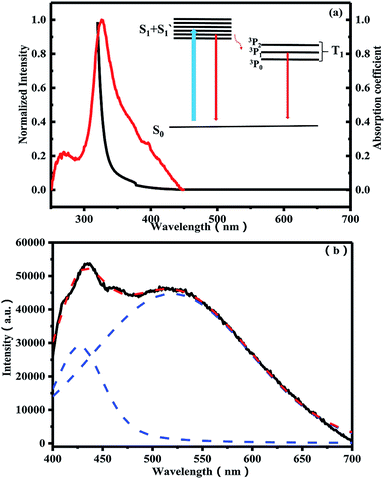 | ||
| Fig. 4 (a) Normalized PLE and absorption spectra of SSP0 glass. (b) Normalized PL spectrum of SSP0 glass. | ||
Fig. 5(a) shows the optical absorption spectra of five SSP glasses with different ratios of SnO/SnF2. A trend towards a red shift in the ultraviolet absorption edge of the glass is noticed as a result of adding increasing amounts of SnO. An analogous tendency has been reported for Sn2+-doped 60ZnO–40P2O5 glass prepared in air using different starting materials.32 It was found that the absorption edge of the Sn2+-doped ZnO–P2O5 glass correlated with the local coordination state of the Sn2+ emission center.28,33 Fig. 5(b) also shows the normalized PLE spectra of the SSP glasses containing various ratios of SnO/SnF2. It is found that all the PLE spectra apparently consist of two bands: the shorter wavelength absorption band S1 around 275 nm is almost unchanged, whereas the longer wavelength absorption band S′1 around 335 nm red-shifts with varying SnO/SnF2 molar ratios, which is consistent with the literature.28,31 According to the previous literature, the lower energy band S′1 is a strongly concentration dependent excitation band. However, the total amount of Sn does not change in this paper, only the way of introducing tin has changed, the red-shifts of S′1 is still observed, which reveals S′1 is not only related to the concentration of Sn but also affected by the local structure of Sn2+. As the FTIR and Raman shows, with increasing the ratio of SnO/SnF2, the more oxygen enter the glass network to replace fluorine, the more Sn–F and P–F convert into Sn–O and P–O bond, which makes the local structure of Sn2+ change. According to the nephelauxetic effect, when the anionic ligand orbital is bonded to the central metal atom, it has a covalent property. This effect is mainly affected by the type of anion, the larger the anion polarization, the higher the covalency, the more pronounced the nephelauxetic effect. For the anionic polarization of Sn, O2− > F−. Therefore, the covalent bond of the Sn–O bond is larger than that of Sn–F, which results in the red shift of the excitation spectrum and the absorption spectrum.
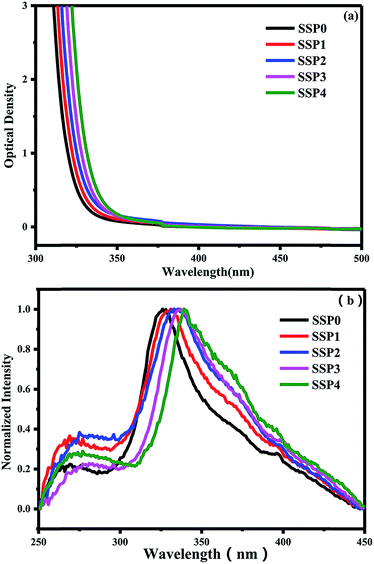 | ||
| Fig. 5 (a) Optical absorption spectra of five SSP glasses with different ratios of SnO/SnF2. (b) Normalized PLE spectra of the SSP glasses. | ||
Fig. 6(a) shows the PL spectra of the SSP glasses containing different ratios of SnO/SnF2. The PL spectra were measured by excitation with a light at the peak energy of each PLE spectrum. All the samples are the same as SSP0 glass, which shows the broad emission in the range from 400 to 700 nm. In addition, these PL spectra consist of two bands, and the peak intensity of each band depends on the ratio of SnO/SnF2. In order to illustrate this phenomenon, the PL spectra are deconvoluted into two bands using the Gaussian functions as Fig. 4(b) shows the shorter wavelength emission band A around 432 nm and the longer wavelength emission band B around 531 nm. Fig. 6(b) shows the peak area ratio B/(A + B) and the peak position of B bands as a function of the ratio of SnO/SnF2. With increasing the ratios of SnO/SnF2, the peak red-shifts from 510 nm to 532 nm. From FTIR and Raman results, the weaker linkages of Sn–F and P–F are gradually replaced by stronger Sn–O and P–O–P linkages with the increase of SnO content, thus leading to the local structural change of Sn2+. The redshift of the emission spectrum is attributed to the nephelauxetic effect that the covalent bond of the Sn–O bond is larger than that of Sn–F. Meanwhile, the peak area ratio of the B band first increases and then decreases with increasing the ratios of SnO/SnF2. Although note that the total amount of tin is constant (70 mol%), these changes are due not only to changes in the local structure of Sn2+ but also to the concentration. FTIR and Raman data indicated that SnO is introduced into the glass as a glass modifier and Sn2+ is liberated in the glass network. When SnO gradually replaces SnF2, more Sn2+ are liberated in the glass network, which results in the increase of the peak area ratio of the B band. With the continued increase of SnO, the peak area ratio of the B band decreased due to concentration quenching.
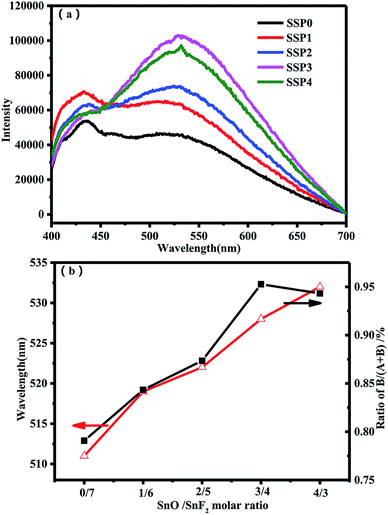 | ||
| Fig. 6 (a) The PL spectra of the SSP glasses containing different ratios of SnO/SnF2. (b) The peak area ratio B/(A + B) and the peak position of B bands as a function of the ratio of SnO/SnF2. | ||
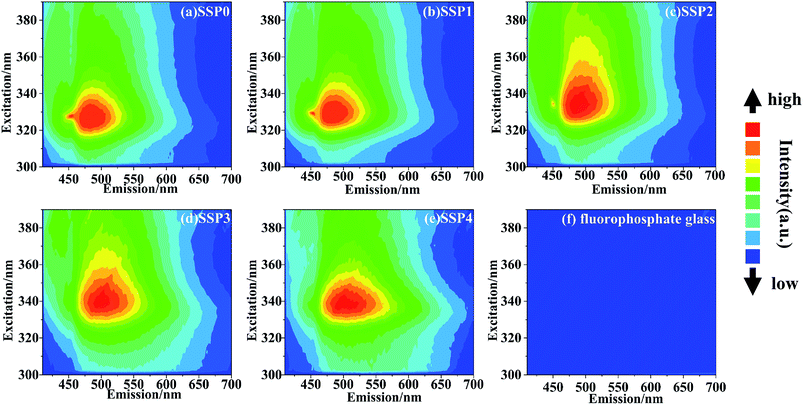
Fig. 7 shows PL–PLE contour plots of the SSP glasses: (a) SSP0, (b) SSP1, (c) SSP2, (d) SSP3, and (e) SSP4, using an intensity axis on a linear scale. The contour plot of pure fluorophosphate glass (f) is also shown for comparison. With increasing the ratio of SnO/SnF2, the red-shift of PLE peak was easily observed due to the nephelauxetic effect. The pure fluorophosphate glass shows no emission and the SSP glasses show broad emission in the range from 400 to 700 nm. Around 520 nm PL peak also red-shifts with increasing the ratio of SnO/SnF2.
Fig. 8 shows the emission decay curves of the SSP glasses with different ratios of SnO/SnF2, where is excited by UV light of 330 nm. The decays are composed of two parts: a faster decay possessing a lifetime of 2 ns and a slower decay possessing a lifetime of 11 ns, albeit both on the order of nanoseconds. In borate and phosphate glass,31,32 the decays also consist of two parts: a faster decay and a slower decay. However, these slower belong to the microsecond level decay. This difference may be due to different concentrations of Sn. It was reported that the lifetime decreases with increasing SnO amount.28 In the present article, the total tin concentration is as high as 70 mol%, which may account for a fast decay with a lifetime of nanoseconds. Compared with Ce3+-doped fluorophosphates,34 the SnF2–SnO–P2O5 glasses exhibited an extremely fast decay lifetime, which is a potential application for the fast scintillation.
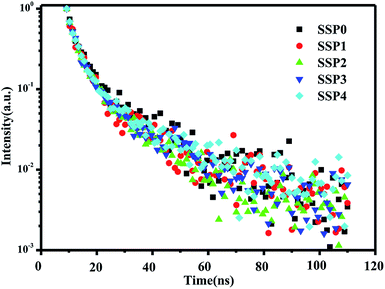 | ||
| Fig. 8 The emission decay curves of the SSP glasses with different ratios of SnO/SnF2, where is excited by UV light of 330 nm. | ||
Fig. 9 shows daylight pictures and luminescence images excited by a UV light at 365 nm for all prepared SSP glasses, respectively. As we can see from Fig. 9, the SSP glasses are homogeneous, completely transparent and are colorless. Luminescence images of SSP samples, excited with a UV lamp at 365 nm indicates a different color rendering of the emission from light blue (SSP0 glass samples) to pale green (SSP4 glass samples) according to the ratio of SnO/SnF2. The color chromaticity coordinates of the SSP glasses are also shown in Fig. 9. The color gradually shifts from blue to white and finally falls into the green region with varying SnO/SnF2 molar ratios (as indicated by the black arrow). Perfect white light emission is obtained in SSP2 and SSP3 samples with the CIE coordinates of (0.284, 0.347) and (0.301, 0.379), respectively, indicating that tin fluorophosphate glasses without rare earth could be used as white-emitting phosphors for UV LED chips.
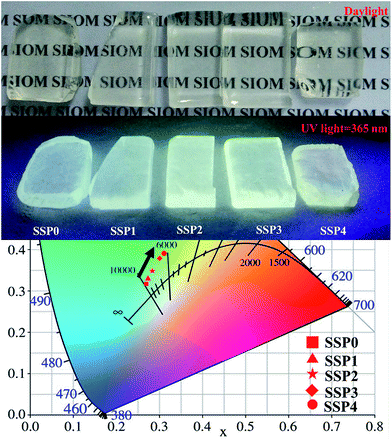 | ||
| Fig. 9 Daylight pictures and luminescence images excited by a UV light at 365 nm for all prepared SSP glasses, respectively. | ||
Conclusions
A series of tin fluorophosphate glasses with varying SnO/SnF2 molar ratios were prepared via a two-step melting method to demonstrate UV-excited PL properties. Broad photoluminescence in the range from 400 nm to 700 nm, originating from the S1–S0 and T1–S0 transitions of Sn2+ respectively, was obtained at room temperature. Moreover, the SnF2–SnO–P2O5 glasses exhibited a fast decay lifetime of 2 ns. Both energies of the excitation peak and emission peak depend on the local structure of Sn2+. White light can be generated by appropriately altering the SnO/SnF2 molar ratios in the SnF2–SnO–P2O5 glasses. Our present systematic study broadens the application of SnF2–SnO–P2O5 glasses with low Tg (<200 °C), making it possible to achieve white light emission by glass without rare earth.Conflicts of interest
There are no conflicts to declare.References
- Y. Lin, R. Tyler, H. Sun, K. Shi and D. A. Schiraldi, Polymer, 2017, 127, 236–240 CrossRef.
- J. York-Winegar, T. Harper, C. Brennan, J. Oelgoetz and A. Kovalskiy, Phys. Procedia, 2013, 44, 159–165 CrossRef.
- D. Ehrt, J. Non-Cryst. Solids, 2008, 354, 546–552 CrossRef.
- H. Liu, J. Ma, J. Gong and J. Xu, J. Non-Cryst. Solids, 2015, 419, 92–96 CrossRef.
- D. Chen, S. Yuan, X. Li and W. Xu, RSC Adv., 2017, 7, 36168–36174 RSC.
- X. Xiang, B. Wang, H. Lin, J. Xu, J. Wang, T. Hu and Y. Wang, J. Eur. Ceram. Soc., 2017 DOI:10.1016/j.jeurceramsoc.2017.10.013.
- F. Qi, F. Huang, T. Wang, R. Lei, J. Zhang, S. Xu and L. Zhang, Chin. Opt. Lett., 2017, 15, 051604–051606 CrossRef.
- H. Yu, Y. Liu, J. Guo, L. Zhang, H. Lin and X. Liang, Chin. Opt. Lett., 2017, 15, 071406–071408 CrossRef.
- L. Y. Zhang, H. Li and L. L. Hu, J. Alloys Compd., 2017, 698, 103–113 CrossRef.
- J. A. Jimenez, M. Sendova, E. R. Fachini and C. Zhao, J. Mater. Chem. C, 2016, 4, 9771–9778 RSC.
- W. C. Wang, Q. H. Le, Q. Y. Zhang and L. Wondraczek, J. Mater. Chem. C, 2017, 5, 7969–7976 RSC.
- P. A. Tick, Phys. Chem. Glasses: Eur. J. Glass Sci. Technol., Part B, 1984, 25, 149–154 CAS.
- J. S. Cathy and M. Shaw, Commun. Am. Ceram. Soc., 1988, 75, 252–254 Search PubMed.
- J. Y. Ding, P. Y. Shih, S. W. Yung, K. L. Hsu and T. S. Chin, Mater. Chem. Phys., 2003, 82, 61–67 CrossRef CAS.
- R. J. E. Stojan Radic and R. Boyd, Opt. Lett., 1998, 23, 1730–1732 CrossRef.
- I. J. S. Induja and T. Mailadil, J. Am. Ceram. Soc., 2017, 100, 2632–2640 CrossRef CAS.
- S. Jiang, T. Luo and J. Wang, J. Non-Cryst. Solids, 2000, 263–264, 358–363 CrossRef.
- B. Liu, X. He, M. Gu, S. Huang, X. Liu, X. Ouyang, Z. Qi and G. Zhang, J. Non-Cryst. Solids, 2008, 354, 3462–3467 CrossRef.
- K. Jha and M. Jayasimhadri, J. Am. Ceram. Soc., 2017, 100, 1402–1411 CrossRef.
- Y. Fang, M. Herbert, D. A. Schiraldi and C. J. Ellison, J. Mater. Sci., 2014, 49, 8252–8260 CrossRef.
- Y. J. Wang, C. Wang, S. Kang and L. Y. Zhang, J. Lumin., 2017, 186, 268–272 CrossRef.
- A. K. Yadav and P. Singh, RSC Adv., 2015, 5, 67583–67609 RSC.
- J.-J. Shyu and C.-C. Chiang, J. Am. Ceram. Soc., 2010, 93, 2720–2725 CrossRef.
- J. Trimble, R. Golovchak, C. Brennan and A. Kovalskiy, Phys. Chem. Glasses: Eur. J. Glass Sci. Technol., Part B, 2016, 57, 27–31 CrossRef.
- G. Poirier, Y. Messaddeq, S. J. L. Ribeiro and M. Poulain, J. Solid State Chem., 2005, 178, 1533–1538 CrossRef.
- D. Ehrt, P. Ebeling and U. Natura, J. Non-Cryst. Solids, 2000, 263, 240–250 CrossRef.
- H. Masai, T. Fujiwara, S. Matsumoto, Y. Tokuda and T. Yoko, J. Non-Cryst. Solids, 2014, 383, 184–187 CrossRef.
- H. Masai, T. Tanimoto, T. Fujiwara, S. Matsumoto, Y. Tokuda and T. Yoko, Opt. Express, 2012, 20, 27319–27326 CrossRef CAS PubMed.
- L. Skuja, J. Non-Cryst. Solids, 1992, 149, 77–95 CrossRef CAS.
- J. A. Jiménez, J. Inorg. Organomet. Polym., 2016, 27, 372–379 CrossRef.
- H. Masai, Y. Yamada, Y. Suzuki, K. Teramura, Y. Kanemitsu and T. Yoko, Sci. Rep., 2013, 3, 3541–3548 CrossRef PubMed.
- M. Hirokazu, T. Toshiro, O. Shun, T. Kentaro, M. Syuji, Y. Takayuki, T. Yomei and Y. Toshinobu, J. Mater. Chem. C, 2014, 2, 2137–2143 RSC.
- H. Masai, T. Tanimoto, T. Fujiwara, S. Matsumoto, Y. Tokuda and T. Yoko, Chem. Lett., 2013, 42, 132–134 CrossRef CAS.
- Y. Yao, L. Liu, Y. Zhang, D. Chen, Y. Fang and G. Zhao, Opt. Mater., 2016, 51, 94–97 CrossRef CAS.
| This journal is © The Royal Society of Chemistry 2018 |

