 Open Access Article
Evolution of entrained water film thickness and dynamics of Marangoni flow in Marangoni drying
Changkun Li,
Dewen Zhao*,
Jialin Wen,
Jie Cheng and
Xinchun Lu *
*
State Key Laboratory of Tribology, Tsinghua University, Beijing 100084, China. E-mail: xclu@tsinghua.edu.cn; zhaodw@tsinghua.edu.cn
First published on 30th January 2018
Abstract
As an ultra-clean wafer drying technique, Marangoni drying has been widely applied in the integrated circuits manufacturing process. When the wafer is vertically withdrawn from a deionization water bath, Marangoni stress along the meniscus, which is induced by the organic vapour, strips off the water film entrained on the wafer surface, and the wafer drying is thereby realized. In this work, a numerical model is presented that is comprised of the film, meniscus, and bulk regions for Marangoni drying. The model combines the transfer of organic vapour from air to water and the withdrawal of the wafer from the bath. The evolution of the entrained water film thickness, the tangential velocity, and the stress at the air–water interface are quantitatively investigated. The results reveal that the thickness of the entrained water film is reduced by more than one order of magnitude compared with the wafer withdrawn process without the Marangoni effect. In addition, owing to the receding of the contact line, it is found that the capillary pressure gradient dramatically increases, which contributes to the sudden increase in the tangential velocity in the dynamic meniscus. Moreover, the tangential velocity decreases in the static meniscus adjacent to the dynamic meniscus, which results from the redistribution of the interfacial concentration of the organic species driven by the Marangoni flow.
1 Introduction
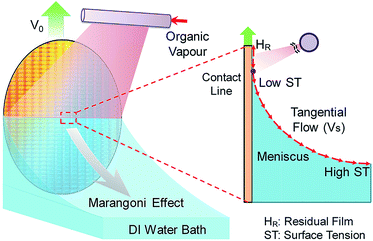
Owing to the ability to drive and control fluid flow,1 the Marangoni effect2–5 has been applied in many technologies, including self-assembly,6,7 coating,8–10 and Marangoni drying.11,12 Marangoni drying can realize the drying of wafers by Marangoni-driven flow after a sequence of wet cleaning processes, and it has been widely employed in the manufacturing of integrated circuits (ICs).13 When a wafer is withdrawn from a deionization (DI) water bath, a meniscus and an entrained water film are induced on the wafer surface, as shown in Fig. 1. Meanwhile, an organic vapour from an extra source is blown at the meniscus, and gives rise to a downward Marangoni stress. This can drive the water flow from the contact line to the bath, leading to a much thinner residual water film without contaminants compared with the traditional drying techniques.14,15 Therefore, Marangoni drying achieves an ultra-clean surface. Although Marangoni drying is widely utilized in the industry, its mechanism remains elusive. As the technology node of the IC shrinks to less than 14 nm, the requirements for cleaning the wafer surface become increasingly critical. Further improvement of the drying performance strongly depends on the comprehensive understanding of Marangoni drying.Huethorst and Marra14,15 observed the dynamic wetting behaviour of sessile droplet on the hydrophilic substrate in the organic vapour. The result showed that the Marangoni effect gives rise to the receding of the contact line and thus a nonzero apparent contact angle. Hernández-Sánchez et al.16 investigated the spreading of a circular thin region in the horizontal water film driven by the Marangoni effect through the continuous supply of isopropanol–water droplets. It was found that the law of radius growth and the depression in the film depend on the Marangoni stress and viscous force. In addition, the residual water film thickness after Marangoni drying was indirectly measured. In the vapour supplying ways of vapour blown at the meniscus and diffusion in semi-quiescent environment, the minimum residual thicknesses are 14 nm and 110 nm, respectively.14 The results suggested that the minimum residual film is much thinner than the thickness of 200 nm in the traditional spinning drying technology.17 These experimental investigations have elucidated the basic physical principle of Marangoni drying. However, it is difficult to conduct a direct observation or quantitative analysis of the dynamics of Marangoni drying, such as the interfacial flow and the stress in the meniscus under the geometries of the wafer withdrawn and gas–liquid mass transfer.
The numerical simulation has been an effective method to quantitatively examine the Marangoni-driven flow. The Marangoni effect induced by the surfactant in the solution during the dip-coating process has received considerable attention.18–20 The results revealed that the Marangoni effect realizes the thickening of entrained film, and the film-thickening factor is larger than one.21–23 Although Marangoni drying is similar to this issue, the solution of Marangoni drying are much challenging because of the dramatic reduction of entrained film thickness by 10 to 100 times compared with dip-coating without the Marangoni effect.24 The previous numerical investigations of Marangoni drying are based on lubrication approximation.25 Thess and Boos26 proposed a model for Marangoni drying, where the mass transport of the organic vapour was ignored and the distribution of surface tension was prescribed to be a linear function of position, and the results suggested that the residual film monotonically decreases in accordance with the surface tension gradient. Furthermore, Matar and Craster27 proposed numerical models which coupled the gas–liquid mass transfer behaviour of the organic vapour and the wafer withdrawn from a bath. In their work, the distribution of the surface tension and the morphology evolution in the thin film region were obtained. These studies emphasized the hydrodynamics of the thin film with the Marangoni effect and established the foundation for elucidating the Marangoni drying mechanism. However, the study of the flow field and the flow dynamics in the meniscus, which are significant to revealing the dynamic process of Marangoni-driven flow, have not been fully addressed in quantitative terms in Marangoni drying.
In this paper, a Marangoni drying model that considers the film, meniscus, and bulk regions is proposed. Firstly, the evolution of the thickness of entrained water film is investigated. In addition, the flow field in the meniscus and the time–spatial evolution of the tangential velocity at the whole interface are quantitatively examined. Furthermore, the Marangoni stress, Marangoni number, and capillary pressure gradient are analysed to interpret the evolution law of the interfacial flow mechanism. Moreover, the effects of the withdrawing velocity and vapour source on the drying performance are discussed. The results of this work are expected to contribute to the comprehensive understanding of the Marangoni drying process.
2 Model formulation
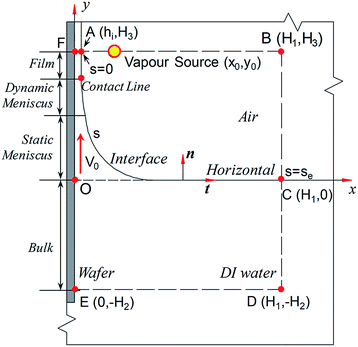
The adopted model with consideration of a wafer vertically withdrawn from a DI water reservoir with a constant velocity of V0 is shown in Fig. 2. The wafer is withdrawn along the y axis by a height of H3, and a water film is entrained on the wafer surface with the thickness of hi, which is initially unknown. Furthermore, the film, meniscus and bulk regions are contained in this model. The meniscus contains two regions: the dynamic meniscus and the static meniscus. In the static meniscus, the morphology is steady during the wafer withdrawn process. The dynamic meniscus is the intermediate region that connects the flat film region and the curved static meniscus region.28 The intersection point between the film and the dynamic meniscus region is defined as the contact line in the two-dimensional model. The air–water interface ranges from s = 0 to s = se, and the variable s is the interfacial length. The interface of bulk water region and air is specified as the horizontal.It is assumed that the organic vapour is diffused from a line-mass source at (x0, y0) in the quiescent environment referencing Matar's model,27 which corresponds with the regime of the ‘semi-quiescent vapour in the environments’ in previous experiments. In this work, it is assumed that the wafer is perfectly wetted with the contact angle of zero. Because the direct evaporation of water will give rise to the watermarks, the evaporation in Marangoni drying is inhibited.29 Therefore, the thermal Marangoni effect induced by evaporation is neglected.
2.1 Governing equations
Both the DI water and the air are Newtonian fluids with constant densities and dynamic viscosities. The velocity field in Cartesian coordinates is u = (u, v). The air–water two-phase flow is described using the full Navier–Stokes equations and the continuity equation, which are formulated in the Arbitrary Lagrangian–Eulerian (ALE) frame. The ALE frame combines the advantages of Eulerian (fixed in space) and Lagrangian (etched into material) methods. It enables the mesh nodes to move with material for accurately tracing the interface, while also to fix in space to avoid the immense deformation inside the material.30 The descriptions of the mesh and material velocities are and
and  , respectively, where Xm and X are the respective mesh and material coordinates. The convective velocity uc in the mesh coordinate can be obtained using the chain rule, which was previously described in detail.31 Here, we refer to the result as follows:
| uc = u(X, t) − u(Xm, t) | (1) |
The governing equations in the ALE frame are as follows:
(1) The two-phase flow is described by the Navier–Stokes equations and continuity equation,
 | (2) |
| ∇·u = 0 | (3) |
(2) The transfer of organic vapour from a line-mass source to the interface in air is described by the diffusion equation,27
 | (4) |
 | (5) |
Q0 is produced by line-mass source q0, which is shown as a point located at (x0, y0) in the two-dimensional model. It is given by:
 | (6) |
(3) In the DI water phase, the concentration of the organic species is governed by the convection–diffusion equation,
 | (7) |
(4) At the air–water interface, the concentration of the organic species satisfies the mass balance equation; that is,32
 | (8) |
2.2 Boundary condition
(2) The flow at the lateral boundary (x = H1, −H2 ≤ y ≤ 0) in water is assumed to occur along the negative x direction, and the boundary stress is21
 | (9) |
The gravity in air is neglected; thus, the lateral boundary condition in air (x = H1, 0 ≤ y ≤ H3) is
 | (10) |
(3) The flow at the bottom boundary (y = −H2, 0 ≤ x ≤ H1) is assumed to occur along the positive y direction. Hence, we specify the boundary stress as follows:21
 | (11) |
(4) At the top boundary of the air phase (y = H3, hi ≤ x ≤ H1), we assume that the air above the water is infinite and the open boundary condition is utilized; that is,
| Tg·n = 0 | (12) |
(5) At the air–water interface, the boundary stress is specified.33 The force balance in the normal direction is
| (n·Tg − n·Tl)·n = σ(∇·n) − Π | (13) |
| Π = A/(6πh3) | (14) |
| (n·Tg − n·Tl)·t = −∇sσ·t | (15) |
(6) On the interface (0 ≤ s ≤ se), the kinematic condition is specified as30
 | (16) |
 is the velocity of the nodes at the air–water interface.
(2) The top and lateral boundaries in the water phase are the outflow boundaries; that is,
| −n·Dl∇cl = 0 | (17) |
(3) The flux of vapour from air to the interface and from the interface to water are R1 and R2, respectively. Therefore, the net flux Rs at the air–water interface is27
| Rs = R1 − R2 = (kgscg − ksgcs) − (kslcs − klscl) | (18) |
(4) The dependence of the interfacial concentration on the surface tension is described by an exponential equation,27,34
| σ = σ0e−(βcs) | (19) |
 | (20) |
The movements of the nodes on the boundaries are specified as follows:
(1) On the bottom boundary, the displacements of the mesh in x and y directions are specified as zero: dx = 0 and dy = 0.
(2) On the lateral boundary and moving wall boundary, the displacement of the mesh in the x direction is fixed (dx = 0).
(3) On the exit boundary of water and the top boundary of air, the displacement of the mesh in the y direction is fixed (dy = 0).
2.3 Initial condition
The initial condition of Marangoni drying is difficult to directly obtain; thus, we divide the Marangoni drying into two steps. The first one is to solve the classic problem of the wafer withdrawn from an infinite bath (dip coating) without organic species to obtain the approximate steady-state solution with a series of withdrawing velocities (V0). The thickness of hi is assumed to be 0.1 mm. In this step, the velocity field, pressure, interfacial morphology, and value of film thickness h0 are obtained.In the second step, we choose the results of dip coating as the initial conditions to solve the Marangoni drying problem, which couples the two-phase flow with the gas–liquid mass transfer of the organic vapour. In this study, t = 0 s is the start time of blowing the organic vapour from the source. The value of the constants and range of the parameters are given in Table 1.
| Constant | Value | parameter | range |
|---|---|---|---|
| ρl (kg m−3) | 103 | V0 (mm s−1) | 0.4–20 |
| ρg (kg m−3) | 1.205 | kgs (m s−1) | 10−2–1 |
| μl (Pa s) | 10−3 | κ (1) | 0–0.01 |
| μg (Pa s) | 10−5 | kls (m s−1) | 0–10−6 |
| σ0 (N m−1) | 0.072 | q0 (mol m−1 s−1) | 10−4–10−2 |
| Dg (m2 s−1) | 10−5 | β (m2 mol−1) | 0.5–4 |
| Ds (m2 s−1) | 10−9 | ||
| Dl (m2 s−1) | 10−9 | ||
| A (J) | 10−19 |
2.4 Numerical method
Finite element method (FEM) is employed to discretize the equations and boundary conditions. The computing domain is tessellated using the triangular elements. The Lagrange linear elements are implemented for all the dependent variables of velocity, pressure, and concentration. Because of the immense deformation of the air–water interface, the mesh quality becomes poor and the algorithm will not be able to converge. Therefore, an automatic remeshing method is utilized to establish new meshes when the mesh quality degrades below a specified level of 0.1. The iteration continues with the new reference configuration with high-quality meshes until the iteration is complete.30 The numerical work is implemented in COMSOL Multiphysics. Additionally, the mesh sensitivity analysis is conducted, and the residual film thickness is obtained with a different number of grids. The results in Table 2 show that the relative deviation of the residual film thickness is less than 0.2% when the number of grids increases from 806![[thin space (1/6-em)]](https://www.rsc.org/images/entities/char_2009.gif) 064 to 966
064 to 966![[thin space (1/6-em)]](https://www.rsc.org/images/entities/char_2009.gif) 020, thereby obtaining the results that are independent of the grid size.
020, thereby obtaining the results that are independent of the grid size.
| Grid Number | Residual film thickness ht=te (μm) | Relative error (%) |
|---|---|---|
496![[thin space (1/6-em)]](https://www.rsc.org/images/entities/char_2009.gif) 265 265 |
0.1368 | — |
585![[thin space (1/6-em)]](https://www.rsc.org/images/entities/char_2009.gif) 210 210 |
0.1424 | 3.93 |
720![[thin space (1/6-em)]](https://www.rsc.org/images/entities/char_2009.gif) 635 635 |
0.1469 | 3.06 |
806![[thin space (1/6-em)]](https://www.rsc.org/images/entities/char_2009.gif) 064 064 |
0.1482 | 0.877 |
966![[thin space (1/6-em)]](https://www.rsc.org/images/entities/char_2009.gif) 020 020 |
0.1484 | 0.135 |
3 Results and discussion
3.1 Evolution of entrained water film thickness
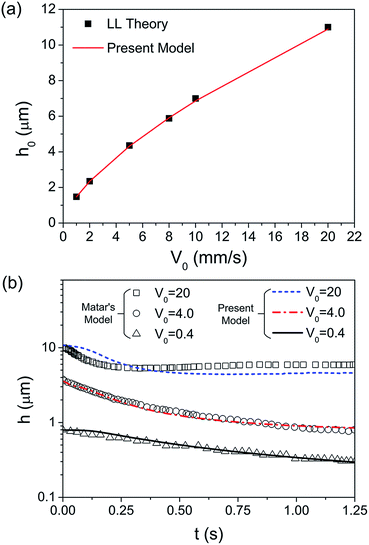
As shown in Fig. 3b, the evolution law of h in the present model matches well with that of Matar, especially for V0 = 0.4 and 4 m s−1. Because of the difference of the vapour source position in the y direction, there is a deviation of V0 = 20 mm s−1 between these two models. However, the trend of the water film reduction is the same and the value of the film thickness is similar. These comparisons in this study verify that our model is correct and effective in investigating the evolution of water film thickness and the dynamics of Marangoni flow.
| te = (H3 − HM)/V0 | (21) |
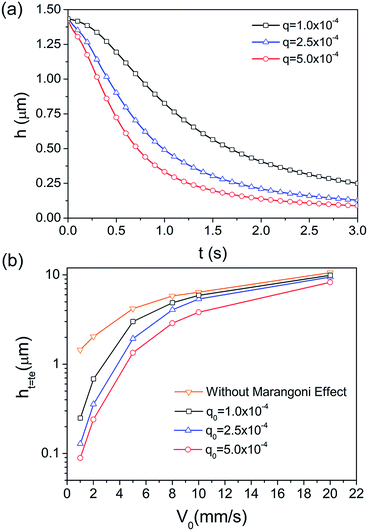
As shown in Fig. 4a, the entrained water film thickness monotonously reduces with continuously blowing of the organic vapour. The film thickness initially rapidly reduces and then becomes much slower since the film reduction leads to the increase in the viscous force, which resists the further film reduction. The parameters used were specified as kgs = 0.8 m s−1, ksg = kls = 0, κ = 2 × 10⁻⁴ and β = 3 m2 mol−1. As shown in the previous experimental results with the vapour supply method of ‘vapour diffusion in a semi-quiescent environment’, the residual thicknesses of entrained water film with the withdrawing velocity of 0.7 mm s−1 and 1.5 mm s−1 are 110 nm and 160 nm, respectively. In the present model, the thickness of residual film with V0 = 1 mm s−1 and q0 = 2.5 × 10⁻⁴ mol (m−1 s−1) is 148 nm, which validates that the prediction of the water film thickness using the present model is reliable. The thinning effect of water film thickness is more dramatic with the increase in the vapour source. Additionally, the increase in the withdrawing velocity leads to not only the increase of the viscosity force, but also the decrease of the necessary drying time. Therefore, the Marangoni effect is weaker and the residual film after drying remarkably thickens (Fig. 4b).
3.2 Dynamics of Marangoni flow
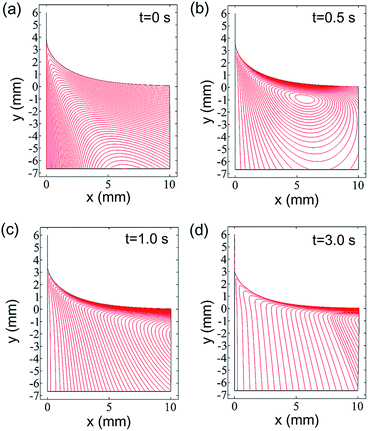
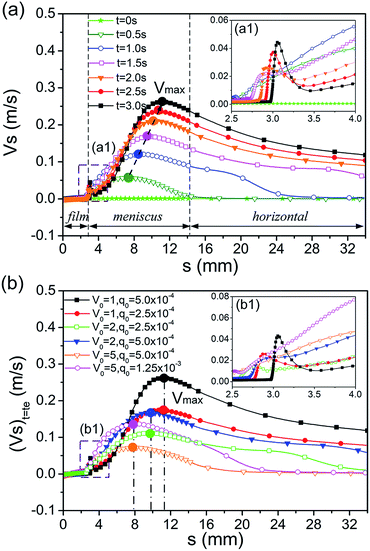
To elucidate the evolution mechanism of the entrained water film, the dynamics of Marangoni flow, including the flow field in the meniscus and the tangential velocity at the whole air–water interface, were investigated.The maximum value of the tangential velocity Vmax increases and gradually flows away from the meniscus. In particular, the tangential velocity increases suddenly in the dynamic meniscus when the drying time t is large than 1.5 s and then it reduces to be smaller than that of t < 1.5 s in the static meniscus adjacent to the dynamic meniscus. This phenomenon is enhanced during the drying process. As shown in Fig. 6b, the maximum tangential velocities at the last moment of the drying process are located in the identical position for the same withdrawing velocity and thus for the same drying time. Furthermore, the maximum velocity at the last moment of the drying process increases with the vapour source, q0. Furthermore, the maximum tangential velocity of V0 = 5, q0 = 1.25 × 10⁻³ is much smaller than that in the case of V0 = 1, q0 = 2.5 × 10⁻⁴, although the total concentration of the blown organic vapour in these two cases are the same.
3.2.3.1 Marangoni stress. The expression of Marangoni stress is
 | (22) |
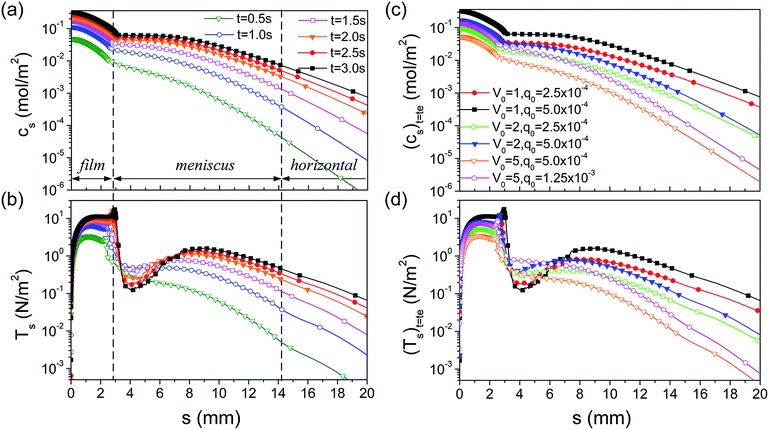
As shown in Fig. 7a, the interfacial concentration decreases monotonously from s = 0 to the horizontal region, and the interfacial concentration at the whole interface increases with the continual supply of the organic vapour. The concentration at the contact line alters remarkably and thus the Marangoni stress is the largest. Furthermore, the concentration gradient in the static meniscus adjacent to the dynamic meniscus reduces gradually, and the Marangoni stress reduces correspondingly. Subsequently, another maximum point occurs in the static meniscus and gradually moves towards the horizontal. The evolution of the Marangoni stress accounts for the redistribution of the concentration driven by the tangential flow, which, in turn, gives rise to the reduction in the concentration gradient.37 This is the reason for the reduction in the tangential velocity in the static meniscus adjacent to the dynamic meniscus.
As shown in Fig. 7c, the interfacial concentration increases with the enhancement of q0 under the same withdrawing velocity. Moreover, the higher q0 gives rise to a higher velocity of Marangoni flow. Therefore, more organic molecules are carried along with the tangential flow from the higher concentration position to the lower one. As a result, the distribution of the interfacial concentration and the Marangoni stress in the meniscus for different values of q0 tend to be parallel to each other (Fig. 7c). This is the reason that the position of Vmax depends on the drying time (Fig. 6b).
3.2.3.2 Marangoni number. The Marangoni number was introduced to investigate the competition behaviour of the Marangoni stress and the viscous force induced by the wafer withdrawn.38,39
 | (23) |
Owing to the immense variation in thickness from the film to the meniscus region, the single characteristic length in the Marangoni number is not available. Additionally, the real-time value of the film thickness (xh) is assigned to the h when xh is less than the capillary length (lc). Otherwise, lc is utilized and the expression is
 | (24) |
As shown in Fig. 8a, the Marangoni number in the film region is much smaller than that in the meniscus, and it decreases gradually in the static meniscus with time. Its maximum is away from the meniscus. Therefore, in the film region, the viscous force is the dominated factor with respect to the tangential velocity, whereas, in the meniscus region, the Marangoni stress becomes the dominated one because of the reduction of viscous force. The migration of the maximum value of the Marangoni number and the decrease in the static meniscus result from the redistribution of the interfacial concentration (Fig. 7b). Fig. 8b shows that the Marangoni number under the higher V0 is much smaller than that under the lower one, although the Marangoni stress is similar in the film and meniscus regions. This is the reason that the tangential velocity is much smaller under the higher V0 in Fig. 6b.
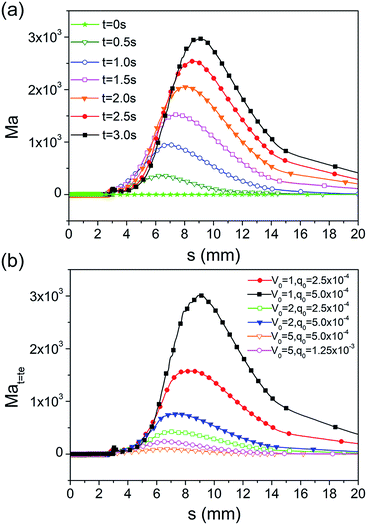 | ||
| Fig. 8 (a) Time–spatial evolution of the Marangoni number during the drying process. (b) Marangoni number at the last moment of the drying process with different values of V0 and q0. | ||
3.2.3.3 Capillary pressure gradient. The Marangoni effect not only gives rise to the tangential flow, but also induces the evolution of the interfacial morphology.26 As shown in Fig. 9a, the contact line recedes gradually driven by the Marangoni flow resisting the viscous force. This results in the dramatic increase of the curvature in the dynamic meniscus region. Fig. 9b shows that the movement of the contact line is much further with an increase in the Marangoni stress for the same V0, and the locations of the contact line for the same total concentration of the blown organic vapour are remarkably different when we compare the case of V0 = 5, q0 = 1.25 × 10⁻³ with V0 = 1, q0 = 2.5 × 10⁻⁴.
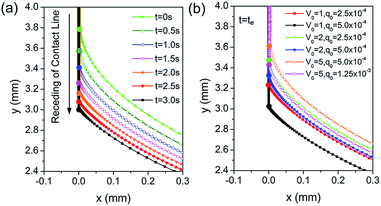 | ||
| Fig. 9 (a) Time–spatial evolution of the interfacial morphology at dynamic meniscus; (b) Interfacial morphology at the last moment of the drying process with different values of V0 and q0. | ||
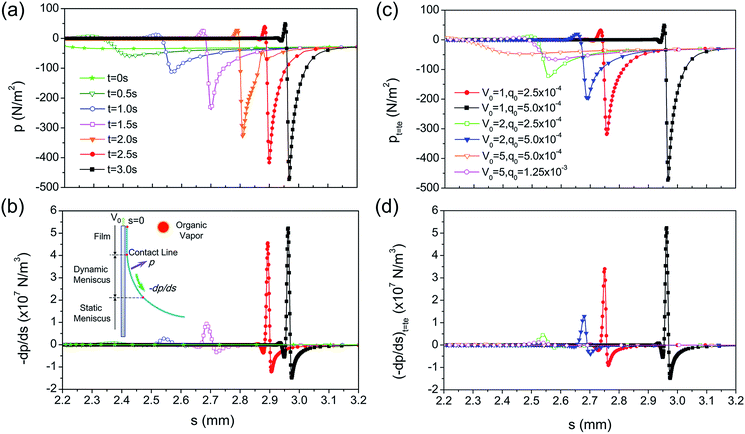
In the previous study, it was found that the upward Marangoni stress along the meniscus resulted in the stretching of the dynamic meniscus and thus the decrease in the capillary pressure gradient.22 In contrast, in Marangoni drying the downward Marangoni stress may have induced the receding of the contact line and the shrinking of the dynamic meniscus, leading to a dramatic increase in capillary pressure. To verify this, the time–spatial evolution of capillary pressure was examined along the meniscus. Fig. 10a shows the capillary pressure (the negative value) from the film to the meniscus region, which changes dramatically in the dynamic meniscus. Fig. 10b shows that the rapid variation of capillary pressure in the dynamic meniscus leads to a high pressure gradient in the tangential direction, which drives the tangential flow from the high-pressure region to the low-pressure one. Consequently, it promotes the water flow from the film region to the meniscus and thus the reduction of the film thickness. The capillary pressure gradient is higher when the contact line recedes further; hence, it results in a more dramatically sudden increase in the tangential velocity. Furthermore, it is found that the pressure gradient is very small when t is smaller than 1.5 s, and then it increases dramatically. This is consistent with the evolution of tangential velocity in the dynamic meniscus in Fig. 6a1. Fig. 10c also indicates that the stronger Marangoni effect leads to a more remarkable receding of the contact line and a much larger capillary pressure gradient. As a result, the pressure gradient has an important effect on the tangential velocity, and this is the reason for the sudden increase in the tangential velocity in the dynamic meniscus.
4 Conclusions
A numerical model of Marangoni dying with consideration of the film, meniscus, and bulk regions was developed and herein presented. The model combines the wafer withdrawn and the organic vapour transfer across the air–water interface from a vapour source. The evolution of the entrained water film thickness, flow field, and tangential velocity were quantitatively investigated. Furthermore, the Marangoni stress, Marangoni number, and capillary pressure gradient were analysed to reveal the mechanism of interfacial flow.The findings in this paper show that the residual film thickness after drying is monotonously reduced by more than one order of magnitude, and the evolution of entrained water film thickness agrees well with the previous studies. In addition, the time–spatial evolution of the tangential velocity shows the obvious differences in the film, meniscus, and horizontal regions, which result from the differences in the competitive behaviours of Marangoni stress and viscous force induced by the wafer withdrawn in these regions. Furthermore, the tangential velocity increases along the meniscus, and the maximum tangential velocity increases and moves towards the horizontal. Particularly, it is found that the tangential velocity increases suddenly in the dynamic meniscus and then decreases remarkably in the static meniscus adjacent to the dynamic meniscus. The sudden increase in the tangential velocity in the dynamic meniscus results from the receding of the contact line and the shrinking of the dynamic meniscus, which lead to the dramatic increase in the capillary pressure gradient in the tangential direction. The decrease in tangential velocity in the static meniscus adjacent to the dynamic meniscus results from the redistribution of the interfacial concentration of the organic species driven by the Marangoni flow and thus the decrease in the Marangoni stress in this region.
The analysis of the water film evolution with the parameters of withdrawing velocity and vapour source, as well as the discussion of Marangoni flow dynamics, are expected to provide useful guidance for the controlling of this process and the designing of the Marangoni dryer.
Conflicts of interest
There are no conflicts of interest to declare.Acknowledgements
The authors greatly appreciate the financial support of National Natural Science Foundation of China (Grants No. 51305227, 91323302 and 51705278).References
- R. Krechetnikov, Soft Matter, 2017, 13, 4931–4950 RSC.
- C. Zhang and P. Akcora, RSC Adv., 2017, 7, 18321–18326 RSC.
- H. Kim, J. Lee, T. H. Kim and H. Y. Kim, Langmuir, 2015, 31, 8726–8731 CrossRef CAS PubMed.
- R. Vuilleumier, V. Ego, L. Neltner and A. M. Cazabat, Langmuir, 1995, 11, 4117–4121 CrossRef CAS.
- E. Hendarto and Y. B. Gianchandani, J. Micromech. Microeng., 2013, 23, 1–7 Search PubMed.
- Y. Cai and B. M. Z. Newby, J. Am. Chem. Soc., 2008, 130, 6076–6077 CrossRef CAS PubMed.
- L. K. Bera, O. K. Soo and W. Z. Zheng, RSC Adv., 2014, 4, 38384 RSC.
- X. Fanton, A. M. Cazabat and D. Quere, Langmuir, 1996, 12, 5875–5880 CrossRef CAS.
- O. Ou Ramdane and D. Quéré, Langmuir, 1997, 13, 2911–2916 CrossRef CAS.
- D. P. Birnie, Langmuir, 2013, 29, 9072–9078 CrossRef CAS PubMed.
- A. F. M. Leenaars, J. A. M. Huethorst and J. J. Van Oekel, Langmuir, 1990, 6, 1701–1703 CrossRef CAS.
- J. Marra, in Particles in Gases and Liquids 3, Springer US, Boston, MA, 1993, pp. 269–282 Search PubMed.
- J. S. Tang, W. Lu, B. Xi, E. Martinez, F. Li, A. Ko, C. Todd and J. T. C. Lee, Solid State Phenom., 2008, 134, 337–340 CrossRef CAS.
- J. Marra and J. A. M. Huethorst, Langmuir, 1991, 7, 2748–2755 CrossRef CAS.
- J. A. M. Huethorst and J. Marra, Langmuir, 1991, 7, 2756–2763 CrossRef CAS.
- J. F. Hernández-Sánchez, A. Eddi and J. H. Snoeijer, Phys. Fluids, 2015, 27, 217–239 Search PubMed.
- D. Meyerhofer, J. Appl. Phys., 1978, 49, 3993–3997 CrossRef.
- R. V. Craster and O. K. Matar, Rev. Mod. Phys., 2009, 81, 1131–1198 CrossRef CAS.
- O. K. Matar and R. V. Craster, Soft Matter, 2009, 5, 3801 RSC.
- B. Reisfeld, S. G. Bankoff and S. H. Davis, J. Appl. Phys., 1991, 70, 5258–5266 CrossRef CAS.
- D. M. Campana, S. Ubal, M. D. Giavedoni and F. A. Saita, Ind. Eng. Chem. Res., 2016, 55, 5770–5779 CrossRef CAS.
- D. M. Campana, S. Ubal, M. D. Giavedoni and F. A. Saita, Phys. Fluids, 2010, 22, 1–9 Search PubMed.
- D. M. Campana, S. Ubal, M. D. Giavedoni and F. A. Saita, Phys. Fluids, 2011, 23, 1–11 Search PubMed.
- R. Krechetnikov and G. M. Homsy, J. Fluid Mech., 2006, 559, 429 CrossRef.
- A. L. Bertozzi and M. Pugh, Commun. Pure Appl. Math., 1996, 49, 85–123 CrossRef.
- A. Thess and W. Boos, Phys. Fluids, 1999, 11, 3852–3855 CrossRef CAS.
- O. K. Matar and R. V. Craster, Phys. Fluids, 2001, 13, 1869–1883 CrossRef CAS.
- I. Schmidhalter, R. L. Cerro, M. D. Giavedoni and F. A. Saita, Phys. Fluids, 2013, 25, 42–54 CrossRef.
- M. Watanabe, M. Hamano and M. Harazono, Mater. Sci. Eng., B, 1989, 4, 401–405 CrossRef.
- D. M. Campana, S. Ubal, M. D. Giavedoni and F. A. Saita, Ind. Eng. Chem. Res., 2013, 52, 12646–12653 CrossRef CAS.
- K. Yang, F. Hong and P. Cheng, Int. J. Heat Mass Transfer, 2014, 70, 409–420 CrossRef.
- A. Pohjoranta, Modelling surfactant mass balance with the ALE method on deforming 2D surfaces, Helsinki University of Technology, 2008 Search PubMed.
- G. Karapetsas, K. C. Sahu and O. K. Matar, Langmuir, 2016, 32, 6871–6881 CrossRef CAS PubMed.
- S. B. G. M. O'Brien, J. Fluid Mech., 1993, 254, 649–670 CrossRef.
- L. Landau and B. Levich, Dynamics of Curved Fronts, 1988, 17, 141–153 Search PubMed.
- S. D. R. Wilson, J. Eng. Math., 1982, 16, 209–221 CrossRef.
- A. Mizev, A. Trofimenko, D. Schwabe and A. Viviani, Eur. Phys. J.: Spec. Top., 2013, 219, 89–98 CrossRef CAS.
- A. Babaie and B. Stoeber, Langmuir, 2015, 31, 9033–9040 CrossRef CAS PubMed.
- A. Babaie and B. Stoeber, Phys. Fluids, 2015, 27, 44–52 Search PubMed.
| This journal is © The Royal Society of Chemistry 2018 |

