 Open Access Article
Establishment of transport channels with carriers for water in reverse osmosis membrane by incorporating hydrotalcite into the polyamide layer†
Xinxia Tian ,
Jian Wang,
Huifeng Zhang,
Zhen Cao,
Man Zhao
 ,
Yipeng Guan and
Yushan Zhang*
Institute of Seawater Desalination and Multipurpose Utilization, State Oceanic Administration, Tianjin 300192, China. E-mail: yszhang_membr@163.com; Tel: +86-02287898130
First published on 3rd April 2018
Abstract
Thin film nanocomposite (TFN) reverse osmosis (RO) membranes were prepared by incorporating hydrotalcite (HT) in polyamide layer during interfacial polymerization process using two methods: (1) dispersing HT in aqueous solution directly; (2) preparing layered double oxide (LDO) via calcination of HT and then dispersing the obtained LDO in aqueous solution to reconstruct HT. The results demonstrated that TFN RO membranes exhibited higher water flux compared with the pristine RO membrane, which could be mainly attributed to water channels constructed by HT as well as the enhancement of hydrophilicity and the increase of relative surface area. In addition, TFN RO membranes prepared using LDO showed higher water flux than those prepared using HT, which is contributed to the uniform distribution of water channels in polyamide layer resulting from the process of calcination and reconstruction reaction. Compared with pristine RO membrane, water flux of TFN RO membranes prepared with 0.075 wt% HT and those prepared with 0.050 wt% LDO was enhanced by 19.1% and 22.8% without sacrificing the salt rejection.
1. Introduction
Over the past several decades, reverse osmosis (RO) has been an effective approach for brackish water and seawater desalination to alleviate the stress of global water scarcity.1,2 RO membranes with high water permeability and salt rejection have gained considerable research efforts.To date, aromatic polyamide (PA) thin film composite (TFC) membrane fabricated via interfacial polymerization dominated RO membrane products due to its ease in preparation and relatively high water flux and salt rejection. However, the performance of the PA membranes has reached a ceiling because of the inherent material limitations: the permeability–selectivity trade-off relationship.3 To overcome this limitation, Hoek and coworkers reported a novel concept of incorporating inorganic nanoparticles, which can deliver fast water transportation, into PA layers of RO membranes to prepare the so-called thin film nanocomposite (TFN) membranes. This strategy combines the superior water transport properties of nanosized particles and ease of TFC membrane fabrication. And to date, a wide variety of nanoparticles including zeolites (NaA, NaX, NaY and silicalite-1),4–7 carbon materials (including carbon nanotubes and graphene oxide),8–14 silica,15–17 metal oxides (titanium dioxide),13 metal nanoparticles18 and even novel organic–inorganic hybrid materials (ZIF-8)19 have been attempted to be introduced into PA layers of RO membranes. And most studies reported that TFN RO membranes exhibited better water flux than pristine TFC membrane while retaining or less sacrificing salt rejection.
In particular, porous nanoparticles currently show great application potential in RO membrane modification, because they possess unique structures which allow the fast permeation of water. Jeong et al. reported that embedding NaA zeolite in the PA layer could nearly double the water permeability of the RO membranes and proved that the pores of the zeolite nanoparticle played an active role in water permeability.4 In the work of Chan et al., water flux of TFN RO membranes incorporated with carbon nanotubes (CNTs) which was made partially aligned, could reach approximately thrice that of pristine RO membrane.9 Yin et al. introduced graphene oxide (GO) nanosheets into PA layer and the permeability of the obtained RO membranes was increased by 50%, which could be ascribed to the water channels provided by the interlayer spacing of GO nanosheets.20
The researches above demonstrated that porous nanoparticles in TFN RO membranes could provide high-speed channels for water transport due to the geometric characteristics of the nanoparticles. Meanwhile, water molecules would contact and interact with ions or functional groups in the pores of nanoparticles inevitably, and then the behavior of water molecules would be influenced. A series of molecular simulation studies have illustrated that ions or functional groups anchored on the nanoparticles would change the distribution and transport of water molecules.21–23 Hence, combining the advantages of geometric characteristics and chemical composition of nanoparticles is an effective approach to fabricate TFN RO membranes with excellent performance. Due to the unique hourglass structure with conserved charged residues,24 aquaporin has been introduced into the active layer of TFC RO membranes to enhance the permeability of the membranes.25 However, as aquaporin is biological material, it is expensive and perishable, which would lead to the increase in cost of RO membranes. Compared with aquaporin, inorganic nanoparticles cost lower and exhibit better chemical stability. To achieve the purpose of combination the advantages of geometric characteristics and chemical composition, the development of inorganic nanoparticles with perforated pores and ions or functional groups which could accelerate the transport of water molecules is an appropriate choice.
According to the mechanism of facilitated transport membranes used in gas separation, introduction of carriers which react reversibly with a particular component could facilitate the transport of this component, and hence enhance separation performance of the membranes.26 Accordingly, introduction of water carriers into the pores of nanoparticles is an effective method to combination the advantages of geometric features and chemical composition of the nanoparticles. Anions could be selected as water carriers due to the hydration of ions and separation of H2O molecules from the hydrated ions, which is similar to reversible reaction.27 Consequently, layered nanoparticles including hydrotalcite (HT) and potassium montmorillonite (MMT) consisting of charged brucite-like host layers and hydrated ions with opposite charges is in accordance with the characteristics mentioned above. Layered nanoparticles have been used as inorganic fillers to prepare nanocomposite membranes in various fields.27–35 The structure property of the layered nanoparticles is an important factor for the application in nanocomposite membranes as interlayer ions could facilitate the transport of a particular component through the TFN membranes.27,29,30
Herein, a novel strategy is suggested via the incorporation of layered nanoparticles to establish transport channels with water carriers in TFN RO membrane for high membrane permeability. Considering the advantages of structural stability, ease of synthesis and adjustability of particle size, Mg–Al-carbonate HT is suitable to be used to prepare TFN RO membranes. Known as layered double hydroxide, Mg–Al-carbonate HT consists of positively charged brucite-like host layers and hydrated carbonate anions moving through the unobstructed interlayer gallery.36 Under consideration, the layers of HT have high superposition and electrostatic attraction, which will result in the concentrating distribution of the water channels, and then decrease the efficiency of water transport. Nevertheless, the HT possesses a memory effect and reconstruction method could be used to strip the HT. After calcination in air atmosphere, HT would change into static electricity free layered double oxide (LDO) which is more loose and porous than HT. In addition, compared to HT, the layers of LDO without electrostatic attraction were easy to slide and exfoliate. Meanwhile, the LDO would adsorb large amounts of CO2 and reconstruct the carbonate-type HT when it is dispersed in aqueous solution. Therefore, HT would be introduced into the obtained membranes when LDO is dispersed in aqueous solution during the preparation process of RO membranes.
In the present work, TFN RO membranes were developed by incorporating HT. HT and LDO generated by calcining HT were dispersed in aqueous solution respectively, and TFN RO membranes were prepared via interfacial polymerization. HT and LDO were investigated by attenuated total reflectance Fourier transform infrared spectroscopy (ATR-FTIR), scanning electron microscopy (SEM) and X-ray diffraction (XRD). RO membranes were investigated by ATR-FTIR, contact angle goniometer, SEM, transmission electron microscope (TEM) and atomic force microscopy (AFM). The water flux and salt rejection were tested to evaluate the performance of the RO membranes. The influence of the incorporation of HT in the PA layer on the structure and performance of the RO membranes were studied and analyzed. Moreover, the advantages of the TFN RO membranes incorporated with the HT reconstructed from LDO over those incorporated with HT directly were investigated and the water transport mechanism was also proposed.
2. Experimental
2.1. Materials
m-Phenylenediamine (MPD, AR) and 10-camphor sulfonic acid (CSA, AR) were purchased from Aladdin Co., Ltd. Triethylamine (TEA, AR) was purchased from Tianjin Fengchuan Chemical Reagent Co., Ltd. Sodium dodecyl sulfate (SDS, ≥99.0%) was purchased from Sigma-Aldrich. Trimesoyl chloride (TMC, 98%) was purchased from Tianjin Heowns Biochemical Technology Co. Ltd. Solvent n-hexane (AR) was purchased from Tianjin Kemiou Chemical Reagent Co., Ltd. Magnesium nitrate hexahydrate (Mg(NO3)2·6H2O, AR), aluminum nitrate nonahydrate (Al(NO3)3·9H2O, AR), sodium hydroxide (NaOH, AR) and sodium carbonate (Na2CO3, AR) were purchased from Sinopharm Chemical Reagent Co., Ltd. Polysulfone (PSf) ultrafiltration membranes were purchased from Pureach Tech (Beijing) Ltd as porous substrates. Deionized water was produced by a home-made reverse osmosis system.2.2. Synthesis and characterization of HT, LDO and reconstructed LDO
The HT was prepared via hydrothermal method.30 The synthesis was carried out in a three-neck flask with a reflux condenser. In a typical procedure, 0.06 mol Mg(NO3)2·6H2O and 0.02 mol Al(NO3)3·9H2O were dissolved in 100 ml water solution containing 20 vol% ethanol. Then, the mixed basic solution of 2 M NaOH and 1 M Na2CO3 was added dropwise into the flask with stirring until the pH value reached to 10. The slurry obtained was stirred for an additional 30 min, and then was put into a stainless steel reactor and hydrothermally treated at 393.15 K for 24 hours. The resulting white solid product was centrifuged, washed with mixed solution of deionized water and anhydrous ethanol several times, air-dried at room temperature, and finally HT was obtained.LDO was prepared by calcining HT in an air atmosphere at 673.15 K for 5 hours. The LDO was dispersed in the aqueous solution which was used for fabricating TFC RO membranes and stirred for 5 days to reconstruct HT. The obtained nanoparticles would be investigated to guarantee that HT was reconstructed.
Attenuated total reflectance infrared (ATR-FTIR) spectroscopy (iS50, Nicolet of USA) was used to study the chemical structure of HT, LDO and reconstructed HT. X-ray diffraction (XRD, Miniflex 600, Rigaku of Japan) was used to investigate the crystal structure of HT, LDO and reconstructed HT. Scanning electron microscope (SEM, Nova Nano450, FEI of USA) was employed to observe the morphology of HT and reconstructed HT, and measure the thickness of the nanosheets. The diameter of original and reconstructed HT nanoparticles in aqueous solution was estimated via dynamic light scattering (DLS, NanoBrook Omni, Brookhaven Instrument of USA).
2.3. Preparation of RO membranes
RO membranes were prepared via interfacial polymerization method. Aqueous solution was prepared by dispersing certain amount of HT or LDO and dissolving MPD (2.0 wt%), TEA (1.1 wt%), CSA (2.6 wt%) and SDS (0.1 wt%) in water. Organic solution was prepared by dissolving TMC (0.1 wt%) in n-hexane. Firstly, the aqueous solution was contacted with the top surface of the substrates for 1 min, and then the excess solution was removed by pressing the surface with a soft rubber roller. Afterwards, organic solution was coated thereon and contacted with the top surface of the substrates for 1 min for TMC and MPD to react. Finally, the excess organic solution was removed and the resulting membrane was heated in an air-circulated dryer at 80 °C for 5 min. The TFN RO membranes prepared using aqueous solution with HT contents of 0.010, 0.025, 0.050, 0.075, 0.100 and 0.125 wt% were designated as H-0.010, H-0.025, H-0.050, H-0.075, H-0.100 and H-0.125, respectively. The TFN RO membranes prepared using aqueous solution with LDO contents of 0.010, 0.025, 0.050, 0.075, 0.100 and 0.125 wt% were designated as L-0.010, L-0.025, L-0.050, L-0.075, L-0.100 and L-0.125, respectively. The RO membranes prepared using aqueous solution without HT or LDO was designated as HL-0.2.4. Characterization of RO membranes
ATR-FTIR spectroscopy was used to study the chemical structure of RO membranes. Contact angle goniometer (JC2000D2, Zhongchen of China) was used to evaluate the surface hydrophilicity of RO membranes. Surface zeta potential of RO membranes was measured by a SurPASS solid surface zeta potential analyzer (Anton Paar, Austria) conducted in a background electrolyte solution containing 1 mM KCl. The zeta potential of RO membranes was computed from the Helmholtz–Smoluchowski equation. SEM was used to observe the surface morphology of RO membranes. Transmission electron microscope (TEM, H7650, Hitachi of Japan) was used to verify the existence of nanoparticles in PA layer of TFN RO membranes. Atomic force microscopy (AFM, Veeco of USA) was used to measure surface roughness of RO membranes in tapping model. The desalination performance of the RO membranes was evaluated in terms of water flux and salt rejection by a lab-scale cross-flow water permeation apparatus. Membranes were initially compacted at 1.55 MPa transmembrane pressure (TMP) for 0.5 h to reach a steady state. Then, the water flux was measured at 1.55 MPa TMP and 25 °C. The water flux J was calculated by the following equation:where A (m2) is the effective membrane area, V (L) is the volume of permeated water and Δt (h) is the permeation time.
Salt rejection R was calculated using the following equation:
3. Results and discussion
3.1. Characteristics of original HT, LDO and reconstructed HT
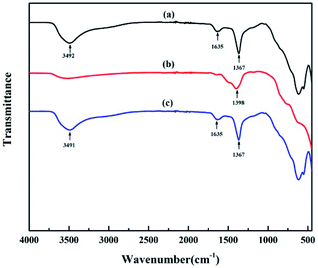
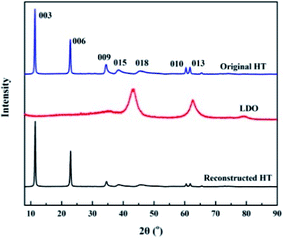
The ATR-FTIR spectra of original HT, LDO and reconstructed HT are shown in Fig. 1. The FTIR spectrum in Fig. 1(a) shows characteristic bands of HT.37 The intense peaks at 3492 cm−1 are assigned to the vibrational absorption of O–H, which can be attributed to the interlayer water molecules and the hydroxyl groups in the brucite-like layers. The weak peak at 1635 cm−1 is assigned to the vibrational absorption from the interlayer water. The strong peak at 1367 cm−1 is assigned to the asymmetric stretching of the carbonate. The bands in the range of 700–500 cm−1 are attributed to oxygen–metal–oxygen stretching. After calcination, the FTIR spectra are markedly different from the previous one. As shown in Fig. 1(b), peaks at 3492 cm−1 and 1635 cm−1 almost disappear, which indicated that the interlayer water is lost. The peak at 1367 cm−1 underwent a blue shift to higher frequency of 1398 cm−1. This indicates surface adsorption of carbonate anions, which is a property of calcined layered double hydroxide including HT.36 Fig. 1(c) is the spectrum of reconstructed HT. The characteristic absorption peaks of HT reappeared, which indicates that the HT was reconstructed when the LDO was dispersed in aqueous solution.30XRD was used to observe the crystal structure of the nanoparticles. The XRD patterns of original HT, LDO and reconstructed HT are shown in Fig. 2. The characteristic peaks of HT at 11.4°, 22.9°, 34.7°, 38.6°, 45.9°, 60.5° and 61.8° corresponding to Miller indices (003), (006), (009), (015), (018), (110) and (113) can be observed, which demonstrates that the well crystallized HT has been synthesized in this work.30 After calcination, the characteristic peaks of HT disappeared and peaks at 43.1° and 62.6° can be observed, which indicated that LDO was obtained.30 When dispersing LDO in aqueous solution, HT was reconstructed as the characteristic peaks of HT reappeared (consistent with the results of FTIR). X-ray pattern (003) indicated the basal spacing of HT to be 0.775 nm according to Bragg's law. If the thickness of the brucite layer (0.477 nm) is subtracted from the basal spacing, channel size can be estimated the to be 0.298 nm.38 The diameters of Na+ and Cl− are 0.202 nm and 0.344 nm respectively.39 Hence, only water can pass through the channels, because the diameter of Cl− is larger than the size of channels in HT. As the (003) peak of reconstructed HT was the same as original HT, the channel size did not changed after calcination and reconstruction.
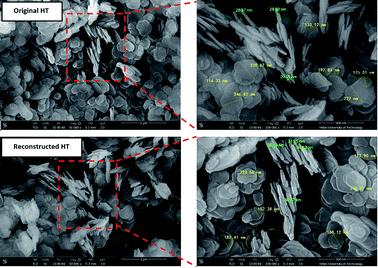
The SEM images in Fig. 3 show the morphology of original HT and reconstructed HT. The nanoparticles exhibit thin nanosheet morphology, which is a typical feature of HT. The morphology of reconstructed HT is identical to that of the original HT, which indicated that HT was generated when LDO was dispersed in aqueous solution (consistent with the results of FTIR and XRD analysis). The thickness of the original HT without treatment ranged from 30 to 50 nm, while the HT after calcination and reconstitution showed the thickness less than 30 nm. The thickness of HT reduced after calcination and reconstitution because the layers of LDO without electrostatic attraction were easy to slide and exfoliate compared to HT. This will be conducive to the dispersion of the nanoparticles in aqueous solution and reduce the superposition of layers of the HT in TFN RO membranes.29 The completely-exposed nanosheets were used to measure the length HT and the result was shown in Fig. 3. It can be observed that the length of both original and reconstructed HT nanosheets was ranged from 110 to 250 nm. As can be seen in Fig. 3, the original and reconstructed HT nanosheets show similar lateral size, which could be due to the memory effect of HT.30
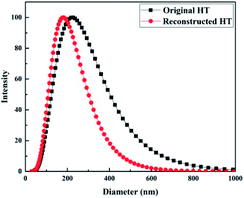
DLS analysis was used to characterize the diameter of original and reconstructed HT in aqueous solution. As demonstrated in Fig. 4, the reconstructed HT is smaller than the original HT. That means the process of calcination and reconstruction will induce the uniform distribution of nanoparticles in RO membranes. The size change could be ascribed to static electricity free layered structure of LDO which is easy to slide and exfoliate.
3.2. Characteristics of the RO membranes
![[double bond, length as m-dash]](https://www.rsc.org/images/entities/char_e001.gif) O stretch of a secondary amide group, indicating that the PA layer was successfully formed on the top surface of the substrates.40 The peak at 1411 cm−1 is assigned to the O–H deformation of carboxylic acid group.41
O stretch of a secondary amide group, indicating that the PA layer was successfully formed on the top surface of the substrates.40 The peak at 1411 cm−1 is assigned to the O–H deformation of carboxylic acid group.41
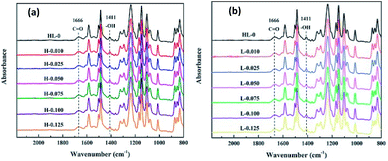 | ||
| Fig. 5 ATR-FTIR spectra of the RO membranes prepared with different contents of (a) HT and (b) LDO in aqueous solutions. | ||
Since the RO membranes were prepared by the interfacial polymerization between MPD and TMC, the chemical structure of the PA layers consists of the cross-linked portion and the linear portion containing carboxylic acid. The presence of carboxylic acid functional groups results from the hydrolysis of the unreacted acyl chloride unit of TMC. According to the reported literatures, cross-linking degree of the PA layers can be investigated using the ratio of the amide group and carboxylic acid group.41,42 The ratio of the peak at 1411 cm−1 corresponding to carboxylic acid and the peak at 1666 cm−1 corresponding to amide as a function of the nanoparticle content in aqueous solution was calculated and the results are shown in Fig. 6. The ratio of peak intensities, i.e., I1411(–COOH)/I1620(–CONH), almost unchanged, indicating the cross-linking degree of the RO membranes was not influenced by the HT or LDO content in the aqueous solution. Generally, the cross-linking degree of PA layer is determined by the concentration ratio of diamines and trimesoyl chloride.41 In this work, there was no difference in the concentrations of diamines and trimesoyl chloride when the RO membranes were prepared, hence the cross-linking degree of the membranes were almost the same.
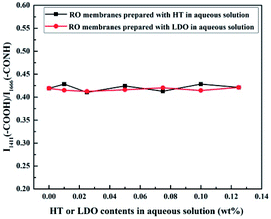 | ||
| Fig. 6 Peak ratio of –COOH group and –CONH group in ATR-FTIR spectra of the RO membrane prepared with different contents of HT or LDO in aqueous solution. | ||
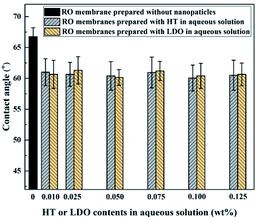
The water contact angle values of TFC membrane and TFN RO membranes prepared with HT or LDO in aqueous solution are presented in Fig. 7. Ten positions of each sample were random selected and all error bars representing the standard errors are also shown in Fig. 7. The pristine TFC RO membrane exhibited a relatively high contact angle of about 67°. By incorporation of nanoparticles in PA layers, contact angle of the TFN RO membranes ranged from 60.1° to 61.3°, indicating the improvement of surface hydrophilicity. The contact angle of membranes is determined by both the chemical structure and roughness of membrane surface. As HT is hydrophilic, the corporation of HT in membranes tend to decrease contact angle of membranes. The adding of HT may alter the IP reaction and thus membrane surface composition. Hence, the influence of original HT or reconstructed HT in the aqueous solution on the diffusion kinetics of MPD has been investigated.38 The results are shown in Fig. S1†. The diffusion rate of MPD decreased with the addition of original or reconstructed HT, which is probably because of the interaction between MPD and HT nanoparticles.38 The decrease of MPD diffusion rate would affect membrane surface composition and then the contact angle due to hydrogen bonding reduction.43 According to the roughness results (shown in Tables 2 and 3) and Wenzel equation,44 roughness affected the contact angle of RO membranes in a non-monotonic way. The contact angle of membranes varied as Fig. 7 due to the combined effects of chemical structure and roughness. The hydrophilic surface will be beneficial to water permeability of the membranes due to high affinity between water and membrane surface.35 RO membranes prepared with HT or LDO in aqueous solution showed the almost same contact angles, because HT reconstructed when LDO was dispersed in aqueous solution and the chemical composition of the membranes was the same.
Zeta potential of the prepared RO membranes was measured to investigate the effect of introducing HT on the surface charge of membranes, as listed in Table 1. The RO membrane prepared without nanoparticles has negative charge with a zeta potential of −42.1 mV, which is due to the presence of carboxyl groups originating from partial hydrolysis of the acyl chloride unit of TMC. After incorporating HT, the nanocomposite membranes exhibit decreased negative charge density. The reason may be attributed to the positively charged property of HT.6
| Membrane | Zeta potential (mV) |
|---|---|
| HL-0 | −42.1 |
| H-0.010 | −40.3 |
| H-0.025 | −38.4 |
| H-0.050 | −36.5 |
| H-0.075 | −34.1 |
| H-0.100 | −32.0 |
| H-0.125 | −31.3 |
| L-0.010 | −40.0 |
| L-0.025 | −37.9 |
| L-0.050 | −36.0 |
| L-0.075 | −33.5 |
| L-0.100 | −32.5 |
| L-0.125 | −30.8 |
SEM analysis was carried out to investigate the surface and cross-sectional morphology of the RO membranes. Top surface SEM images of the RO membranes prepared with HT or LDO in aqueous solution are shown in Fig. 8 and Fig. 9 respectively. As can be seen, the surface of the RO membranes exhibits characteristic ridge-and-valley structure with leaf-like and nodular folds, which is typical for the TFC RO membranes prepared using hexane as organic solvent and TEA–CSA as additive in aqueous solution.45 When the content of HT or LDO was 0.010 wt%, small nodules appeared on the leaf-like folds, forming hierarchical structure, as indicated by the red cycles. Increasing HT or LDO content from 0.010 to 0.025 wt% in the aqueous solution caused an increase of the small nodules on the leaf-like folds. When the content of HT or LDO was above 0.025 wt%, there were no small nodules on the leaf-like folds. The surface morphology variation resulted from the interaction of nanoparticles with monomers or PA matrix. On one hand, nanoparticles alter the steric conformations of PA, which will result in nodule-like features on TFN RO membrane surface.15 On the other hand, nanoparticles in aqueous solution decreased diffusion rate of MPD,16 which hindered the formation of globular structure.17 The surface morphology varied due to the combined effect of factors above. It is speculated that when the HT or LDO addition content increased from 0 to 0.025 wt%, the alteration of PA steric conformation dominated. While when the content continued to increase, the decrease of MPD diffusion rate dominated.
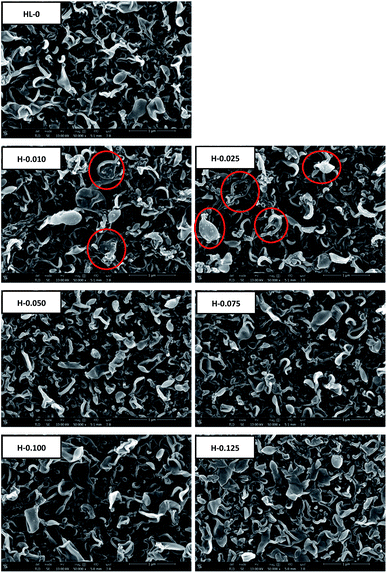 | ||
| Fig. 8 The top surface SEM images of the RO membranes prepared with different contents of HT in aqueous solution. | ||
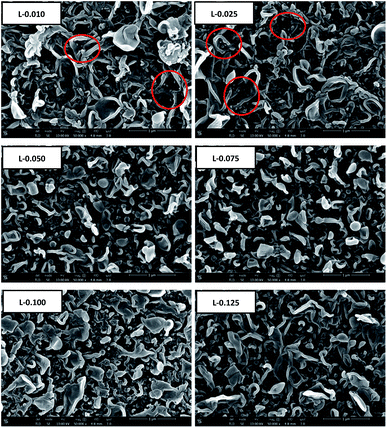 | ||
| Fig. 9 The top surface SEM images of the RO membranes prepared with different contents of LDO in aqueous solution. | ||
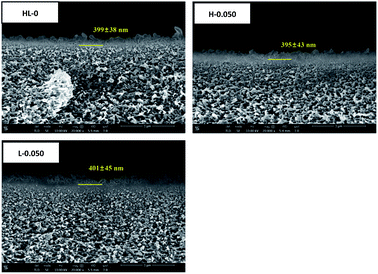
The cross-sectional SEM measurement was used to investigate the thickness of polyamide layers and images of HL-0, H-0.050 and L-0.050 are presented in Fig. 10. As the RO membranes have the similar cross-sectional structure and almost the same polyamide layer thickness, only representative membranes are shown. In the cross-sectional images, a boundary line between polyamide layer and substrate could be seen (marked by a yellow bar). The thickness of the skin layers was measured from the images using ImageJ software. Ten positions of each sample were measured and average thickness was calculated. It can be seen that the polyamide layer formed over the substrates displayed the thickness around 400 nm. The HT nanoparticles could be upright in skin layers of RO membranes as the thickness of skin layer is larger than the length of original of reconstructed HT.
As the inorganic nanoparticles exhibit a discerned dark and opaque appearance under the electron beam which is easily discerned, TEM could be used to provide convincible morphology information of TFN RO membranes.35 Fig. 11 shows the TEM surface image of the pristine RO membrane HL-0 together with TFN RO membranes H-0.050 and L-0.050. Since the nanoparticles were added into aqueous solution, electron beam was focused on the side which was connected with the surface of the polysulfone substrate. Hence, the ridge-and-valley structure of the RO membrane was blurry. It can be seen in the yellow box in Fig. 11 that HT appeared considerably darker than the polymer and were clearly located in the PA layer. This characterization by TEM confirmed the successful fabrication of TFN RO membranes.
The AFM method was used to characterize the roughness of the membrane surface and images of HL-0, H-0.050 and L-0.050 are presented in Fig. 12. As the RO membranes have the similar AFM topographic images, only representative membranes are displayed. As shown in Fig. 12, the AFM images of the PA layer exhibited similar morphology of characteristic ridge-and-valley structure, which is consistent with the SEM images. The surface roughness parameters were analyzed and listed in Tables 2 and 3. Compared with the pristine RO membrane, membranes prepared with HT or LDO in aqueous solution exhibited larger relative surface area (Δ), which may be conducive to the enhancement of flux.46 With increasing the content of HT or LDO in aqueous solution, the surface roughness of formed PA layer increased firstly and then decreased, which may be attributed to the small nodules on the leaf-like folds. In addition, at the same nanoparticle content in aqueous solution, membranes prepared with LDO displayed higher roughness than those prepared with HT except when the content was 0.010 wt%.
| RO membrane | Ra (nm) | Rm (nm) | Δ |
|---|---|---|---|
| HL-0 | 56.7 | 71.5 | 1.27 |
| H-0.010 | 69.9 | 86.9 | 1.29 |
| H-0.025 | 72.9 | 91.0 | 1.33 |
| H-0.050 | 70.5 | 88.1 | 1.31 |
| H-0.075 | 67.5 | 85.7 | 1.31 |
| H-0.100 | 65.0 | 81.4 | 1.31 |
| H-0.125 | 62.4 | 79.3 | 1.28 |
| RO membrane | Ra (nm) | Rm (nm) | Δ |
|---|---|---|---|
| HL-0 | 56.7 | 71.5 | 1.27 |
| L-0.010 | 64.8 | 81.2 | 1.28 |
| L-0.025 | 76.3 | 96.0 | 1.33 |
| L-0.050 | 70.8 | 89.0 | 1.31 |
| L-0.075 | 70.8 | 89.0 | 1.31 |
| L-0.100 | 69.0 | 87.6 | 1.31 |
| L-0.125 | 68.8 | 86.2 | 1.29 |
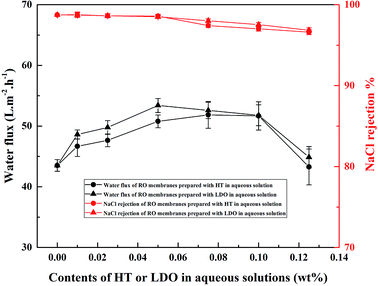
The separation performance of the RO membranes is shown in Fig. 13. All error bars represent the standard errors of the performances of at least three membrane samples prepared and tested under the same conditions. With increasing HT or LDO content in aqueous solution, the flux of RO membranes increased firstly and then decreased. When HT was dispersed in aqueous solution, H-0.075 exhibited the highest water flux, and when LDO was dispersed in aqueous solution, L-0.050 exhibited the highest water flux. Compared to the pristine membrane, the water flux of the TFN RO membranes H-0.075 and L-0.050 was increased by 19.1% and 22.8%, respectively. In addition, with the same content of nanoparticle in aqueous solution, TFN RO membranes prepared using LDO exhibited higher water flux compared with those prepared using HT.
As mentioned above, increasing in hydrophilicity and relative surface area will be conducive to the enhancement of water flux. However, when the HT or LDO content increased from 0.025 wt% to 0.050 wt%, the hydrophilicity remained almost unchanged and the relative surface area decreased, but the water flux of the TFN RO membranes increased. As consequently, water channels provided by the HT embed in the PA matrix rather than hydrophilicity and relative surface area played the dominant role in water flux increase of the TFN RO membranes. According to the references, water could transport through the inter-connective pores of porous nanoparticles, and hence increase the water flux of nanocomposite membranes.47 The possible transport mechanism in the TFN RO membranes was proposed and the transportation model is depicted in Scheme 1. HT consists of positively charged brucite-like host layers and hydrated carbonate anions moving through the unobstructed interlayer gallery. As shown in Scheme 1, ions could act as H2O carriers due to hydration of ions and separation of H2O molecules from the hydrated ions.27 Consequently, water channels for facilitating the transport of water were constructed in PA layer, which brought about high flux of the TFN RO membranes. However, when the content of HT or LDO in aqueous solution exceeded a certain amount, agglomeration of the nanoparticles would occur to form stacked clay nanosheets, which would block the transport of water and result in a more tortuous pathway.35 Consequently, water flux increased firstly and then decreased with the increase of HT or LDO content in aqueous solution.
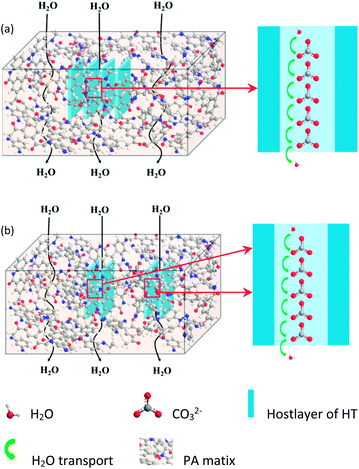 | ||
| Scheme 1 Schematic representation of the mechanism for water transported through TFN RO membranes prepared with (a) HT and (b) LDO. | ||
As the host layer and the interlayer containing carbonate anions are arranged alternately, water channels will exist in a parallel manner, which lead to the concentrated distribution of the water channels and the decrease of efficiency (see Scheme 1(a)). As the thickness of the HT nanosheets was reduced through the method of calcination and reconstitution (see the SEM images of the nanosheets), the number of water channels in parallel was decreased. Hence, compared to adding HT directly, adding LDO to reconstruct into HT in aqueous solution facilitated the uniform distribution of the water channels in PA layer (see Scheme 1(b)). As a result, TFN RO membranes prepared with LDO in aqueous solution exhibited higher water flux than those prepares with HT in aqueous solution.
When the nanoparticle content was not more than 0.050 wt% in aqueous solution, the NaCl rejection slightly reduced with the addition of HT or LDO, while when the nanoparticle content was more than 0.050 wt%, the NaCl rejection obviously decreased. In general, when the PA layer is integrated, the salt rejection of RO membranes is mainly determined by cross-linking degree and surface charge of the PA layer.48,49 The cross-linking degree denoted by I1411(–COOH)/I1620(–CONH) was almost unchanged with the increase of HT or LDO content (see Fig. 6). For the negatively charged RO membranes, the trans-membrane process of Na+ is facilitated, while the trans-membrane process of Cl− is hindered by the negative charge on the membrane surface. The transmembrane resistance of salt is reduced because of the solute electroneutrality effects.50 Due to the combined effects of cross-linking and surface charge, NaCl rejection slightly reduced when the HT or LDO content was not more than 0.050 wt%. Including adding content of nanoparticles would result in aggregation (see Fig. S2†). When the addition content was more than 0.050 wt%, the aggregation of the nanoparticle would result in the formation of voids without separation property between nanoparticles and the matrix. Hence, NaCl rejection was markedly decreased.
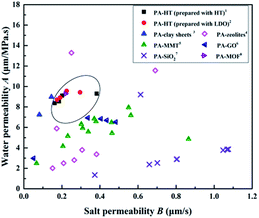
Most of typical TFN RO membranes have been summarized in Fig. 14 in terms of their performances in order to evaluate the effectiveness of incorporating HT in PA layer. It is observed that the TFN RO membranes in this work exhibit higher water permeability than most of the reported TFN RO membranes, which could be ascribed to the high-speed water channels provided by HT nanoparticles embed in the PA layers. Meanwhile, the salt permeability of the TFN RO membranes in this work is relatively lower, indicating that the membranes have higher capacity to prevent the transport of salt. Fig. 14 suggests that incorporating HT in PA layer is an effective method to improve the performance of TFC RO membranes.
4. Conclusions
In this work, TFN RO membranes were prepared through the method of interfacial polymerization by dispersing HT directly in aqueous solution or dispersing LDO in aqueous solution to reconstruct HT. The layers of LDO were easy to slide and exfoliate compared to HT, which will be conducive to reduce the thickness of the HT and then facilitate the uniform distribution of water channels. It was found that with increasing the content of HT or LDO in the aqueous solution, the cross-linking degree of PA layer almost unchanged due to the intrinsic characteristic of the interfacial polymerization between MPD and TMC. The contact angles of TFN RO membranes were lower than that of the pristine membrane and the surface roughness increased firstly and then decreased with the increasing of HT or LDO in aqueous solution. The results of separation experiment revealed that with increasing HT or LDO content in aqueous solution, the water flux of RO membranes increased firstly and then decreased, meanwhile, the NaCl rejection decreased slightly firstly and then decreased obviously. The water flux of TFN RO membranes prepared with LDO in aqueous solution was superior to those prepared with HT in aqueous solution when the addition content was the same, which was attributed to the uniform distribution of water channels provided by the HT reconstructed from LDO. Taking into account both the water flux and salt rejection, the TFN RO membrane prepared with 0.050 wt% LDO in aqueous solution had the optimal separation performance.Conflicts of interest
There are no conflicts to declare.Acknowledgements
This research was supported by the National Key Research and Development Program of China (grant number 2017YFC0403901), the Basic Scientific Research Funds for the State-Level Scientific Research Institute (grant numbers K-JBYWF-2016-T12, K-JBYWF-2017-T12, K-JBYWF-2015-T12), the National Natural Science Foundation of China (grant number 21606059), the National Programme on Global Change and Air-Sea Interaction (grant number GASI-03-02-02-05), the Regional Demonstration Project of Marine Economic Innovation and Development (grant number BHSF2017-12) and the National Key Research and Development Program of China (2016YFE0102400).References
- M. Elimelech and W. A. Phillip, Science, 2011, 333, 712–717 CrossRef CAS PubMed.
- A. G. Fane, R. Wang and M. X. Hu, Angew. Chem., Int. Ed., 2015, 54, 2–21 CrossRef PubMed.
- J. R. Werber, C. O. Osuji and M. Elimelech, Nat. Rev. Mater., 2016, 1, 16018 CrossRef CAS.
- B.-H. Jeong, E. M. V. Hoek, Y. Yan, A. Subramani, X. Huang, G. Hurwitz, A. K. Ghosh and A. Jawor, J. Membr. Sci., 2007, 294, 1–7 CrossRef CAS.
- M. Fathizadeh, A. Aroujalian and A. Raisi, J. Membr. Sci., 2011, 375, 88–95 CrossRef CAS.
- H. Dong, L. Zhao, L. Zhang, H. Chen, C. Gao and W. S. W. Ho, J. Membr. Sci., 2015, 476, 373–383 CrossRef CAS.
- H. Huang, X. Qu, X. Ji, X. Gao, L. Zhang, H. Chen and L. Hou, J. Mater. Chem. A, 2013, 1, 11343–11349 CAS.
- H. Zhao, S. Qiu, L. Wu, L. Zhang, H. Chen and C. Gao, J. Membr. Sci., 2014, 450, 249–256 CrossRef CAS.
- W.-F. Chan, E. Marand and S. M. Martin, J. Membr. Sci., 2016, 509, 125–137 CrossRef CAS.
- H. J. Kim, K. Choi, Y. Baek, D.-G. Kim, J. Shim, J. Yoon and J.-C. Lee, ACS Appl. Mater. Interfaces, 2014, 6, 2819–2829 CAS.
- A. Tiraferri, C. D. Vecitis and M. Elimelech, ACS Appl. Mater. Interfaces, 2011, 3, 2869–2877 CAS.
- H. J. Kim, Y.-S. Choi, M.-Y. Lim, K. H. Jung, D.-G. Kim, J.-J. Kim, H. Kang and J.-C. Lee, J. Membr. Sci., 2016, 514, 25–34 CrossRef CAS.
- M. Safarpour, A. Khataee and V. Vatanpour, J. Membr. Sci., 2015, 489, 43–54 CrossRef CAS.
- H. R. Chae, J. Lee, C. H. Lee, I. C. Kim and P. K. Park, J. Membr. Sci., 2015, 483, 128–135 CrossRef CAS.
- M. Zargar, Y. Hartanto, B. Jin and S. Dai, J. Membr. Sci., 2017, 514, 19–28 CrossRef.
- M. Zargar, Y. Hartanto, B. Jin and S. Dai, J. Membr. Sci., 2016, 519, 1–10 CrossRef CAS.
- M. Bao, G. Zhu, L. Wang, M. Wang and C. Gao, Desalination, 2013, 309, 261–266 CrossRef CAS.
- E.-S. Kim, G. Hwang, M. G. El-Din and Y. Liu, J. Membr. Sci., 2012, 394, 37–48 CrossRef.
- J. Duan, Y. Pan, F. Pacheco, E. Litwiller, Z. Lai and I. Pinnau, J. Membr. Sci., 2015, 476, 303–310 CrossRef CAS.
- J. Yin, G. Zhu and B. Deng, Desalination, 2016, 379, 93–101 CrossRef CAS.
- Y. Zhu, M. Wei, Q. Shao, L. Lu, X. Lu and W. Shen, J. Phys. Chem. C, 2009, 113, 882–889 CAS.
- D. Cohen-Tanugi and J. C. Grossman, Nano Lett., 2012, 12, 3602–3608 CrossRef CAS PubMed.
- M. Chen, W. Shen, X. Lu, R. Zhu, H. He and J. Zhu, J. Phys. Chem. C, 2016, 120, 12924–12931 CAS.
- M. Kumar, M. Grzelakowski, J. Zilles, M. Clark and W. Meier, PNAS, 2007, 104, 20719–20724 CrossRef CAS PubMed.
- Y. Zhao, C. Qiu, X. Li, A. Vararattanavech, W. Shen, J. Torres, C. Helix-Nielsen, R. Wang, X. Hu and A. G. Fane, J. Membr. Sci., 2012, 423, 422–428 CrossRef.
- Y. Li, S. Wang, G. He, H. Wu, F. Pan and Z. Jiang, Chem. Soc. Rev., 2015, 44, 103–118 RSC.
- C. Gao, M. Zhang, Z. Jiang, J. Liao, X. Xie, T. Huang, J. Zhao, J. Bai and F. Pan, Chem. Eng. Sci., 2014, 135, 461–471 CrossRef.
- G. Choudalakis and A. D. Gotsis, Eur. Polym. J., 2009, 45, 967–984 CrossRef CAS.
- J. Liao, Z. Wang, C. Gao, S. Li, Z. Qiao, M. Wang, S. Zhao, X. Xie, J. Wang and S. Wang, Chem. Sci., 2014, 5, 2843–2849 RSC.
- J. Liao, Z. Wang, C. Gao, M. Wang, K. Yan, X. Xie, S. Zhao, J. Wang and S. Wang, J. Mater. Chem. A, 2015, 3, 16746–16761 CAS.
- T. W. Kim, M. Sahimi and T. T. Tsotsis, Ind. Eng. Chem. Res., 2009, 48, 9504–9513 CrossRef CAS.
- J. Liu, L. Yu and Y. Zhang, Desalination, 2014, 335, 78–86 CrossRef CAS.
- L. Yu, J. Deng, H. Wang, J.-d. Liu and Y. Zhang, ACS Sustainable Chem. Eng., 2016, 4, 3292–3304 CrossRef CAS.
- J. Wang, Y. Zhang, J. Zhu, J. Hou, J. Liu and B. Van der Bruggen, J. Membr. Sci., 2016, 510, 27–37 CrossRef CAS.
- H. Dong, L. Wu, L. Zhang, H. Chen and C. Gao, J. Membr. Sci., 2015, 494, 92–103 CrossRef CAS.
- L. Lv, J. He, M. Wei, D. G. Evans and X. Duan, J. Hazard. Mater., 2006, 133, 119–128 CrossRef CAS PubMed.
- F. Millange, R. I. Walton and D. O'Hare, J. Mater. Chem., 2000, 10, 1713–1720 RSC.
- V. R. L. Constantino' and T. J. Hnnavaia, Inorg. Chem., 1995, 34, 883–892 CrossRef.
- L. Pauli, J. Am. Chem. Soc., 1927, 49, 765–790 CrossRef.
- M. Duan, Z. Wang, J. Xu, J. Wang and S. Wang, Sep. Purif. Technol., 2010, 75, 145–155 CrossRef CAS.
- S. Zhu, S. Zhao, Z. Wang, X. Tian, M. Shi, J. Wang and S. Wang, J. Membr. Sci., 2015, 493, 263–274 CrossRef CAS.
- M. Fathizadeh, A. Aroujalian and A. Raisi, Desalination, 2012, 284, 32 CrossRef CAS.
- S. Scheiner, Hydrogen bonding: a theoretical perspective, Oxford University Press, New York, 1997 Search PubMed.
- R. N. Wenzel, Ind. Eng. Chem., 1936, 28, 988–994 CrossRef CAS.
- A. K. Ghosh, B.-H. Jeong, X. Huang and E. M. V. Hoek, J. Membr. Sci., 2008, 311, 34–45 CrossRef CAS.
- M. Hirose, H. Ito and Y. Kamiyama, J. Membr. Sci., 1996, 121, 209–215 CrossRef CAS.
- W. J. Lau, S. Gray, T. Matsuura, D. Emadzadeh, J. P. Chen and A. F. Ismail, Water Res., 2015, 80, 306–324 CrossRef CAS PubMed.
- Y. Liu, B. He, J. Li, R. D. Sanderson, L. Li and S. Zhang, J. Membr. Sci., 2011, 373, 98–106 CrossRef CAS.
- J. Xu, Z. Wang, J. Wang and S. Wang, Desalination, 2015, 365, 398–406 CrossRef CAS.
- S. P. Sun, T. A. Hatton, S. Y. Chan and T. S. Chung, J. Membr. Sci., 2012, 401–402, 152–162 CrossRef CAS.
Footnote |
| † Electronic supplementary information (ESI) available: Effect of nanoparticles concentration on the diffusion of MPD to hexane (Fig. S1), EDS mapping images depict the distribution of Al element in the RO membranes (Fig. S2). See DOI: 10.1039/c7ra13562a |
| This journal is © The Royal Society of Chemistry 2018 |


