 Open Access Article
Economical synthesis of composites of FeNi alloy nanoparticles evenly dispersed in two-dimensional reduced graphene oxide as thin and effective electromagnetic wave absorbers†
Juan Lia,
Dong Zhangb,
Hui Qic,
Guangming Wanga,
Jimin Tanga,
Ge Tiana,
Anhua Liu ad,
Huijuan Yue
 *ad,
Yang Yue and
Shouhua Feng
 a
a
aState Key Laboratory of Inorganic Synthesis and Preparative Chemistry, College of Chemistry, Jilin University, Changchun 130012, China. E-mail: huijuan@jlu.edu.cn
bKey Laboratory of Physics and Technology for Advanced Batteries (Ministry of Education), College of Physics, Jilin University, Changchun 130012, China
cThe Second Hospital of Jilin University, Changchun 130041, PR China
dKey Laboratory of High Performance Ceramic Fibers of Ministry of Education, College of Materials, Xiamen University, Xiamen 361005, China
eState Key Laboratory of Rare Earth Resource Utilization, Changchun Institute of Applied Chemistry, Chinese Academy of Science, Changchun, China
First published on 23rd February 2018
Abstract
Developing electromagnetic wave absorbing materials prepared by a facile and economical way is a great challenge. Herein, we report a feasible route to synthesize a series of two-dimensional FeNi/rGO composites by a hydrothermal method followed by a carbonization process. The characterization confirms that nano-sized FeNi alloy nanoparticles are evenly supported onto graphene sheets without aggregation. The homogeneous dispersion of the nanoparticles may result from the introduction of glucose and the oxygen-containing groups on the surface of the graphene oxide. Measurements show that the microwave attenuation capability of the composites can be improved dramatically by adjusting the proportion of dielectric and magnetic components. Consequently, the two-dimensional magnetic material (FeNi/rGO-100) exhibits an excellent microwave absorption performance. In detail, the minimum reflection loss of −42.6 dB and effective bandwidth of 4.0 GHz can be reached with a thinner thickness of 1.5 mm. This study demonstrates that synergistic effects among the magnetic particles, reduced graphene oxide and amorphous carbon layers give rise to the highlighted microwave attenuation ability. Overall, the FeNi/rGO composite is a promising candidate to be used as a microwave absorber, and the feasible and economical method has shown potential application to construct multitudinous two-dimensional materials.
1. Introduction
With the extensive use of electronic products these days, problems associated with radiation have been highlighted as needing to be resolved.1–4 The various kinds of absorbers are normally classified into two categories: dielectric materials and magnetic materials, which have been successfully synthesized to ease electromagnetic (EM) wave pollution by means of absorbing unwanted electromagnetic signals.2,5–7 An ideal EM wave absorption material is generally required to possess these features: strong absorption, wide absorption band, low thickness, lightweight, good thermal stability, and antioxidant properties.8–11Carbon-based materials are potential candidates for EM absorbers, owing to their satisfactory characteristics of high dielectric loss, chemical resistance and light weight.12–15 As is well known, the EM wave absorption performance of a material is determined by complex permittivity, complex permeability and impedance matching, which are affected by its components, microstructure, size and so on.16,17 Hence, by rational cooperation of the magnetic components (Fe3O4,18,19 Fe,20,21 Co,22 Ni,23 NiCo2,24 NiFe2O4![[thin space (1/6-em)]](https://www.rsc.org/images/entities/char_2009.gif) 25) and carbon-based materials (carbon nanotubes,26 carbon fiber,27 graphene,28 porous carbon materials29) within the magnetic/carbon-based hybrids, competent EM wave absorbers can be achieved.
25) and carbon-based materials (carbon nanotubes,26 carbon fiber,27 graphene,28 porous carbon materials29) within the magnetic/carbon-based hybrids, competent EM wave absorbers can be achieved.
Reduced graphene oxide (rGO), as an important derivative of graphene, is one of the most intensively researched materials in virtue of its intrinsic features of two-dimensional structure, large surface area, high aspect ratio and low density.1,9,30 Meanwhile, the abundant functional groups and defects residing on the sheets of rGO render to this material modest electric conductivity and optimistic polarization as a potential EM wave absorber.31 To satisfy the impedance matching conditions, magnetic/rGO-based composites have been investigated to pursue an improved microwave absorption capability. For example, Zeng et al. synthesized the hollow reduced graphene oxide microspheres embedded with Co nanoparticles by a simple and efficient two-step method. The minimum reflection loss value reached −68.1 dB at 13.8 GHz with a thickness of 2.2 mm.2 Moitra et al. prepared BiFeO3-rGO nanocomposites and exhibited minimum reflection loss value of 28.68 dB at 10.68 GHz.5
Compared with ferrite and monometallic materials, metal alloy materials come into sight as widely used microwave absorbers due to their high curie temperature, high permeability and high saturation magnetization.32–34 These features are beneficial to impedance matching behaviour and permeability values including the real part (μ′) and the imaginary part (μ′′). For example, Yang et al. prepared NiCo2/GNS nanohybrids and an optimal RL of −30 dB was achieved at 11.7 GHz for a thickness of 1.6 mm.24 Cheng et al. synthesized FeCo alloys with various morphologies and optimal reflection loss of −53.6 dB was achieved at 14.3 GHz with a thickness of 1.55 mm.33 Chen et al. synthesized Co7Fe3@SiO2 core–shell nanoparticles and RLmax was up to 68.5 dB with a thickness of 1.8 mm.35 The incorporation of alloy into graphene materials is an effective approach to enhance microwave absorption performance of reduced graphene oxide. However, the preparation methods mentioned above involve inefficient multiple steps and violate the requirements of low cost and simple operation for future practical applications. Therefore, a facile and economical strategy that can develop metal alloyed rGO-based 2D materials is highly demanded.
Here, we report a feasible and direct preparation strategy to synthesize a series of two-dimensional FeNi/rGO composites. The facile approach involves introducing glucose to serve as both a reductant to convert metallic oxide into alloy and a stabilizer which can retain graphene's two-dimensional structure. In addition, the remnant glucose is carbonized and deposited on the surface of graphene, which acts as an extra dielectric material to regulate absorption property. By controlling the proportion of raw materials, we prove that the existence of each component plays a specific role in directing two-dimensional structure and improving absorption capability. Among all, FeNi/rGO-100 composite exhibits the most desirable microwave absorption performance. The microwave absorption mechanism of FeNi/rGO composites is discussed in detail.
2. Experimental section
2.1 Materials
The graphite was obtained from Sigma-Aldrich (282863). Iron(III) nitrate nonahydrate, nickel(II) nitrate hexahydrate, and D-glucose were ordered from Sinopharm Chemical Reagent Co. Ltd, China. Alcohol was purchased from Tianjin Tiantai Fine Chemical Reagent Co. Ltd, China. All chemicals were analytical grade and used directly without further purifying treatments. Deionized water was employed to prepare the solutions throughout.2.2 Preparation of graphene oxide (GO)
Graphene oxide (GO) was prepared from purchased natural graphite by a modified Hummer's method. The detailed description was shown in a previous report.362.3 Preparation of FeNi alloy/reduced graphene oxide (FeNi/rGO)
The two-dimensional FeNi alloy/reduced graphene oxide samples were synthesized via a hydrothermal method and carbonization process. Briefly, 20 mg of GO was added into 10 mL of deionized water and sonicated for 30 min. Afterwards, 0.36 mmol of ion(III) nitrate nonahydrate, 2.5 mmol of nickel(II) nitrate hexahydrate and 7.6 mmol of D-glucose were introduced into the above solution under stirring. After being stirred for another 4 h, the mixture was transferred into a 30 mL Teflon-lined stainless-steel autoclave and heated at 180 °C for 22 h in an electric oven. The black precursors were collected by suction filtration, washed several times with water and ethanol, and dried at 80 °C in the oven overnight. Finally, the sample was carbonized at 700 °C for 2 h under the protection of inert gas in a tube furnace. It was denoted as FeNi/rGO-20. For comparison, some composites were prepared using similar steps by adjusting the content of GO, which were 60 mg and 100 mg, and the corresponding samples were denoted as FeNi/rGO-60 and FeNi/rGO-100, respectively. In addition, while the content of GO was kept at 20 mg, different dosages of glucose (0 and 2.8 mmol) were introduced into the reaction system under identical experimental procedures, which were designated as FeNi/rGO-0glu and FeNi/rGO-2.8glu, respectively.2.4 Characterization
The phase composition of samples was examined by power X-ray diffraction (XRD, Rigaku D/MAX 2550) in the angular range of 2θ = 5–80° with Cu Kα radiation. The operating voltage and current were kept at 50 kV and 200 mA in an ambient environment. The morphology and size were characterized by scanning electron microscopy (SEM, JSM-6700F) and transmission electron microscopy (TEM, Tecnai G2 S-Twin F20). Thermogravimetric analysis (TGA) was carried out on a Netzsch STA 449C TGA Q500 analyzer with a temperature ramp of 10 °C min−1. The magnetic property was assessed using a magnetic property measurement system (SQUID-VSM) with an applied force of −10![[thin space (1/6-em)]](https://www.rsc.org/images/entities/char_2009.gif) 000 to 10
000 to 10![[thin space (1/6-em)]](https://www.rsc.org/images/entities/char_2009.gif) 000 Oe at room temperature. The elemental chemical state was characterized by an ESCALAB250 photoelectron spectrometer equipped with a charge neutralizer and an Mg Kα X-ray source. The Raman spectrum was obtained on a Micro-Raman system (Renishaw, model INVIA), equipped with an Ar laser (514.5 nm).
000 Oe at room temperature. The elemental chemical state was characterized by an ESCALAB250 photoelectron spectrometer equipped with a charge neutralizer and an Mg Kα X-ray source. The Raman spectrum was obtained on a Micro-Raman system (Renishaw, model INVIA), equipped with an Ar laser (514.5 nm).
2.5 Measurement of EM properties
The complex permeability (μr = μ′ − jμ′′) and permittivity (εr = ε′ − jε′′) were measured on a vector network analyzer (Agilent, N5222A) in the frequency range of 2–18 GHz for the calculation of reflection loss. The tested samples were prepared by uniformly mixing as-prepared composites and paraffin wax (mass ratio = 1![[thin space (1/6-em)]](https://www.rsc.org/images/entities/char_2009.gif) :
:![[thin space (1/6-em)]](https://www.rsc.org/images/entities/char_2009.gif) 2) and then sample-to-paraffin mixtures were pressed into toroidal-shaped samples with an outer diameter of 7.0 mm and an inner diameter of 3.04 mm. Based on the electromagnetic parameters (ε′, ε′′, μ′, μ′′) at the given frequency (f) and different thicknesses (d), the reflection loss (RL) can be calculated using the transmission line theory, which is summarized as the following equations:37,38
2) and then sample-to-paraffin mixtures were pressed into toroidal-shaped samples with an outer diameter of 7.0 mm and an inner diameter of 3.04 mm. Based on the electromagnetic parameters (ε′, ε′′, μ′, μ′′) at the given frequency (f) and different thicknesses (d), the reflection loss (RL) can be calculated using the transmission line theory, which is summarized as the following equations:37,38
 | (1) |
Zin = Z0(μr/εr)1/2tan![[thin space (1/6-em)]](https://www.rsc.org/images/entities/char_2009.gif) h[j(2πfd/c)(μrεr)1/2] h[j(2πfd/c)(μrεr)1/2]
| (2) |
3. Results and discussion
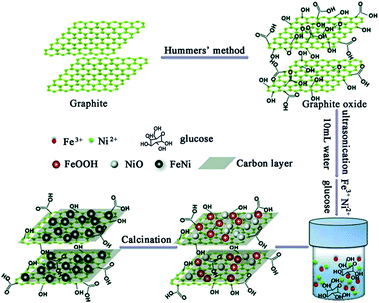
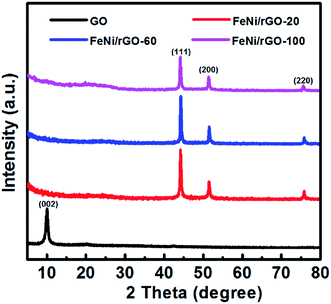
The FeNi/rGO composites were prepared via a facile hydrothermal approach, followed by the carbonization process in the inert atmosphere, as illustrated in Scheme 1. Firstly, graphene oxide was prepared from commercial graphite by using a modified Hummer's method. Secondly, a homogeneous GO solution was mixed with a certain amount of Fe3+ ions, Ni2+ ions and glucose, which was then hydrothermally treated in a stainless-steel autoclave. Due to the oxygenated functional groups of GO, such as –OH, –COOH, –CHO, graphene oxide can easily link together with Fe3+ ions, Ni2+ ions and glucose by covalent bonds and electrostatic force.39 Under hydrothermal treatment, metal oxide in situ nucleated and grew uniformly on the surface of graphene nanosheets. After calcination in inert atmosphere, metal oxide precursor was reduced to form FeNi alloy nuclei. Glucose can serve as both a reductant and a stabilizer which can retain graphene's two-dimensional structure. The essential role of glucose in this reaction will be further disclosed when discussing the morphology of the samples. Meanwhile, residual glucose was carbonized into the amorphous carbon depositing on the surface of graphene. The depositional glucose can be testified by comparing their TG and SEM results of FeNi/rGO-2.8glu and FeNi/rGO-20 composites synthesized via the same experimental procedures except for the different dosages of glucose, as shown in Fig. S1.†The phase compositions of the samples were characterized by X-ray diffraction (Fig. 1). In Fig. 1, it can be observed that the as-obtained GO shows a diffraction peak at about 10.2°, corresponding to the (002) plane of graphite oxide, manifesting an increase of interlayer distance because of the formation of oxygen-containing functional groups such as hydroxyl, carboxyl and epoxy groups between the layers.40 In contrast, all FeNi/rGO samples have no obvious graphene oxide peak (10.2°) in the XRD patterns, which is due to the transformation from graphene oxide to reduced graphene oxide with some defects and residual functional groups.41 The distinct diffraction peaks at 44.12°, 51.40° and 75.65° in the powder patterns of FeNi/rGO match well with (111), (200) and (220) crystal planes of cubic FeNi alloy (JCPDS no. 65-3244, and space group Pm![[3 with combining macron]](https://www.rsc.org/images/entities/char_0033_0304.gif) m).36,42
m).36,42
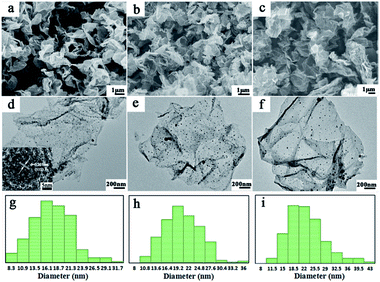
The morphologies of FeNi/rGO samples are shown in Fig. 2a–f. By comparing both the SEM and TEM images of these three samples, FeNi/rGO samples preserve the two-dimensional nanostructure with the formation of FeNi alloy nanoparticles on their sheets. Furthermore, TEM images of FeNi/rGO (Fig. 2d–f) reveal that nano-sized FeNi alloy nanoparticles (dark dots) are evenly supported onto graphene sheets without aggregation. Homogeneous dispersion of the nanoparticles may be resulted from oxygen-containing groups on the surface of graphene oxide, which is consistent with the mechanism of formation. Noticeably, no scattered FeNi nanoparticles are found outside of graphene nanosheets even under vigorous ultrasound, manifesting that magnetic particles are strongly adhesive on the surface of graphene nanosheets.39 The HRTEM image of FeNi/rGO-20 composite is displayed in the bottom left corner of Fig. 2d. The clear lattice fringes with interplanar distance of 0.205 nm are indexed as (111) crystal planes of FeNi alloy, which further verify the phase of those black nanoparticles.36 Besides, with the amount of GO increases (Fig. 2d–f), the loading density of FeNi nanoparticles decreases gradually. The result demonstrates that the mass ratio of (FeNi)/(GO) has an important effect on the loading density of nanoparticles on the graphene nanosheets. This may be due to the reason that the fixed quantity of Fe3+ and Ni2+ ions is dispatched to the increasing number of GO sheets, thus leading to the decrease in the average density of FeNi particles.43 Moreover, the average particle sizes of FeNi alloy (Fig. 2g–i) are 17.23, 18.90 and 21.04 nm, respectively, indicating that the diameters of FeNi nanoparticles increase with the increasing amount of GO. To disclose the effect of glucose, FeNi/rGO-0glu composite was synthesized by the same synthesis method without adding glucose. The phase and morphology of this composite were characterized by XRD, SEM and TEM, as shown in ESI. All the powder diffraction peaks in Fig. S2† can be well assigned to metal oxide phase, demonstrating that there is not enough reductive agent to reduce metal ions during the whole reaction process. Moreover, SEM and TEM images (Fig. S3(a, b)†) reveal that the shape of the obtained nanoparticles is irregular with the average size about 200 to 400 nm. The result suggests that the original two-dimensional flake nanostructure of graphene oxide cannot be kept due to the lack of glucose. Combined with Fig. 2, it illustrates that the existence of glucose can be used as both a reductant and a stabilizer for a desired two-dimensional structure.
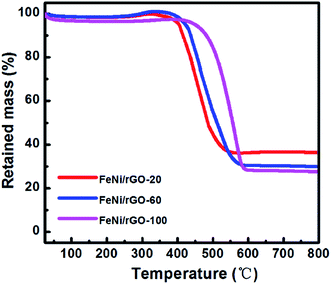
The carbon contents in FeNi/rGO-20, FeNi/rGO-60 and FeNi/rGO-100 composites were investigated by thermogravimetric analysis (TGA) under an air atmosphere at a heating rate of 10 °C min−1. As presented in Fig. 3, we can see that the curves have a slight weight loss below 250 °C, which can be ascribed to the evaporation of H2O or removal of surface functional groups.44 The main weight loss between 250 °C and 600 °C is related to the oxidation of rGO and carbon and the transformation from FeNi alloy to metal oxide. As the rGO and carbon components are completely combusted in air, the residual products are a mixture of Fe2O3 and NiO, so the total content of rGO and carbon can be calculated by
 | (3) |
The magnetic properties of FeNi/rGO-20, FeNi/rGO-60 and FeNi/rGO-100 composites were assessed using a vibrating sample magnetometer (VSM) at 300 K. Fig. 4 shows the magnetic hysteresis loops of as-obtained samples, which indicates ferromagnetic behaviour of all samples.45 The saturation magnetization (Ms), remanent magnetization (Mr) and coercivity (Hc) of three samples are displayed in Table 1. It can be observed that the values of Ms decline with increasing the mass percentage of non-magnetic components. However, the Mr and Hc values increase, which may be due to the different crystal size and loading density of FeNi nanoparticles.35
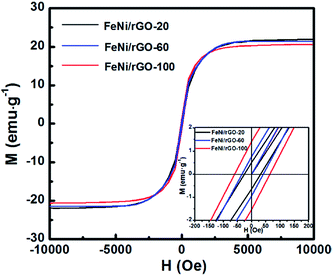 | ||
| Fig. 4 Magnetic hysteresis loops of FeNi/rGO-20, FeNi/rGO-60 and FeNi/rGO-100 composites at 300 K. Inset shows the enlargement of corresponding magnetic hysteresis loops. | ||
| Sample name | Ms (emg g−1) | Mr (emg g−1) | Hc (Oe) |
|---|---|---|---|
| FeNi/rGO-20 | 21.9 | 0.515 | 31.4 |
| FeNi/rGO-60 | 21.4 | 0.770 | 41.3 |
| FeNi/rGO-100 | 20.6 | 1.413 | 64.8 |
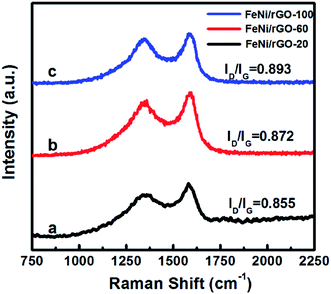
Raman spectra were mainly utilized for analysing the structural distinction of as-obtained samples (Fig. 5). There are two typical peaks, which can be distinctly observed at 1349 cm−1 and 1593 cm−1 assigned to D band and G band, respectively. Based on previous research, the D band is associated with a breathing mode of κ-point photons of A1g symmetry, while G band arises from the first order scattering of the E2g phonon of sp2-banded carbon atoms. The intensity ratio of these two bands (ID/IG) is sensitive to the disorder degree, and its increasing value manifests the formation of defects.22,46 From Fig. 5, ID/IG values of three composites are calculated as 0.855, 0.872 and 0.893, respectively. It indicates that higher degree of defects is introduced into the composites as increasing the contents of GO, which is beneficial to improve the dielectric loss of rGO-based materials.
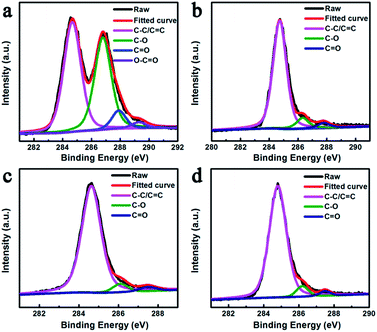
The element states of GO and FeNi/rGO samples were characterized by X-ray photoelectron spectroscopy (XPS), as shown in Fig. 6. The C 1s spectrum of GO can be fitted by four deconvoluted peaks. The peaks centered at 284.6, 286.8, 287.9 and 289.4 eV can be attributed to the aliphatic carbon group (C1 C–C/C![[double bond, length as m-dash]](https://www.rsc.org/images/entities/char_e001.gif) C), epoxy groups or alkoxy (C2 C–O), carbonyl group (C3 C
C), epoxy groups or alkoxy (C2 C–O), carbonyl group (C3 C![[double bond, length as m-dash]](https://www.rsc.org/images/entities/char_e001.gif) O) and carboxyl group (C4 O–C
O) and carboxyl group (C4 O–C![[double bond, length as m-dash]](https://www.rsc.org/images/entities/char_e001.gif) O), respectively.39 By contrast, the C2, C3 and C4 peaks in these FeNi/rGO samples are significantly attenuated or even eliminated. It proves that graphene oxide is enormously converted to reduced graphene oxide, which may contribute to the EM wave absorption property.47
O), respectively.39 By contrast, the C2, C3 and C4 peaks in these FeNi/rGO samples are significantly attenuated or even eliminated. It proves that graphene oxide is enormously converted to reduced graphene oxide, which may contribute to the EM wave absorption property.47
Electromagnetic parameters (ε′, ε′′, μ′, μ′′) of FeNi/rGO-20, FeNi/rGO-60 and FeNi/rGO-100 samples with a filler loading ratio of 33 wt% were measured on a vector network analyzer in the frequency region of 2–18 GHz. Based on previous studies of electromagnetic parameters, the real parts of permittivity (ε′) and permeability (μ′) represent the energy storage ability, while the imaginary parts of permittivity (ε′′) and permeability (μ′′) signify the energy loss capability.1,22 Fig. 7 presents the frequency dependence of EM parameters of these FeNi/rGO composites in the frequency region of 2–18 GHz. In Fig. 7a, the real parts of permittivity for the three samples appear roughly a downward trend. When the GO content is increased from 20 to 100 mg, the highest ε′ values of FeNi/rGO-100 composite over the entire frequency range manifest that the real part of permittivity has a strong dependence on the proportion of GO. A similar phenomenon is also observed for ε′′ curves.24 Moreover, the ε′′ curves of these FeNi/rGO composites exhibit several resonant peaks in the whole frequency range because of the multiple relaxation processes which are generally correlated with dipole polarization, conductive loss as well as interfacial polarization. According to the free electron theory, ε′′ = σ/2πεof, where σ is electrical conductivity (S m−1), εo is free space permittivity (8.854 × 10⁻¹² F m−1), and f is the microwave frequency.48 From the equation, the FeNi/rGO-100 composite possesses higher conductivity, which can account for good conductive loss. Interestingly, graphene oxide is deoxidized in favour of enhancing property of microwave absorption, as conductivity can be improved after oxygen functional groups are partly removed. As is known, the interfacial polarization can be caused by the existence of numerous interfaces among FeNi alloy nanoparticles, graphene nanosheets, carbon layers and the paraffin wax, which is beneficial to microwave absorption performance.49 Besides, reduced graphene oxide with its own unique characteristics, to a large extent, exerts influence on dielectric parameters. The residual oxygen-containing functional groups (discussed in XPS analysis) and defects (studied in Raman analysis) can be regarded as dipoles and act as polarized centers, thereby generating dipole polarization relaxations when EM wave are irrigated on the samples.9,50 More significantly, it mostly comes from the synergistic effect of FeNi alloy nanoparticles, reduced graphene oxide sheets, and carbon layers. These factors are also good explanation for the rising values of ε′ and ε′′ with the increasing proportion of GO.
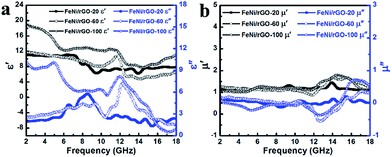 | ||
| Fig. 7 Frequency dependence of the real and imaginary parts of permittivity (a); real and imaginary parts of permeability (b) of FeNi/rGO-20, FeNi/rGO-60 and FeNi/rGO-100 composites. | ||
In generally, the dielectric loss can be interpreted by Debye theory, and the real (ε′) and imaginary parts (ε′′) of permittivity can be expressed as:51
 | (4) |
 | (5) |
 | (6) |
According to the formula 6, the plots of ε′ versus ε′′ will be a single semicircle, generally denoted as the Cole–Cole semicircle. Each semicircle corresponds to one Debye relaxation process.17 The curves of ε′ versus ε′′ of these FeNi/rGO composites are shown in Fig. S4.† The multiple distinguishable Cole–Cole semicircles described here represent different Debye relaxation behaviors, which are doubtlessly ascribed to the different proportion of GO, the size and load density of FeNi alloy particles on the graphene nanosheets, and heterogeneous interfaces between various components. All these factors may significantly contribute to the attenuation mechanism for the dissipation of EM wave.
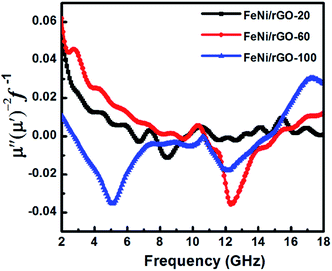
Fig. 7b demonstrates real part (μ′) and imaginary part (μ′′) of complex permeability for these FeNi/rGO composites with different GO proportions. The curves of μ′ and μ′′ for three samples reveal a similar trend of fluctuation, especially in the frequency range of 2–11 GHz. Negative μ′′ can be observed within a certain frequency range, which can be attributed to radiate out magnetic energy from FeNi/rGO composites.52 In general, magnetic loss mainly originates from nature resonance and eddy current loss.29 To evaluate the contribution of eddy current loss to magnetic loss, the equation μ′′(μ′)−2f−1 = 2πμod2σ is employed, where μo is the vacuum permeability, d is diameter of particles, and σ is electric conductivity of composite. According to the equation, if μ′′(μ′)−2f−1 values keep constant with increasing frequency, eddy current loss is the sole important element that can be responsible for magnetic loss.5 As displayed in Fig. 8, the curves of μ′′(μ′)−2f−1 of FeNi/rGO-20, FeNi/rGO-60 and FeNi/rGO-100 composites can be observed many fluctuations in the whole range of frequency, so magnetic loss of these samples not only stems from eddy current loss. For these FeNi/rGO composites, the nature resonance may be contributed by the small size effect of FeNi alloy nanoparticles. The natural resonance as a source of magnetic loss can be described by the natural-resonance equation:53
| Ha = 4|K|/3μ0Ms | (7) |
| 2πfr = rHa | (8) |
The dielectric loss tangent (tan![[thin space (1/6-em)]](https://www.rsc.org/images/entities/char_2009.gif) δε = ε′′/ε′) and magnetic loss tangent (tan
δε = ε′′/ε′) and magnetic loss tangent (tan![[thin space (1/6-em)]](https://www.rsc.org/images/entities/char_2009.gif) δμ = μ′′/μ′) correspond to materials' capability of dielectric and magnetic losses, generally, a higher value represents more energy loss due to its conversion to thermal energy or other form of energy.54,55 As displayed in Fig. 9a, for all samples, the values of dielectric loss tangent are higher than those of magnetic loss tangent except for small scale of frequency domain, making clear that dielectric loss makes a major contribution to the attenuation of electromagnetic wave. Obviously, the fluctuation trend of tan
δμ = μ′′/μ′) correspond to materials' capability of dielectric and magnetic losses, generally, a higher value represents more energy loss due to its conversion to thermal energy or other form of energy.54,55 As displayed in Fig. 9a, for all samples, the values of dielectric loss tangent are higher than those of magnetic loss tangent except for small scale of frequency domain, making clear that dielectric loss makes a major contribution to the attenuation of electromagnetic wave. Obviously, the fluctuation trend of tan![[thin space (1/6-em)]](https://www.rsc.org/images/entities/char_2009.gif) δε is just inverse to that of tan
δε is just inverse to that of tan![[thin space (1/6-em)]](https://www.rsc.org/images/entities/char_2009.gif) δμ, which can be interpreted by LRC equivalent circuit model, where L, R and C are the inductance, resistance and capacitance, respectively.16,56 Moreover, the attenuation constant (α) can be employed to further assess the integrated damping capability of the material taking into account of both dielectric loss and magnetic loss, and be calculated by the following equation:8,51
δμ, which can be interpreted by LRC equivalent circuit model, where L, R and C are the inductance, resistance and capacitance, respectively.16,56 Moreover, the attenuation constant (α) can be employed to further assess the integrated damping capability of the material taking into account of both dielectric loss and magnetic loss, and be calculated by the following equation:8,51
 | (9) |
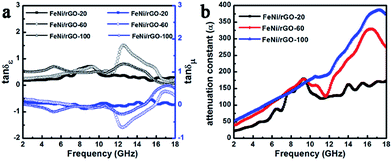 | ||
Fig. 9 Frequency dependence of tan![[thin space (1/6-em)]](https://www.rsc.org/images/entities/char_2009.gif) δε and tan δε and tan![[thin space (1/6-em)]](https://www.rsc.org/images/entities/char_2009.gif) δμ (a) and attenuation constant (b) of FeNi/rGO-20, FeNi/rGO-60 and FeNi/rGO-100 composites. δμ (a) and attenuation constant (b) of FeNi/rGO-20, FeNi/rGO-60 and FeNi/rGO-100 composites. | ||
With respect to microwave absorption performance of FeNi/rGO composites with different GO proportions, the reflection loss (RL) of corresponding coatings of various thicknesses was estimated according to transmit line theory at the frequency range of 2–18 GHz, as shown in Fig. 10. The FeNi/rGO-20 composite presents relatively weak absorption performance, which the minimum absorption is up to −25.5 dB at 7.36 GHz and effective absorption bandwidth is about 4.33 GHz at a thickness of 3.0 mm. When content of GO is added up to 60 mg, the minimum RL value is enhanced to −40.2 dB at 5.0 mm, and the astonishing thing is that the strongest absorption bandwidth of FeNi/rGO-60 sample reaches 5.7 GHz at a thin thickness of 2.0 mm. It is attractive to discover that FeNi/rGO-100 composite exhibits more optimized microwave absorption property. The optimized RL value of −42.6 dB at 14.3 GHz with a thinner thickness of 1.5 mm is achieved successfully, and the corresponding effective bandwidth below −10 dB can reach 4.0 GHz (12.3–16.3 GHz). The results of absorption performance agree well with the above demonstration that rational adjustment of dielectric and magnetic components is an efficient strategy to improve impedance matching and EM wave attenuation, and further enhance microwave absorption capability.
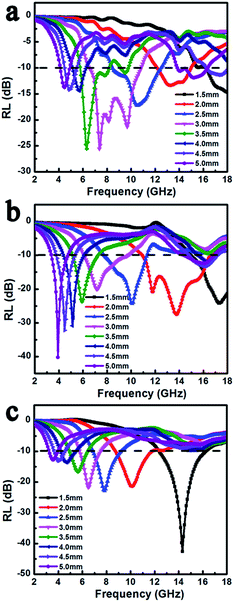 | ||
| Fig. 10 EM wave reflection loss of FeNi/rGO-20 (a), FeNi/rGO-60 (b) and FeNi/rGO-100 (c) composites. | ||
We can observe that absorption peaks shift to lower frequency along with increasing coating layer thickness, which can be well explained as follows:53,57
 | (10) |
Based on the above-mentioned analysis, it is reasonable that FeNi/rGO-100 composite exhibits excellent EM absorption capacity, originating from the synergistic effect and rational adjustment of dielectric and magnetic components that make material satisfy impedance matching and microwave attenuation as far as possible. The possible microwave absorption mechanism is illustrated in Scheme 2. The combination of FeNi alloy and graphene/carbon improves the impedance matching, which will prompt incident microwave to access to the material's interior. Then, the transmission of microwave can generate multiple reflection and scattering benefited from two-dimensional layer structures. Except for structural feature, the existence of magnetic nanoparticles triggers the magnetic loss, such as eddy current loss, natural resonance. What's more, a large amount of interfacial polarization at the interfaces between FeNi particles, reduced graphene oxide and amorphous carbon layers can lead to the increase of dielectric loss and thus affect the microwave absorption ability. In addition, conductive loss may further enhance the loss capability, which appears to be amplified with the increasing proportion of GO. It is worth to note that the introduction of reduced graphene oxide plays a vital role in the dielectric loss. The defects and residual oxygen-containing functional groups in the graphene nanosheets can serve as polarized and scattering centers, which may contribute to the improved absorption ability. Beyond that, the dipole polarization and charge transfer can convert EM wave energy into thermal energy when subjected to an external EM field. In general, the excellent EM wave absorption property is ascribed to the two-dimensional structure and synergistic effect of magnetic nanoparticles and graphene/carbon.
4. Conclusions
We propose a feasible and economical synthetic strategy to prepare a series of magnetic two-dimensional materials through a hydrothermal method followed by carbonization process. Analysis of those measured data reveals that magnetic nanoparticles, glucose and graphene oxide play rather vital roles in exploring the microwave absorbers. Among those, glucose is an indispensable ingredient as a reductant and a stabilizer to develop a target two-dimensional structure. The minimum reflection loss value of FeNi/rGO-100 composite can reach −42.6 dB at 14.3 GHz with a low thickness of 1.5 mm and the corresponding effective bandwidth of RL less than −10 dB is 4.0 GHz. The unique layered structure and synergistic effect of magnetic nanoparticles and graphene/carbon contribute to its excellent microwave absorption ability. These composites offer great potential in functional electromagnetic absorption materials.Conflicts of interest
There are no conflicts of interest to declare.Acknowledgements
This work was supported by grants from National Natural Science Foundation of China (No. 21771086), S&T Development Program of Jilin Province, China (No. 20150204030GX), Natural Science Foundation of Jilin Province, China (No. 20160101320JC and 20180101293JC), Open Fund of Key Laboratory of High Performance Ceramic Fibers of Xiamen University, Ministry of Education (No. 201602), The Education Department of Jilin Province (No. JJKH20170778KJ) and Open Funds of the State Key Laboratory of Rare Earth Resource Utilization (No. RERU2016014).References
- C. Zhang, B. C. Wang, J. Y. Xiang, C. Su, C. P. Mu, F. S. Wen and Z. Y. Liu, ACS Appl. Mater. Interfaces, 2017, 9, 28868–28875 CAS.
- Q. Zeng, P. Chen, Q. Yu, H. R. Chu, X. H. Xiong, D. W. Xu and Q. Wang, Sci. Rep., 2017, 7, 8388 CrossRef PubMed.
- W. B. You, H. Bi, W. She, Y. Zhang and R. C. Che, Small, 2017, 13, 1602779 CrossRef PubMed.
- N. Zhang, Y. Huang and M. Y. Wang, Composites, Part B, 2018, 136, 135–142 CrossRef CAS.
- D. Moitra, S. Dhole, B. K. Ghosh, M. Chandel, R. K. Jani, M. K. Patra, S. R. Vadera and N. N. Ghosh, J. Phys. Chem. C, 2017, 121, 21290–21304 CAS.
- F. M. Idris, M. Hashim, Z. Abbas, I. Ismail, R. Nazlan and I. R. Ibrahim, J. Magn. Magn. Mater., 2016, 405, 197–208 CrossRef CAS.
- S. H. Zhou, Y. Huang, J. Yan, X. P. Han and X. F. Chen, J. Mater. Sci.: Mater. Electron., 2017, 28, 18558–18567 CrossRef CAS.
- L. Quan, F. X. Qin, D. Estevez, H. Wang and H. X. Peng, Carbon, 2017, 125, 630–639 CrossRef CAS.
- C. Q. Song, X. W. Yin, M. K. Han, X. L. Li, Z. X. Hou, L. T. Zhang and L. F. Cheng, Carbon, 2017, 116, 50–58 CrossRef CAS.
- P. J. Liu, V. M. Ng, Z. J. Yao, J. T. Zhou, Y. M. Lei, Z. H. Yang, H. L. Lv and L. B. Kong, ACS Appl. Mater. Interfaces, 2017, 9, 16404–16416 CAS.
- P. B. Liu, Y. Huang, J. Yan and Y. Zhao, J. Mater. Chem. C, 2016, 4, 6362–6370 RSC.
- K. C. Zhang, X. B. Gao, Q. Zhang, T. P. Li, H. Chen and X. F. Chen, J. Alloys Compd., 2017, 723, 912–921 CrossRef CAS.
- S. S. Xiao, H. Mei, D. Y. Han, K. G. Dassios and L. F. Cheng, Carbon, 2017, 122, 718–725 CrossRef CAS.
- Y. J. Wan, P. L. Zhu, S. H. Yu, R. Sun, C. P. Wong and W. H. Liao, Carbon, 2017, 122, 74–81 CrossRef CAS.
- L. M. Ma, Z. G. Lu, J. B. Tan, J. Liu, X. M. Ding, N. Black, T. Y. Li, J. Gallop and L. Hao, ACS Appl. Mater. Interfaces, 2017, 9, 34221–43229 CAS.
- G. Z. Shen, B. Q. Mei, H. Y. Wu, H. Y. Wei, X. M. Fang and Y. W. Xu, J. Phys. Chem. C, 2017, 121, 3846–3853 CAS.
- Y. Sun, W. Zhong, Y. Q. Wang, X. B. Xu, T. T. Wang, L. Q. Wu and Y. W. Du, ACS Appl. Mater. Interfaces, 2017, 9, 34243–34255 CAS.
- Y. C. Du, W. W. Liu, R. Qiang, Y. Wang, X. J. Han, J. Ma and P. Xu, ACS Appl. Mater. Interfaces, 2014, 6, 12997–13006 CAS.
- X. Jian, B. Wu, Y. F. Wei, S. X. Dou, X. L. Wang, W. D. He and N. Mahmood, ACS Appl. Mater. Interfaces, 2016, 8, 6101–6109 CAS.
- A. Shah, A. Ding, Y. H. Wang, L. Zhang, D. X. Wang, J. Muhammad, H. Huang, Y. P. Duan, X. L. Dong and Z. D. Zhang, Carbon, 2016, 96, 987–997 CrossRef CAS.
- Y. Hou, L. F. Cheng, Y. N. Zhang, Y. Yang, C. R. Deng, Z. H. Yang, Q. Chen, P. Wang and L. X. Zheng, ACS Appl. Mater. Interfaces, 2017, 9, 7265–7271 CAS.
- D. Ding, Y. Wang, X. D. Li, R. Qiang, P. Xu, W. L. Chu, X. J. Han and Y. C. Du, Carbon, 2017, 111, 722–732 CrossRef CAS.
- B. Zhao, X. Q. Guo, W. Y. Zhao, J. S. Deng, B. B. Fan, G. Shao, Z. Y. Bai and R. Zhang, Nano Res., 2017, 10, 331–343 CrossRef CAS.
- R. L. Yang, B. C. Wang, J. Y. Xiang, C. P. Mu, C. Zhang, F. S. Wen, C. Wang, C. Su and Z. Y. Liu, ACS Appl. Mater. Interfaces, 2017, 9, 12673–12679 CAS.
- F. Wang, X. Wang, J. F. Zhu, H. B. Yang, X. G. Kong and X. Liu, Sci. Rep., 2016, 6, 37892 CrossRef CAS PubMed.
- Z. H. Zeng, H. Jin, M. J. Chen, W. W. Li, L. C. Zhou, X. Xue and Z. Zhang, Small, 2017, 13, 1701388 CrossRef PubMed.
- G. Li, T. S. Xie, S. L. Yang, J. H. Jin and J. M. Jiang, J. Phys. Chem. C, 2012, 116, 9196–9201 CAS.
- Q. Song, F. Ye, X. W. Yin, W. Li, H. J. Li, Y. S. Liu, K. Z. Li, K. Y. Xie, X. H. Li, Q. G. Fu, L. F. Cheng, L. T. Zhang and B. Q. Wei, Adv. Mater., 2017, 29, 1701583 CrossRef PubMed.
- W. Liu, J. J. Pan, G. B. Ji, X. H. Liang, Y. Cheng, B. Quan and Y. W. Du, Dalton Trans., 2017, 46, 3700–3709 RSC.
- X. P. Han, Y. Huang, S. H. Zhou, X. Sun, X. Y. Peng and X. F. Chen, J. Mater. Sci.: Mater. Electron., 2018, 29, 4179–4189 CrossRef CAS.
- L. Kong, X. W. Yin, Y. J. Zhang, X. Y. Yuan, Q. Li, F. Ye, L. F. Cheng and L. T. Zhang, J. Phys. Chem. C, 2013, 117, 19701–19711 CAS.
- X. Ding, Y. Huang, S. P. Li, N. Zhang and J. G. Wang, J. Alloys Compd., 2016, 689, 208–217 CrossRef CAS.
- Y. Cheng, G. B. Ji, Z. Y. Li, H. L. Lv, W. Liu, Y. Zhao, J. M. Cao and Y. W. Du, J. Alloys Compd., 2017, 704, 289–295 CrossRef CAS.
- Q. H. Liu, Q. Cao, H. Bi, C. Y. Liang, K. P. Yuan, W. She and Y. J. Yang, Adv. Mater., 2016, 28, 486–490 CrossRef CAS PubMed.
- N. Chen, J. T. Jiang, C. Y. Xu, Y. Yuan, Y. X. Gong and L. Zhen, ACS Appl. Mater. Interfaces, 2017, 9, 21933–21941 CAS.
- J. Li, L. Wang, D. Zhang, Y. Qu, G. M. Wang, G. Tian, A. H. Liu, H. J. Yue and S. H. Feng, Mater. Chem. Front., 2017, 1, 1786–1794 RSC.
- X. Tian, F. B. Meng, F. C. Meng, X. N. Chen, Y. F. Guo, Y. Wang, W. J. Zhu and Z. W. Zhou, ACS Appl. Mater. Interfaces, 2017, 9, 15711–15718 CAS.
- F. B. Meng, W. Wei, X. N. Chen, X. L. Xu, M. J. Jiang, L. Jun, Y. Wang and Z. W. Zhou, Phys. Chem. Chem. Phys., 2016, 18, 2510–2516 RSC.
- Z. X. Li, X. H. Li, Y. Z. Zong, G. G. Tan, Y. Sun, Y. Y. Lan, M. He, Z. Y. Ren and X. L. Zheng, Carbon, 2017, 115, 493–502 CrossRef CAS.
- B. Wen, M. S. Cao, M. M. Lu, W. Q. Cao, H. L. Shi, J. Liu, X. X. Wang, H. B. Jin, X. Y. Fang, W. Z. Wang and J. Yuan, Adv. Mater., 2014, 26, 3484–3489 CrossRef CAS PubMed.
- L. Zhao, Z. B. Wang, J. L. Li, J. J. Zhang, X. L. Sui and L. M. Zhang, Electrochim. Acta, 2016, 189, 175–183 CrossRef CAS.
- Y. P. Sun, X. G. Liu, C. Feng, J. C. Fan, Y. H. Lv, Y. R. Wang and C. T. Li, J. Alloys Compd., 2014, 586, 688–692 CrossRef CAS.
- M. Zong, Y. Huang, Y. Zhao, X. Sun, C. H. Qu, D. D. Luo and J. B. Zheng, RSC Adv., 2013, 3, 23638–23648 RSC.
- L. N. Wang, X. L. Jia, Y. F. Li, F. Yang, L. Q. Zhang, L. P. Liu, X. Ren and H. T. Yang, J. Mater. Chem. A, 2014, 2, 14940–14946 CAS.
- X. X. Liu, D. Zhang, B. Guo, Y. Qu, G. Tian, H. J. Yue and S. H. Feng, RSC Adv., 2015, 5, 93491–93498 RSC.
- J. Yang, E. W. Zhang, X. F. Li, Y. T. Zhang, J. Qu and Z. Z. Yu, Carbon, 2016, 98, 50–57 CrossRef CAS.
- P. K. Sahoo, R. Aepuru, H. S. Panda and D. Bahadur, Sci. Rep., 2015, 5, 17726 CrossRef CAS PubMed.
- Y. Wang, Y. C. Du, P. Xu, R. Qiang and X. J. Han, Polymers, 2017, 9, 29 CrossRef.
- X. H. Liang, X. M. Zhang, W. Liu, D. M. Tang, B. S. Zhang and G. B. Ji, J. Mater. Chem. C, 2016, 4, 6816–6821 RSC.
- M. K. Han, X. W. Yin, L. Kong, M. Li, W. Y. Duan, L. T. Zhang and L. F. Cheng, J. Mater. Chem. A, 2014, 2, 16403–16409 CAS.
- P. Wang, L. F. Cheng, Y. N. Zhang and L. T. Zhang, ACS Appl. Mater. Interfaces, 2017, 9, 28844–28858 CAS.
- Y. Sun, J. L. Xu, W. Qiao, X. B. Xu, W. L. Zhang, K. Y. Zhang, X. Zhang, X. Chen, W. Zhong and Y. W. Du, ACS Appl. Mater. Interfaces, 2016, 8, 31878–31886 CAS.
- Y. Wang, X. M. Wu, W. Z. Zhang, C. Y. Luo and J. H. Li, J. Magn. Magn. Mater., 2017, 443, 358–365 CrossRef CAS.
- X. L. Li, X. W. Yin, M. K. Han, C. Q. Song, H. L. Xu, Z. X. Hou, L. T. Zhang and L. F. Cheng, J. Mater. Chem. C, 2017, 5, 4068–4074 RSC.
- Y. Zhang, Y. Huang, H. H. Chen, Z. Y. Huang, Y. Yang, P. S. Xiao, Y. Zhou and Y. S. Chen, Carbon, 2016, 105, 438–447 CrossRef CAS.
- S. L. Guo, L. D. Wang and H. J. Wu, Adv. Powder Technol., 2015, 26, 1250–1255 CrossRef CAS.
- B. Zhao, B. B. Fan, G. Shao, W. Y. Zhao and R. Zhang, ACS Appl. Mater. Interfaces, 2015, 7, 18815–18823 CAS.
Footnote |
| † Electronic supplementary information (ESI) available: TG curves and SEM image of the FeNi/rGO-2.8glu and FeNi/rGO-20 composites, XRD, SEM and TEM images of FeNi/rGO-0glu, Cole–Cole semicircles of FeNi/rGO-20, FeNi/rGO-60 and FeNi/rGO-100 composites. See DOI: 10.1039/c7ra13737k |
| This journal is © The Royal Society of Chemistry 2018 |

