 Open Access Article
A multifunctional composite Fe3O4/MOF/L-cysteine for removal, magnetic solid phase extraction and fluorescence sensing of Cd(II)†
Lu Fan‡
a,
Min Deng‡a,
Caixue Lina,
Chen Xua,
Yana Liua,
Zhennan Shia,
Yingxi Wanga,
Zushun Xu a,
Ling Li
 *a and
Man He*b
aHubei Collaborative Innovation Center for Advanced Organic Chemical Materials, Ministry-of-Education Key Laboratory for the Synthesis and Application of Organic Function Molecules, Hubei University, 430062, People’s Republic of China. E-mail: lingli@hubu.ed.cn; Fax: +86-27-88663043; Tel: +86-27-88662747
bDepartment of Chemistry, Wuhan University, Wuhan City, Hubei Province 430074, People’s Republic of China. E-mail: heman@whu.edu.cn; Fax: +86-27-68754685; Tel: +86-27-68756759
First published on 16th March 2018
Abstract
Fe3O4/MOF (metal organic framework)/L-cysteine was synthesized and applied for the removal of Cd(II) from wastewater. The adsorption kinetics and isotherms were investigated, and the results indicated that the adsorption obeyed the pseudo-second-order kinetic model and Langmuir isotherm. The maximum adsorption capacity was calculated to be 248.24 mg g−1. Fe3O4/MOF/L-cysteine was further applied to determine trace amounts of Cd(II) in real water samples using ICP-AES (inductively coupled plasma-atomic emission spectroscopy) based on magnetic solid-phase extraction (MSPE). The determination limit was 10.6 ng mL−1. Additionally, Fe3O4/MOF/L-cysteine can also be used as a fluorescent sensor for “turn-off” detection of Cd(II), and the detection limit was 0.94 ng mL−1.
1. Introduction
Cadmium ions are heavy metal ions that are highly toxic to human beings,1–3 and as they can be accumulated through the food chain, they can cause great harm to people by causing kidney failure, anemia, cardiovascular diseases, growth impairment and loss of taste and smell.4 Therefore, it is of great significance to remove Cd(II) from water solutions and develop an effective method of determination for trace amounts of Cd(II).Many methods to remove cadmium ions have been reported, such as adsorption, precipitation, ion exchange, and membrane filtration. Adsorption is regarded as one of the most competitive methods because of its convenient operation and excellent treatment effect. In the process of adsorption, the adsorbent must have excellent stability and adsorption capacity. Furthermore, on the basis of the adsorbent, solid-phase extraction (SPE)5 and magnetic solid phase extraction (MSPE)6 can be set up to determine trace amounts of Cd(II).
SPE is widely used as a sample pretreatment method because of its high recovery rate, short extraction time, high preconcentration factor and easy automation.7 However, it may be difficult to completely separate and remove the adsorbent from the aqueous solution and may cause additional environmental problems. To overcome these disadvantages, magnetic solid phase extraction (MSPE) using magnetic nanoparticles has been developed, and the phase separation of the solid magnetic absorbent from the liquid sample can be done directly using an external magnet without the need for additional filtration or centrifugation procedures, which makes separation faster and easier. Generally, mostly magnetic adsorbents are composites of Fe3O4.
As the adsorbent plays an important role in Cd(II) removal and analysis, the design of the adsorbent is very important. Zhang synthesized Fe3O4/PANI/MnO2 hybrids materials as advanced adsorbents for removal of heavy metal ions.8 Lin prepared Fe3O4@SH nanoparticles for Cd(II) removal.9 Chen prepared Fe3O4@SiO2–NH-HCGs for removal of Cu(II), Hg(II), Pb(II) and Cd(II).10 However, these materials had limited functional modification, specific surface area and adsorption capacity. Therefore, the design of an efficient magnetic composite is attracting researchers’ interests.
Metal organic frameworks (MOFs), also known as coordination polymers or coordination networks, are unique crystalline materials formed by connecting metal centers and organic ligands into infinite arrays through dative bonds. MOFs have attracted much attention for their high porosity, large specific surface area, and easy for functional modification. The structure formed by Cu(II) and 5-aminoisophthalic acid (AIPA) is relatively stable, with relatively large specific surface area and suitable pore volume, which make it suitable for the adsorption of toxic heavy metal ions. Cu(II) was selected as the central ion, and 5-aminoisophthalic acid (AIPA) was chosen as the ligand. The coordination between the Cu(II) and the oxygen atoms of the ligand leads to the formation of the basic unit, which results in the porous structure of MOFs. On the basis of the porous structure, the addition of nano-Fe3O4 particles can form a magnetic composite that can potentially be used for MSPE. Safari prepared two kinds of Fe3O4/MOF and applied them to the preconcentration of the ions Co(II), Cu(II), Pb(II), Cd(II), Ni(II), Cr(III), and Mn(II) from aqueous solutions.11 Wang reported SH-Fe3O4/Cu3(BTC)2 composites for the extraction and determination of trace amounts of lead in food samples.12 On the other hand, MOFs are widely reported as fluorescent sensors to determine trace amounts of metal ions. Xing synthesized a Zn-MOF using a multiwalled divider installation strategy for sensing Co(II).13 Li synthesized a luminescent mesoporous Zn2TiO4:Eu3+ material for sensing heavy metal ions.14 Wu prepared a porous Zn-MOF for fluorescence sensing of Cu(II).15 In recent years, MOFs for the fluorescence sensing of Cd(II) have seldom been reported. Therefore, in this study, a combination of a MOF and Fe3O4 nanoparticles was used to form a magnetic composite, which was further modified by functional groups to sense metal ions. A kind of multifunctional material for the removal, magnetic solid phase extraction and fluorescence sensing of Cd(II) was obtained.
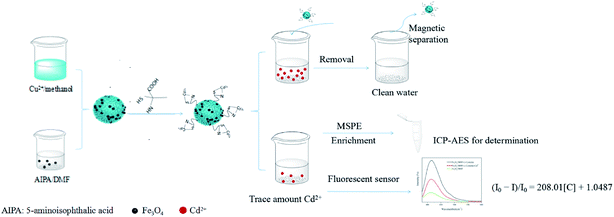
In this work, L-cysteine is used, which is a kind of natural amino acid with three types of functional group (–SH, –NH2 and –COOH) that could coordinate with Cd(II). Hence, Fe3O4/MOF was prepared, and further modified using L-cysteine to form Fe3O4/MOF/L-cysteine, as shown in Scheme 1. Fe3O4/MOF/L-cysteine was used as an MSPE adsorbent to remove Cd(II). A method of MSPE coupled with inductively coupled plasma-atomic emission spectroscopy (ICP-AES) for the analysis of Cd(II) was introduced. The conditions of adsorption–desorption were investigated. Furthermore, the kinetics for the adsorption model and the adsorption isotherms were investigated under optimal conditions, and the maximum adsorption capacity was calculated. In addition, Fe3O4/MOF/L-cysteine was investigated for detecting trace amounts of Cd(II). The analysis of real samples was further investigated. The material’s reusability and the limit of detection (LOD) were evaluated.
2. Materials and methods
2.1. Chemicals and reagents
All chemicals used were at least of analytical grade. Hexahydrate ferric chloride, anhydrous sodium acetate, copper nitrate trihydrate, sodium borohydride, sodium dihydrogen phosphate dihydrate, dodecahydrate disodium hydrogen phosphate, Tris (tris(hydroxymethyl) aminomethane)–HCl buffer, cadmium chloride, zinc nitrate, ferric chloride, chromic nitrate, lead nitrate, mercury nitrate, glutaraldehyde, ethylene glycol, anhydrous methanol, anhydrous ethanol and DMF (dimethylformamide) were obtained from Sinopharm Chemical Reagent Co., Ltd. (Shanghai, China). 5-Aminoisophthalic acid (AIPA) and L-cysteine were obtained from Aladdin (Shanghai, China). Ultrapure water (18.2 MU cm) was obtained from a WaterPro Water Purification System (Labconco Corporation, Kansas City, MO, USA). Ultrapure water was used in all experiments.The stock solution of Cd(II) (1000 ppm) was prepared by dissolving cadmium chloride in ultrapure water, and this was diluted to different concentrations for use. The Cd(II) concentrations were determined using ICP-AES spectroscopy. A calibration curve was obtained from the spectra of the standard solutions and was used to determine the residual concentrations of Cd(II) in solution. Phosphate buffer solutions (from pH 7.0 to pH 9.0) were prepared with different amounts of NaH2PO4 and Na2HPO4. Tris–HCl buffer solutions (from pH 3.0 to pH 6.0) were prepared with different volumes of Tris solution and HCl solution.
2.2. Instruments
Powder X-ray diffractometry (XRD) patterns were obtained using a D8 Advance X-ray diffractometer (Bruker Company, Germany). Fourier Transform Infra-Red (FT-IR) spectra were obtained using a Spectrum One FT-IR spectrophotometer (Perkin-Elmer, USA) at room temperature. Scanning electron microscope (SEM) images were obtained using a JSM6510LV scanning electron microscope (JEOL, Japan), and elemental analysis was performed using Energy Dispersive X-ray Spectroscopy (EDS) (JEOL, Japan). The thermal stability of the composites was investigated using a Thermo Gravimetric Analyzer (TGA) (TGA2, METTLER TOLEDO). N2 adsorption–desorption analysis was performed on an Accelerated Surface Area and Porosimetry System ASAP2020 (Micromeritics, USA). The surface area was estimated using the BET equation, and the pore size distribution was determined using the BJH model. Heavy metal ion concentrations were determined using inductively coupled plasma atomic emission spectroscopy (ICP-AES) (Optima 8000, Perkin-Elmer, USA).2.3. Synthesis of Fe3O4 nanoparticles
The magnetic nanoparticles were prepared according to a literature procedure with some modifications.16 Briefly, 1.73 g FeCl3·6H2O (6.40 mmol) was dissolved in ethylene glycol (35 mL), then 2.31 g NaAc (28.15 mmol) was added with magnetic stirring. After stirring for 30 minutes, the mixture was transferred to a 50 mL Telfon autoclave and heated at 200 °C for 8 h before cooling to room temperature. The black products were washed with ethanol and water several times, dried at 80 °C for 6 hours, and the Fe3O4 nanoparticles were obtained.2.4. Synthesis of Fe3O4/MOF
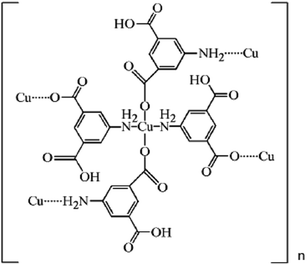
The Fe3O4/MOF crystals were prepared according to literature procedures with some modifications.17,18 Typically, 0.10 g nano-Fe3O4 (0.45 mmol) and 0.4529 g (2.50 mmol) AIPA were ultrasonically dispersed in 20 mL DMF for 30 min, and marked solution A. 1.08 g Cu(NO3)2 (4.50 mmol) was dispersed in 15 mL anhydrous methanol for 30 min, and marked solution B. Solution A and solution B were homogeneously mixed and then transferred to a Teflon autoclave for reaction at 120 °C for 12 h. The resulting crystals were washed with ethanol and water several times, respectively. The Fe3O4/MOF composites were obtained using magnetic separation and dried for 6 hours at 80 °C. According to the reported literature,18 the formula of the MOF is [Cu(C8H6NO4)2]n, and the structure is shown in Scheme 2.2.5. Synthesis of Fe3O4/MOF/L-cysteine
Fe3O4/MOF/L-cysteine was prepared according to a literature procedure with some modifications.19 Typically, 1.00 g of the Fe3O4/MOF composite was added to 100 mL of phosphate buffer (pH = 8.0) containing 5% glutaraldehyde and transferred to a 250 mL flask, then mechanically stirred at room temperature for 2 hours. After the product was separated and washed with ultrapure water three times, 0.30 g L-cysteine and 100 mL phosphate buffer (pH = 8.0) were added to the flask, and mechanically stirred for 2 h. 0.50 g NaBH4 was then added slowly and mechanical stirring was maintained for 6 hours. The product was separated and treated with ethanol and ultrapure water several times, then vacuum dried at 60 °C for 8 hours. Fe3O4/MOF/L-cysteine was obtained.2.6. Adsorption and desorption experiments
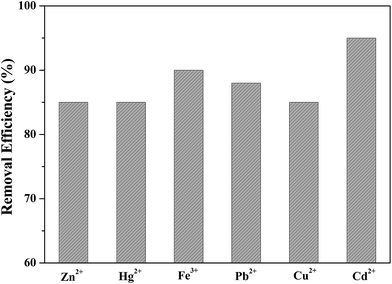
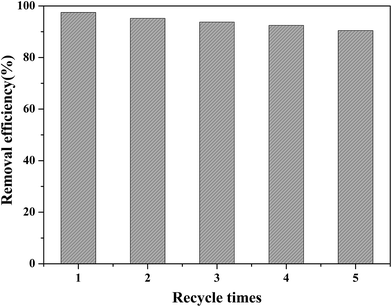
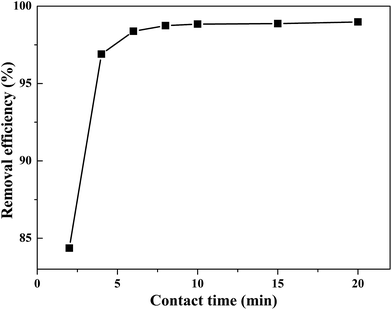
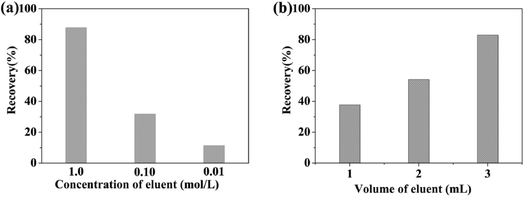
Before adsorption, the absorbent (50.00 mg) was added to a 100 mL sample solution with 1.000 ppm of Cd(II), Zn(II), Fe(III), Cu(II), Hg(II), and Pb(II), respectively. The mixture was shaken well for a fixed time from 2 to 20 min at room temperature. After reaching adsorption equilibrium, the absorbent was separated from the mixed solution using an external magnet. The concentration of residual heavy metal ions was determined using ICP-AES spectroscopy.The feasibility of regenerating the exhausted absorbent was evaluated using 1.0 mol L−1 HCl. The eluent solution was added to the used absorbent and ultrasonicated for 20 min.
2.7. Determination of the maximum adsorption capacity
The experiment to determine the maximum adsorption capacity was as follows: first, 0.05 g Fe3O4/MOF/L-cysteine was immersed in a solution with 10 ppm Cd(II). After obtaining adsorption equilibrium, the equilibrium adsorption capacity was calculated, and the Fe3O4/MOF/L-cysteine was dried and immersed in another solution with 20 ppm Cd(II) until adsorption equilibrium was again obtained. This was repeated until no Cd(II) could be adsorbed by the Fe3O4/MOF/L-cysteine. The sum of each equilibrium adsorption capacity was the maximum adsorption capacity.2.8. MSPE procedures
50.00 mg Fe3O4/MOF/L-cysteine was added to a 100 mL sample solution with 0.100 ppm of Cd(II) in a conical flask. The mixture was shaken at 200 rpm for 20 min before the Fe3O4/MOF/L-cysteine was magnetically separated from the sample solution. 1.0 mL 1 mol L−1 HCl was added to the used Fe3O4/MOF/L-cysteine and the mixture was ultrasonicated for 20 min. 3 mL desorption solution was injected into the ICP-AES system for analysis. After being washed several times with absolute ethanol and water using a centrifuge for 5 min, the extraction experiment was carried out at room temperature. The Fe3O4/MOF/L-cysteine was reused for the next magnetic solid phase extraction.2.9. Fluorescence sensing experiment
3.00 mg Fe3O4/MOF/L-cysteine and 3.00 mg Fe3O4/MOF were added into separate DMF solutions (10 mL), ultrasonicated for 20 min, and the fluorescence intensities of Fe3O4/MOF and Fe3O4/MOF/L-cysteine were determined using a fluorescence spectrometer (Perkin-Elmer LS55, USA), with an excitation wavelength of 330 nm. DMF solutions of different concentrations of Cd(II) (0.000 ppm, 0.002 ppm, 0.005 ppm, 0.020 ppm, 0.050 ppm, 0.100 ppm) were added to each solution, and the fluorescence intensities of Fe3O4/MOF/Cd2+ and Fe3O4/MOF/L-cysteine/Cd2+ were determined after the mixed solutions were ultrasonicated for 5 min at room temperature.2.10. Real sample analysis
In order to evaluate the accuracy of the procedure, an equal mass of Fe3O4/MOF/L-cysteine (50.00 mg) was added into 100 mL tap water and lake water, respectively. After the reaction, the adsorbent and the solution were separated using a magnet, then the adsorbent was eluted with an eluent. The cadmium ions in the eluate were measured using ICP-AES.3. Results and discussion
3.1. Characterization of Fe3O4/MOF and Fe3O4/MOF/L-cysteine
The XRD patterns of Fe3O4, L-cysteine, Fe3O4/MOF, Fe3O4/MOF/L-cysteine and Fe3O4/MOF/L-cysteine after adsorption are shown in Fig. 1. Six discernible diffraction peaks of Fe3O4 are at 30.2°, 35.6°, 43.1°, 53.5°, 57.0° and 62.6°, which are indexed as (220), (311), (400), (422), (511), and (440), respectively. The results correspond well to the standard characteristic peaks of Fe3O4 (JCPDS 75-1609).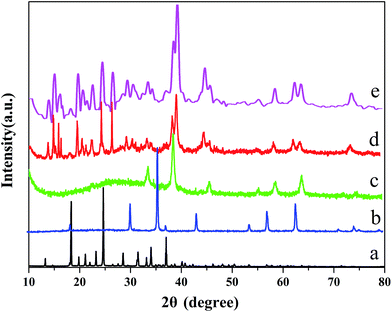 | ||
| Fig. 1 X-ray diffraction patterns of (a) L-cysteine, (b) Fe3O4, (c) Fe3O4/MOF, (d) Fe3O4/MOF/L-cysteine, and (e) Fe3O4/MOF/L-cysteine after adsorption. | ||
Compared with the diffraction peaks of Fe3O4, the peaks of Fe3O4/MOF and Fe3O4/MOF/L-cysteine shift a little, which is probably caused by the formation of composite materials between the Fe3O4, MOF and L-cysteine, which has an effect on the crystal’s structure. The diffraction peaks of L-cysteine are observed at 10.2°, 14.9°, 20.8° and 42.2°, and are observed in Fe3O4/MOF/L-cysteine, indicating that Fe3O4/MOF/L-cysteine is successfully synthesised and that the crystalline forms of Fe3O4/MOF and L-cysteine don’t change when the Fe3O4/MOF/L-cysteine composites are prepared. Comparing Fig. 1(d) with Fig. 1(e), the diffraction peaks of Fe3O4/MOF/L-cysteine after adsorption don’t obviously change, so we can make a conclusion that Fe3O4/MOF/L-cysteine has good stability.
In addition, Fe3O4, L-cysteine, Fe3O4/MOF, Fe3O4/MOF/L-cysteine and Fe3O4/MOF/L-cysteine after adsorption were further investigated using FT-IR spectroscopy, and the spectra are shown in Fig. 2. Although the spectra of Fe3O4/MOF and Fe3O4/MOF/L-cysteine are similar, there are obvious changes in the spectrum of Fe3O4/MOF/L-cysteine. The characteristic lattice vibration of Fe–O at about 580 cm−1 is obvious, indicating that the sample contains Fe3O4 in the Fe3O4/MOF and Fe3O4/MOF/L-cysteine spectra. The strong stretching-vibration bands in the range of 3000–3500 cm−1 belong to –OH and –NH2. The peak at 1734 cm−1 belongs to the stretching-vibrations of C![[double bond, length as m-dash]](https://www.rsc.org/images/entities/char_e001.gif) O. Compared to the Fe3O4/MOF spectrum, the peaks at 2582 cm−1 and 545 cm−1 in the L-cysteine and Fe3O4/MOF/L-cysteine spectra belong to the stretching-vibrations and bending-vibrations of S–H, and the peaks of S–H are weakened because of the small amounts of L-cysteine, which indicates the successful immobilization of L-cysteine on Fe3O4/MOF. As for the FT-IR spectrum of Fe3O4/MOF/L-cysteine after adsorption, the peak at 1734 cm−1 of the C
O. Compared to the Fe3O4/MOF spectrum, the peaks at 2582 cm−1 and 545 cm−1 in the L-cysteine and Fe3O4/MOF/L-cysteine spectra belong to the stretching-vibrations and bending-vibrations of S–H, and the peaks of S–H are weakened because of the small amounts of L-cysteine, which indicates the successful immobilization of L-cysteine on Fe3O4/MOF. As for the FT-IR spectrum of Fe3O4/MOF/L-cysteine after adsorption, the peak at 1734 cm−1 of the C![[double bond, length as m-dash]](https://www.rsc.org/images/entities/char_e001.gif) O group and the peaks of 3000–3200 cm−1 of –NH2 stay nearly unchanged. However, the peaks of 2582 cm−1 and 545 cm−1, which are attributed to the stretching-vibrations and bending-vibrations of S–H, disappear. It can be concluded that the adsorption force is the coordination between the S–H group and Cd(II). Therefore, there is chemical adsorption.
O group and the peaks of 3000–3200 cm−1 of –NH2 stay nearly unchanged. However, the peaks of 2582 cm−1 and 545 cm−1, which are attributed to the stretching-vibrations and bending-vibrations of S–H, disappear. It can be concluded that the adsorption force is the coordination between the S–H group and Cd(II). Therefore, there is chemical adsorption.
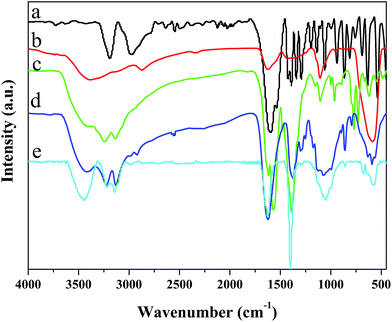 | ||
| Fig. 2 FT-IR spectra of (a) L-cysteine, (b) Fe3O4, (c) Fe3O4/MOF, (d) Fe3O4/MOF/L-cysteine, and (e) Fe3O4/MOF/L-cysteine after adsorption. | ||
The SEM images of Fe3O4/MOF, Fe3O4/MOF/L-cysteine, and Fe3O4/MOF/L-cysteine after adsorption, and EDS are shown in Fig. 3. It can be seen that the MOFs are flower-like clusters, and the particles on the MOF surface are Fe3O4 nanoparticles, which demonstrates that Fe3O4 particles are embedded in the MOF loose surface, as shown in Fig. 3(a and b). In comparison, the surface of Fe3O4/MOF/L-cysteine (Fig. 3(c and d)) is significantly different from that of Fe3O4/MOF. The Fe3O4/MOF/L-cysteine surface becomes closer, and the reason for this is the aggregation of L-cysteine on the loose surface of Fe3O4/MOF. The images of Fe3O4/MOF/L-cysteine after adsorption are shown in Fig. 3(e and f). It is clear that the surface morphology of Fe3O4/MOF/L-cysteine after adsorption stays the same as that of Fe3O4/MOF/L-cysteine before adsorption. This further proves the stability of Fe3O4/MOF/L-cysteine. In addition, the EDS of Fe3O4/MOF/L-cysteine is shown in Fig. 3(g). Cd is present in Fe3O4/MOF/L-cysteine, indicating successful adsorption of Cd(II).
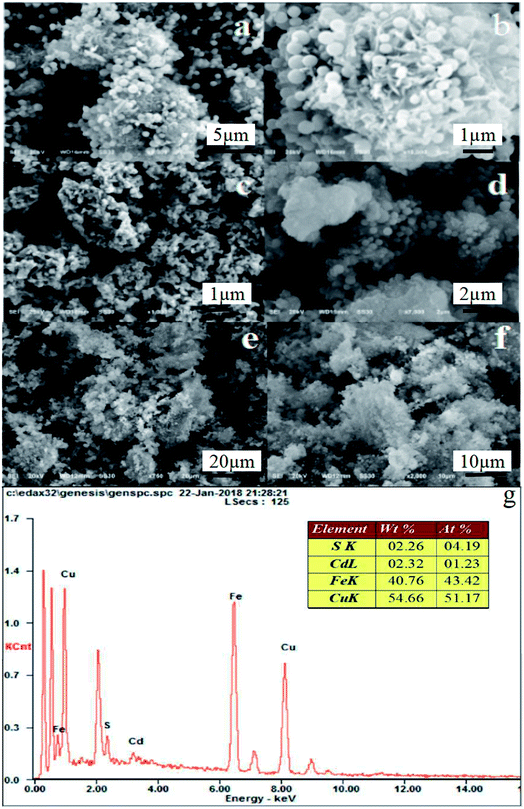 | ||
| Fig. 3 SEM images of Fe3O4/MOF (a and b), Fe3O4/MOF/L-cysteine (c and d), and Fe3O4/MOF/L-cysteine after adsorption (e and f). EDS of Fe3O4/MOF/L-cysteine (g). | ||
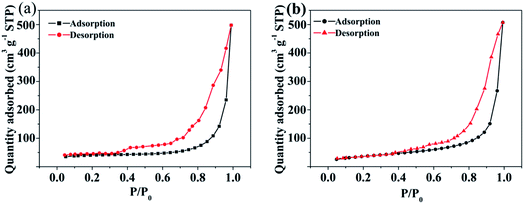
Fig. 4 shows the N2 adsorption–desorption isotherms of Fe3O4/MOF and Fe3O4/MOF/L-cysteine. Fe3O4/MOF and Fe3O4/MOF/L-cysteine have typical type IV curves with hysteresis loops, which are characteristic of mesoporous materials. The BET surface areas of Fe3O4/MOF and Fe3O4/MOF/L-cysteine are determined to be 666.18 m2 g−1 and 413.67 m2 g−1. The average pore sizes of Fe3O4/MOF and Fe3O4/MOF/L-cysteine are determined to be 23.16 nm and 16.45 nm. It is clear that the surface area, pore volume and pore size are all decreased after L-cysteine is added. This can be explained by the fact that the L-cysteine fills the pores to form a new composite.
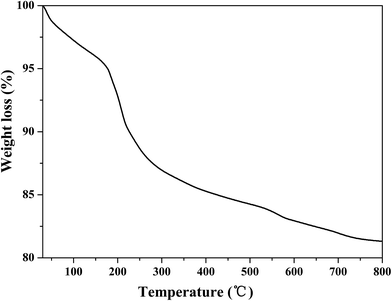
The thermal stability of Fe3O4/MOF/L-cysteine was investigated using TGA, as shown in Fig. 5. The 5% mass loss from the beginning to 180 °C results from the loss of adsorbed water from the composite. A mass loss of about 8% can be seen from 180 °C to 300 °C, which can be explained by the decomposition of the L-cysteine over 180 °C. The mass loss of approximately 7% is mainly because of the collapse of the MOF skeleton. These results further prove the composition of the composite.
3.2. The adsorption properties
The maximum adsorption capacities of different adsorbents are shown in Table 1. This shows that the maximum adsorption capacity of Fe3O4/MOF/L-cysteine is greater than that of other recently reported adsorbents.
ln(qe − qt) = ln![[thin space (1/6-em)]](https://www.rsc.org/images/entities/char_2009.gif) qe −k1t qe −k1t
| (1) |
The pseudo-second-order model is expressed as:
 | (2) |
The application of the pseudo-first-order and pseudo-second-order kinetic models to the adsorption of Cd(II) onto Fe3O4/MOF/L-cysteine has been investigated and the results are shown in Fig. 9. It is found that the regression coefficient of R2 for the pseudo-second-order model (R2 = 0.9998) is higher than that for pseudo-first-order. Hence, the pseudo-second-order kinetic model affords a more appropriate description of the adsorption process of Cd(II) on Fe3O4/MOF/L-cysteine.
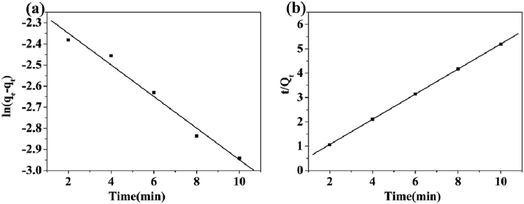 | ||
| Fig. 9 Pseudo-first-order kinetic plot (a) and pseudo-second-order kinetic plot (b) for the adsorption of Cd(II) on Fe3O4/MOF/L-cysteine. | ||
To describe the adsorption isotherm and analyze the equilibrium data more scientifically, the Langmuir adsorption isotherm and Freundlich adsorption isotherm are employed. The Langmuir isotherm is expressed as:
 | (3) |
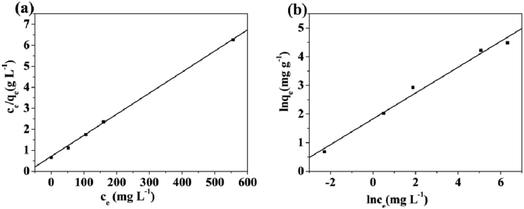 | ||
| Fig. 10 Adsorption isotherms fitted by the Langmuir (a) and Freundlich (b) models for Cd(II) on Fe3O4/MOF/L-cysteine. | ||
The Freundlich isotherm is expressed as:
 | (4) |
![[thin space (1/6-em)]](https://www.rsc.org/images/entities/char_2009.gif) qe against ln
qe against ln![[thin space (1/6-em)]](https://www.rsc.org/images/entities/char_2009.gif) ce is obtained from the Freundlich model as shown in Fig. 10(b). It is found that the value of R2 for the Langmuir model (R2 = 0.9998) is higher than that for the Freundlich model (R2 = 0.9684), indicating that the Langmuir adsorption model is more suitable for describing the adsorption isotherm of Cd(II) on the absorbent. This implies that the surface of the material is more homogeneous, with a predominant chemical adsorption mechanism.
ce is obtained from the Freundlich model as shown in Fig. 10(b). It is found that the value of R2 for the Langmuir model (R2 = 0.9998) is higher than that for the Freundlich model (R2 = 0.9684), indicating that the Langmuir adsorption model is more suitable for describing the adsorption isotherm of Cd(II) on the absorbent. This implies that the surface of the material is more homogeneous, with a predominant chemical adsorption mechanism.
In the process of the adsorption of Cd(II), the thermodynamic equilibrium constant (K) and the free energy change (ΔG) were determined by changing the experimental temperatures to be 295 K, 305 K and 315 K. The energy change of adsorption is calculated using the following equations:
| K = qe/ce | (5) |
ΔG=−RT![[thin space (1/6-em)]](https://www.rsc.org/images/entities/char_2009.gif) ln ln![[thin space (1/6-em)]](https://www.rsc.org/images/entities/char_2009.gif) K K
| (6) |
 | (7) |
| T (K) | K | ΔH (kJ mol−1) | ΔS (J mol−1 K−1) | ΔG (kJ mol−1) |
|---|---|---|---|---|
| 295 | 64.56 | −10.22 | ||
| 305 | 120.87 | −44.16 | 184.5 | −12.16 |
| 315 | 206.67 | −13.96 |
ln![[thin space (1/6-em)]](https://www.rsc.org/images/entities/char_2009.gif) Qe = ln Qe = ln![[thin space (1/6-em)]](https://www.rsc.org/images/entities/char_2009.gif) Qm − Bd[RT Qm − Bd[RT![[thin space (1/6-em)]](https://www.rsc.org/images/entities/char_2009.gif) ln(1 + 1/ ce)]2 ln(1 + 1/ ce)]2
| (8) |
| E = 1/(2Bd)1/2 | (9) |
Linear plots between ln![[thin space (1/6-em)]](https://www.rsc.org/images/entities/char_2009.gif) Qe and RT
Qe and RT![[thin space (1/6-em)]](https://www.rsc.org/images/entities/char_2009.gif) ln(1 + 1/ce)2 at different temperatures are shown in Fig. 11. The D–R constants were estimated using the intercepts and slopes of linear plots. For the adsorption process for Cd(II), E was calculated to be 2.49, 5.13 and 8.91 kJ mol−1 at different temperatures (a, b and c), respectively. It can be concluded that the driving force was mainly physical adsorption at low temperature. With increasing temperature, the main driving force was chemical adsorption resulting from the coordination between Cd(II) and L-cysteine. The conclusion is consistent with the FT-IR spectrum of Fe3O4/MOF/L-cysteine after adsorption.
ln(1 + 1/ce)2 at different temperatures are shown in Fig. 11. The D–R constants were estimated using the intercepts and slopes of linear plots. For the adsorption process for Cd(II), E was calculated to be 2.49, 5.13 and 8.91 kJ mol−1 at different temperatures (a, b and c), respectively. It can be concluded that the driving force was mainly physical adsorption at low temperature. With increasing temperature, the main driving force was chemical adsorption resulting from the coordination between Cd(II) and L-cysteine. The conclusion is consistent with the FT-IR spectrum of Fe3O4/MOF/L-cysteine after adsorption.
3.3. Optimization of MSPE procedure
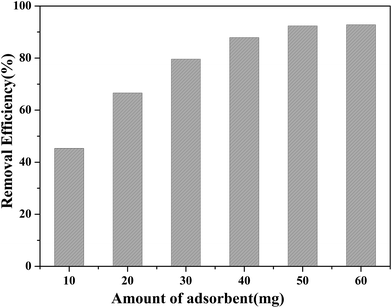
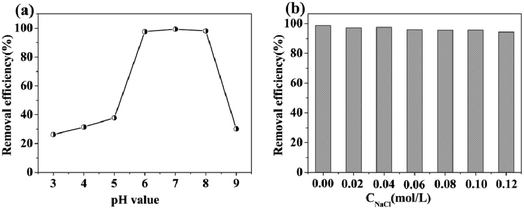
Because of the excellent adsorption properties of Fe3O4/MOF/L-cysteine, the MSPE procedure was set up and the extraction was optimized.The absorbent Fe3O4/MOF/L-cysteine was applied in MSPE to determine and enrich trace amounts of Cd(II) using ICP-AES spectra. The results show that the preconcentration factor is 94, and the determination limit is 10.6 ng mL−1.
| Sample | Amount of Cd(II) (ng) | Recovery(%) | |
|---|---|---|---|
| Added | Found | ||
| a ND: not found. The volume of the solution is 100 mL. | |||
| Tap water | — | ND | 98.7% |
| 1.0 | 0.987 | ||
| Lake water | — | ND | 105.4% |
| 1.0 | 1.054 | ||
3.4. Fluorescence sensing of Cd(II)
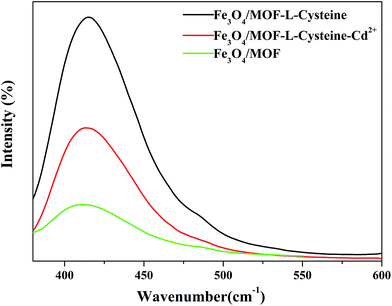
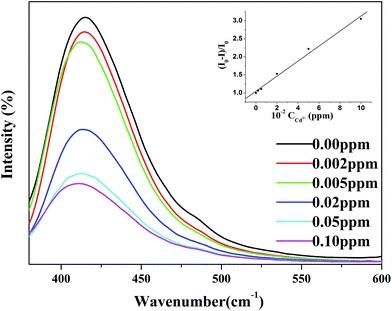
To examine the potential as a sensor for Cd(II) of Fe3O4/MOF/L-cysteine, the fluorescence properties of Fe3O4/MOF/L-cysteine are discussed, as shown in Fig. 17. It can be seen that the fluorescence intensity of Fe3O4/MOF at 415 nm is weak. After formation of the composite Fe3O4/MOF/L-cysteine, the intensity increases a lot. When 0.02 ppm Cd(II) is added into Fe3O4/MOF/L-cysteine, the intensity decreases clearly. It is obvious that Fe3O4/MOF/L-cysteine can potentially be used as a fluorescent probe for “turn-off” detection of Cd(II).The relationship between the fluorescence intensity and Cd(II) concentration was investigated, as shown in Fig. 18. It was found that the fluorescence of Fe3O4/MOF/L-cysteine becomes more quenched with increased Cd(II) concentration. When the Cd(II) concentration is in the range of 0.00 to 0.100 ppm, there is a linear relationship between decreased intensity and Cd(II) concentration. The good linear correlation is shown as the following equation:
| (I0 − I)/I0 = 208.01[C] + 1.0487 | (10) |
3.5. Comparison with other materials
A comparison with recently reported materials for the removal of Cd(II) is shown in Table 4. It can be concluded that Fe3O4/MOF/L-cysteine is suitable for application in magnetic solid phase extraction and fluorescence sensing of Cd(II).| Material | Method | LOD (μg L−1) | Ref. |
|---|---|---|---|
| Eu3+/Uio-66(Zr)–(COOH)2 | Fluorescent sensor | 6.74 | 25 |
| Fe3O4/ZrO2 | ICP-AES | 1.01 | 26 |
| Fe3O4-ethylenediamine/MIL-101(Fe) | FAAS | 1.05 | 27 |
| Cd2+-selective electrode | Electrochemical sensor | 1.45 | 28 |
| Rhodamine derivative | Fluorescent sensor | 1.15 | 29 |
| Fe3O4/MOF/L-cysteine | Fluorescent sensor | 0.94 | This work |
| Fe3O4/MOF/L-cysteine | ICP-AES | 10.60 | This work |
4. Conclusion
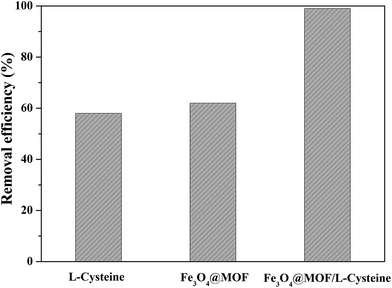
In this work, Fe3O4/MOF/L-cysteine is successfully synthesized and applied for the removal of Cd(II) from wastewater. Compared to Fe3O4/MOF and L-cysteine, Fe3O4/MOF/L-cysteine shows better removal efficiency for Cd(II), indicating that L-cysteine plays an important role in increasing the adsorption capacity of Cd(II) in solution. The kinetics for the adsorption and the adsorption isotherms were investigated and the results indicate that the pseudo-second-order kinetics model matches with the adsorption of Cd(II) on Fe3O4/MOF/L-cysteine. The Langmuir model is more suitable for describing the adsorption behavior on Fe3O4/MOF/L-cysteine.The desorption experiment indicates that Fe3O4/MOF/L-cysteine has great prospects in the removal of heavy metal ions in the area of industrial wastewater treatment. Furthermore, the absorbent Fe3O4/MOF/L-cysteine was applied in MSPE to determine and enrich the trace amount of Cd(II) using ICP-AES spectroscopy. The results show that the determination limit is 10.6 ng mL−1 and the recovery values for Cd(II) are in the range of 98.7–105.4%. Furthermore, Fe3O4/MOF/L-cysteine can also be a fluorescent sensor for detecting ultra low concentrations of Cd(II), and the detection limit (LOD) and relative standard deviation (RSD) were calculated to be 0.94 ng mL−1 and 6.48%, respectively. Thus, it can be seen that Fe3O4/MOF/L-cysteine not only is an excellent absorbent to detect trace amounts of Cd(II) by ICP-AES spectroscopy, but also as a fluorescent sensor detects ultra low concentrations of Cd(II) by fluorescence spectroscopy.
Conflicts of interest
There are no conflicts to declare.Acknowledgements
This work was supported by the Natural Science Foundation of Hubei Province (No. 2017CFB530) and Wuhan Morning Light Plan of Youth Science and Technology (No. 2017050304010282).References
- A. Rani, A. Kumar, A. Lal and M. Pant, Int. J. Environ. Health Res., 2014, 24, 378 CrossRef CAS PubMed.
- Y. Chen, Z. P. Chen, S. Y. Long and R. Yu, Anal. Chem., 2014, 86, 12236 CrossRef CAS PubMed.
- M. Asgher, M. Khan, N. Anjum and N. K. Han, Protoplasma, 2015, 252, 399 CrossRef CAS PubMed.
- K. F. Lam, K. L. Yeung and G. Mckay, Environ. Sci. Technol., 2007, 41, 3329 CrossRef CAS PubMed.
- R. B. Priscilla, M. B. Carla, P. Verónica, P. Jorge, A. H. Juan, R. P. Catalina and A. M. Ana, Talanta, 2015, 139, 13 CrossRef PubMed.
- Y. Gao, S. D. Galan, A. D. Brauwere, W. Baeyens and M. Leermakers, Talanta, 2010, 82, 1919 CrossRef CAS PubMed.
- S. H. Huo and X. P. Yan, Analyst, 2012, 137, 3445 RSC.
- J. Zhang, J. Han, M. Wang and R. Guo, J. Mater. Chem. A, 2017, 5, 4058 CAS.
- S. Lin, Y. Yang, G. Chen, X. Chen, W. Zhang and M. Xu, Appl. Surf. Sci., 2017, 425, 141 CrossRef CAS.
- D. Chen, T. Awut, B. Liu, Y. Ma, T. Wang and I. Nurulla, E-Polymers, 2016, 16, 313 CAS.
- M. Safari, Y. Yamini and M. Y. Masoomi, Mikrochim. Acta, 2017, 184, 1555 CrossRef CAS.
- W. Yang, H. Chen and T. Jie, Food Chem., 2015, 181, 191 CrossRef PubMed.
- K. Xing, R. Fan, J. Wang, S. Zhang, K. Feng, X. Du, Y. Song, P. Wang and Y. Yang, ACS Appl. Mater. Interfaces, 2017, 9, 1988 Search PubMed.
- J. Li, B. Wu, Q. Zhang, H. Wang and Y. Li, J. Nanosci. Nanotechnol., 2016, 16, 9568 CrossRef CAS.
- W. Wu, B. Li, C. Gu, J. Wang, A. Singh and A. Kumar, J. Mol. Struct., 2017, 1148, 531 CrossRef CAS.
- J. Liu, Z. Sun, Y. Deng, Y. Zou, C. Li, X. Guo, L. Xiong, Y. Gao, F. Li and D. Zhao, Angew. Chem., 2009, 121, 5989 CrossRef.
- L. Li, K. K. Sun, L. Fan, W. Hong, Z. S. Xu and L. Liu, Mater. Lett., 2014, 126, 197 CrossRef CAS.
- Q. X. Liao, Z. J. Li, J. Zhang, Y. Kang and Y. M. Yao, Acta Crystallogr., Sect. C: Cryst. Struct. Commun., 2004, 60, m509 Search PubMed.
- C. D. Wu, C. Z. Lu, W. B. Yang, H. H. Zhuang and J. S. Huang, Inorg. Chem., 2002, 41, 3302 CrossRef CAS PubMed.
- J. Ma, K. Jia, G. Cheng and S. Zhang, J. Environ. Eng., 2016, 142, 04016062 CrossRef.
- S. He, F. Zhang, S. Cheng and W. Wang, ACS Sustainable Chem. Eng., 2016, 4, 3948 CrossRef CAS.
- P. Tan, Y. Hu and Q. Bi, Colloids Surf., A, 2016, 509, 56 CrossRef CAS.
- M. Waseem, S. T. Muntha, M. Nawaz, W. Rehman, M. A. Rehman and K. H. Shah, Mater. Res. Express, 2017, 4, 1 Search PubMed.
- K. K. H. Choy, G. Mckay and J. F. Porter, Resour., Conserv. Recycl., 1999, 27, 1–2 CrossRef.
- J. Hao and B. Yan, Chem. Commun., 2015, 51, 7737 RSC.
- S. Zhu, F. Hu, D. Pan, W. Xu and N. Gan, Adv. Mater. Res., 2012, 487, 658 CrossRef CAS.
- M. Babazadeh, R. H. Khanmiri, J. Abolhasani, E. Ghorbani-Kalhor and A. Hassanpour, RSC Adv., 2015, 2, 32 Search PubMed.
- S. Yu, F. Li and W. Qin, Sens. Actuators, B, 2011, 155, 919 CrossRef CAS.
- M. Maniyazagan, R. Mariadasse, J. Jeyakanthan, N. K. Lokanath, S. Naveen, K. Premkumar, P. Muthuraja, P. Manisankar and T. Stalin, Sens. Actuators, B, 2017, 238, 565 CrossRef CAS.
Footnotes |
| † Electronic supplementary information (ESI) available. See DOI: 10.1039/c8ra00070k |
| ‡ These authors contributed equally to this work. |
| This journal is © The Royal Society of Chemistry 2018 |

