 Open Access Article
Creative Commons Attribution 3.0 Unported Licence
Synthesis of nitrogen doped carbon quantum dots/magnetite nanocomposites for efficient removal of methyl blue dye pollutant from contaminated water†
Aschalew Tadesseac,
Dharmasoth RamaDevib,
Mabrahtu Hagos ad,
GangaRao Battub and
K. Basavaiah
 *a
*a
aDepartment of Inorganic and Analytical Chemistry, Andhra University, Visakhapatnam-530003, India. E-mail: klbasu@gmail.com
bAU College of Pharmaceutical Sciences, Andhra University, Visakhapatnam-530003, India
cDepartment of Applied Chemistry, Adama Science and Technology University, Adama-1888, Ethiopia
dFaculty of Natural and Computational Sciences, Woldia University, Woldia-400, Ethiopia
First published on 23rd February 2018
Abstract
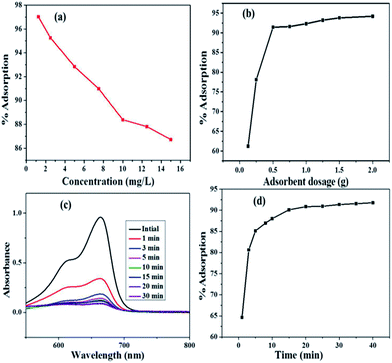
As a remedy for environmental pollution, a simple synthesis approach has been developed to prepare nitrogen doped carbon quantum dot/magnetite nanocomposites (Fe3O4@NCQDs NCs) using non-toxic and cost effective lemon juice as precursor for removal of organic dye pollutant. Fe3O4@NCQDs NCs were characterized by using UV-Vis spectroscopy, FTIR, XRD, FESEM, EDS, TEM, VSM and TGA/DTA. TEM results show spherical shaped Fe3O4@NCQDs NCs with an average particle size of 5 nm. Batch adsorption studies were done to investigate the tendency of the nanocomposites to remove representative methyl blue (MB) dye from aqueous solution. The effects of MB dye concentration, dosage of Fe3O4@NCQDs NC adsorbent, pH, contact time and temperature were optimized by varying one variable while all the other parameters were kept constant. The experiment showed rapid removal of MB dye within 20 minutes with an adsorption efficiency of over 90.84% under optimum conditions. The adsorption process fits the Freundlich isotherm model well with R2 and n values of 0.993 and 1.842, respectively, at 298 K indicating the feasibility of the adsorption process. The adsorption process is spontaneous and involves exothermic behaviour as confirmed by thermodynamic studies. From a kinetic study, it was found that the pseudo-second order model is more suitable to describe the adsorption process than the pseudo-first order model for adsorption of MB dye onto Fe3O4@NCQDs NCs.
1 Introduction
During the past decades, the release of large quantities of toxic, carcinogenic and non-biodegradable organic dye pollutants into aquatic systems has continuously increased due to rapid industrialization, civilization and agricultural activity.1 The presence of organic dye pollutants even at trace levels in effluents is very dangerous to human and aquatic life. The organic dye pollutants remain highly visible, resistant to aerobic digestion and stable to oxidizing agents due to their complex chemical structure and synthetic origin.2 Therefore, it is highly desirable to develop an environmental friendly, highly efficient and cost effective method for removal of organic dye pollutants from wastewater effluents even at trace levels.Different treatment methods such as biological treatment,3 flocculation–coagulation,4 adsorption,5 membrane filtration6 and oxidation7 have been used to remove dyes from wastewater effluents. Among these methods, the adsorption method is the simplest, efficient and low cost method for removal of dyes from wastewater effluents with no generation of byproducts and various natural and synthetic materials have been used as adsorbents.8,9 Recently, nanoscience and nanotechnology research introduced nanoadsorbent with more efficient adsorption, low cost and recyclable properties. The most repeatedly investigated nanoadsorbent is magnetite nanoparticles (Fe3O4 NPs) based nanomaterials due to their excellent magnetic, biocompatible properties, facile synthesis and ease with which they may be tuned and functionalized for specific applications.10,11 Moreover, the most important advantage of Fe3O4 NPs is its easy separation and purification after application by an external magnet due to its magnetic properties.12,13 However, bare Fe3O4 NPs could easily aggregate in aqueous system to reduce the energy associated with surface area to volume ratio and the strong dipole–dipole attraction between particles and easily undergo oxidation and thus limits their technological applications.14,15 To effectively use the advantage of Fe3O4 NPs for technological applications, researchers have been continuously designing the aggregate free Fe3O4 NPs via surface modification and functionalization.16–18
A wide range of chemicals such as chitosan, activated carbon, polymers, graphene quantum dots, graphene oxide, multiwall carbon nanotubes, etc. have been employed for preparation of Fe3O4 NPs based nanocomposites for pollution abatement.19–23 In preparation of Fe3O4–chitosan nanocomposites, the surface of magnetite modified with amine and hydroxyl groups on chitosan.24 As a class of newly emerging fluorescent nanomaterials, carbon quantum dots (CQDs) have offered tremendous opportunities for a wide scope of applications due to its excellent properties like good stability and solubility in water, low cost and biocompatibility.25,26 Tremendous promise has been shown in different applications by compositing carbon quantum dots with nanoparticles.27 Similar to chitosan, nitrogen doped carbon quantum dots have reactive amine and hydroxyl groups which are amenable to chemical modifications and therefore, in nanocompositing Fe3O4 with nitrogen doped carbon quantum dots (NCQDs), amine and carboxyl groups on NCQDs modify the surface of Fe3O4 and protect the nanocomposites from aggregation. In addition, nitrogen doped carbon quantum dots (NCQDs) can preserve structural stabilization of Fe3O4 NPs as capping agent and improve the surface of the materials by providing important functional groups which are important for interaction of the nanocomposites with chemical pollutant in environment.28
In this paper, we report the design and synthesis of magnetic and eco-friendly Fe3O4@NCQDs NCs via coprecipitation using lemon juice as precursor. The as prepared Fe3O4@NCQDs NCs have been applied for efficient removal of methyl blue (MB) dye from contaminated water. The effects of various experimental conditions such as contact time, initial concentration, pH, temperature and adsorbent dosages on the removal efficiency of MB were evaluated through a batch adsorption experiments.
2 Experimental section
2.1 Chemicals and reagents
Iron(III) chloride hexahydrate (FeCl3·6H2O) and iron(II) sulphate heptahydrate (FeSO4·7H2O) were purchased from Merck, India. Fresh lemon fruits were purchased from the local store nearby Andhra University. 100 mL stainless steel Teflon lined autoclave was used for hydrothermal synthesis of NCQDs. Milli-Q water was used throughout the experiments. Ethylenediamine was purchased from LOBA Chemie, Mumbai, India. All the reagents used are analytical grade and used as received without any further purification.2.2 Synthesis of NCQDs from lemon juice
Hydrothermal method was used to synthesis nitrogen doped carbon quantum dots (NCQDs) by taking 20 mL of lemon juice and 2 mL of ethylenediamine in a 100 mL Teflon-lined stainless steel autoclave and heated at 200 °C in furnace for 3 hours. The obtained black paste was dissolved in 15 mL of water and centrifuged at 3000 rpm for 15 minutes to remove insoluble matter. Dichloromethane was added to the brown solution formed and centrifuged at 3000 rpm for 20 minutes to remove unreacted organic moieties. The aqueous layer was separated from lower organic layer and centrifuged at 12![[thin space (1/6-em)]](https://www.rsc.org/images/entities/char_2009.gif) 000 rpm for 20 minutes thrice to remove larger size particles and the brown yellowish solution was finally obtained. To further get the smaller particle size of NCQDs, cleaning was done using column chromatographic separation in help of silica gel and dichloromethane as solvent. The resulting NCQDs was characterized and used for preparation of novel Fe3O4@NCQDs NCs.
000 rpm for 20 minutes thrice to remove larger size particles and the brown yellowish solution was finally obtained. To further get the smaller particle size of NCQDs, cleaning was done using column chromatographic separation in help of silica gel and dichloromethane as solvent. The resulting NCQDs was characterized and used for preparation of novel Fe3O4@NCQDs NCs.
2.3 Synthesis of Fe3O4@NCQDs NCs
Syntheses of Fe3O4@NCQDs NCs were done via coprecipitation reaction. In the procedure, 100 mL aqueous solution of 2![[thin space (1/6-em)]](https://www.rsc.org/images/entities/char_2009.gif) :
:![[thin space (1/6-em)]](https://www.rsc.org/images/entities/char_2009.gif) 1 molar ratio of metal salts Fe3+ (1.1127 g FeCl3·6H2O) and Fe2+ (0.5708 g FeSO4·7H2O) was added in 250 mL three neck round bottom flask and the reaction was carried out for one hour under constant stirring in atmospheric nitrogen at 80 °C. To the reaction flask, 25 mL diluted NCQDs aqueous solution (5 mg mL−1 and 10 mg mL−1) was added and reaction continued for 30 minutes. Then 20 mL of 2 M NaOH was added drop wise. The reaction was allowed to continue under stirring for 2 hours at 80 °C. Finally, the black precipitate was obtained and separated by decantation with help of external magnet, washed several times with Milli-Q water, and dried under vacuum at room temperature. Bare Fe3O4 NPs was synthesized in the same procedure without using NCQDs.
1 molar ratio of metal salts Fe3+ (1.1127 g FeCl3·6H2O) and Fe2+ (0.5708 g FeSO4·7H2O) was added in 250 mL three neck round bottom flask and the reaction was carried out for one hour under constant stirring in atmospheric nitrogen at 80 °C. To the reaction flask, 25 mL diluted NCQDs aqueous solution (5 mg mL−1 and 10 mg mL−1) was added and reaction continued for 30 minutes. Then 20 mL of 2 M NaOH was added drop wise. The reaction was allowed to continue under stirring for 2 hours at 80 °C. Finally, the black precipitate was obtained and separated by decantation with help of external magnet, washed several times with Milli-Q water, and dried under vacuum at room temperature. Bare Fe3O4 NPs was synthesized in the same procedure without using NCQDs.
2.4 Characterization
UV-Vis absorption spectra of the synthesised NCQDs, Fe3O4 NPs and Fe3O4@NCQDs NCs were obtained using a UNICAM UV 500(Thermo Electron Corporation). Fourier transform infrared spectra (FTIR) were obtained over the range of 400–4000 cm−1 using a SHIMADZU-IR PRESTIGE-2 Spectrometer. X-ray powder diffraction (XRD) pattern were recorded using PANalyticalX'pert pro diffractometer using Cu-Kα1 radiation (45 kV, 1.54056 Å; scan rate of 0.02 degree per s). The morphology and microstructures of the synthesized Fe3O4@NCQDs NCs were investigated by transmission electron microscopy (TEM) and high resolution transmission electron microscopy (HRTEM, Jeol/JEM 2100, LaB6) operated at 200 kV. Further morphology and composition of Fe3O4@NCQDs NCs were characterized using field emission scanning electron microscopy (FESEM, Zeiss Ultra-60) equipped with X-ray energy dispersive spectroscopy (EDS). Magnetic property of the material was determined at room temperature using vibrating sample magnetometer (Lakeshore VSM 7410). Composition of the Fe3O4@NCQDs NCs was further confirmed by thermal analysis using thermogravimetric and differential thermal analysis (TGA/DTA) of Perkin Elmer STA 6000 with TG sensitivity of 0.2 mg and DTA sensitivity of 0.06 mV.2.5 Adsorption studies
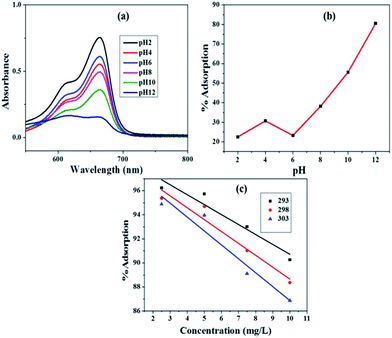
To study adsorption efficiency of Fe3O4@NCQDs NCs for representative methyl blue (MB) dye solution from polluted water, the usual batch adsorption experiments were carried out using a series of conical flask of 100 mL capacity under covered conditions to prevent contamination and removal of dye solution from the flask during stirring. The effects of MB dye concentrations, dosage of Fe3O4@NCQDs NCs adsorbent, contact time, pH and temperature were optimized by varying one variable while all other parameters kept constant. For isothermal studies, experiments were performed at 293, 298 and 303 K with various initial MB dye concentrations and optimum dosage of adsorbent, contact time and pH. The kinetic experiments were performed at optimum dosage, temperature, pH and dye concentrations at constant time intervals. In the procedure, 100 mL of 10 ppm dye solution was taken in flask and 50 mg of adsorbent added and stirred at 293 K temperature. After certain time (t) of adsorption, adsorbent was separated from solution using external magnet and the unadsorbed MB concentration in the solution was determined using a UV-Vis spectrophotometer at λmax of 664 nm. The MB uptake and percentage adsorption were calculated using eqn (1) and (2).| Qe = (C0 − Ce) × V/m | (1) |
| % Adsorption = ((C0 − Ce)/C0) × 100% | (2) |
3 Results and discussion
3.1 Synthesis and characterization
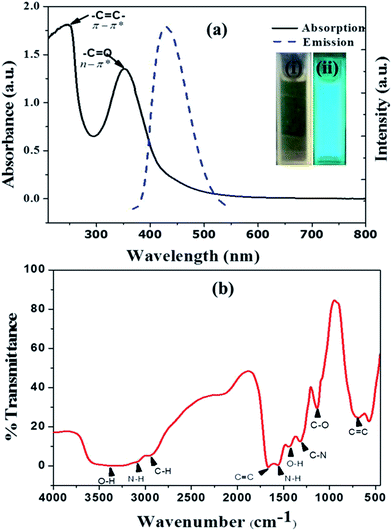
Fluorescent and highly water soluble nitrogen doped carbon quantum dots (NCQDs) were synthesized by hydrothermal method using lemon juice as precursor and ethylenediamine as coreagent (ESI: Fig. ESI1†). In the process, the chemicals present in lemon juice such as citric acid and ascorbic acid undergoes carbonization forming amorphous graphitic carbon dots and then doped and functionalized by ethylenediamine to form NCQDs. The prepared NCQDs exhibits two typical absorption peaks at 245 nm and 353 nm as shown in Fig. 1a (black solid line) which extended with tail to visible region. The first absorption peak at 245 nm could be assigned to π – π* transition of aromatic –C![[double bond, length as m-dash]](https://www.rsc.org/images/entities/char_e001.gif) C– bonds in the sp2 hybridized domain of graphitic core and the other peak at 353 nm could be assigned to n – π* transition of –C
C– bonds in the sp2 hybridized domain of graphitic core and the other peak at 353 nm could be assigned to n – π* transition of –C![[double bond, length as m-dash]](https://www.rsc.org/images/entities/char_e001.gif) O, C–N, or –C–OH bonds which may be from hydroxyl (–COOH) or amine (–NH2) groups on surface of NCQDs.29 The brown yellowish aqueous solution of NCQDs appears brilliant blue under ultraviolet irradiation (inset in Fig. 1(ii)) which indicate the bright luminescence of the prepared NCQDs. In Fig. 1a (blue broken line) indicate the emission spectra of the blue luminescent NCQDs; excitation at 360 nm and emission at 452 nm.
O, C–N, or –C–OH bonds which may be from hydroxyl (–COOH) or amine (–NH2) groups on surface of NCQDs.29 The brown yellowish aqueous solution of NCQDs appears brilliant blue under ultraviolet irradiation (inset in Fig. 1(ii)) which indicate the bright luminescence of the prepared NCQDs. In Fig. 1a (blue broken line) indicate the emission spectra of the blue luminescent NCQDs; excitation at 360 nm and emission at 452 nm.
Information regarding the surface functional group of NCQDs was investigated by Fourier transform infrared spectroscopy (FTIR). As can be seen in the spectrum (Fig. 1b), there are characteristic bands which can indicate the presence of C–O bond, OH, aliphatic C–H, N–H and C–N functional groups. The high water solubility of the NCQDs is as a result of these different functional groups on the surface.30–32
The morphological properties of NCQDs were confirmed by TEM (Fig. 2a)and as the result indicated, the NCQDs particles are well uniformly distributed quasi-spherical nanoparticles with narrow size distribution in diameter range of 2–9 nm with an average of 5.5 nm based on statistical analysis of more than 90 dots (Fig. 2b). The holes in the selected area electron diffraction (SAED) of the NCQDs (inset in Fig. 2 (a)) indicated the particle formation and only two bright spots observed showing the amorphous nature. Paper sheet layer like FESEM image in Fig. 2c confirmed the amorphous nature of NCQDs. Result from elemental composition analysis of EDS spectrum (Fig. ESI3a†) reveal the presence of C, O and N in the as synthesized material indicating well formation of nitrogen doped carbon quantum dots. X-ray diffraction (XRD) patterns show broad intense diffraction peak centered at 2θ = 23° and weak peak at 2θ = 42° which assigned to (002) and (101) diffraction pattern of graphitic carbon, as shown in Fig. 2d which indicates the amorphous nature of the NCQDs.33,34
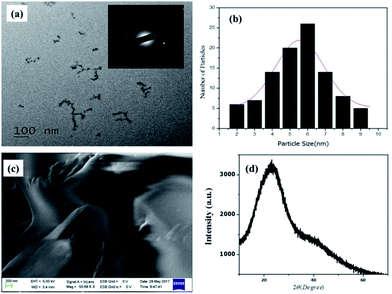 | ||
| Fig. 2 (a) TEM image (inset SAED) (b) histogram of particle size distribution), (c) FESEM image, (d) XRD of NCQDs. | ||
The functional group on NCQDs can play key role in preparing Fe3O4@NCQDs NCs via coprecipitation method, the presence of NCQDs avoid nucleation stage of coprecipitation and hence aggregation free nanocomposite formed.
A possible plausible formation mechanism of Fe3O4@NCQDs NCs via this method is that the carboxylic and amino group on NCQDs chelated with Fe3+ and Fe2+ to form ferric and ferrous complex. In the presence of NaOH, there is also formation of bonds between OH− and (Fe2+, Fe3+). With heating, HO−⋯Fe3+ and OH−⋯Fe2+ bonds dominate over COO−⋯Fe3+ and COO−⋯Fe2+ bonds, and as a result ferric hydroxide, Fe(OH)3 and ferrous hydroxide, Fe(OH)2 formed. Ferric hydroxide and ferrous hydroxide dehydrated forming magnetite (Fe3O4) nanoparticle crystals upon heating. The carboxyl and amino group of NCQDs are attached on Fe3O4 NPs surface through chelation to iron ions. To effectively form Fe3O4@NCQD NCs, amino and carbonyl functional groups on surface of NCQDs interact with COO−⋯Fe3+ and COO−⋯Fe2+ through electrostatic interaction by forming bidentate coordinate covalent bond. As a result stable, relatively aggregate free and uniform sizes Fe3O4@NCQDs NCs were formed.
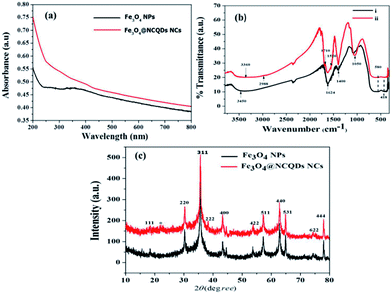
Fig. 3a shows the UV-visible absorption spectra of Fe3O4@NCQDs NCs and Fe3O4 NPs. The UV-visible spectrum show a broad absorption peak at 350 nm which extended to near IR region, which is primarily due to absorption and scattering of light by Fe3O4 NPs.14 The strong absorption peak around 200 nm for Fe3O4@NCQDs NCs ascribed to π – π* transition of NCQDs, which indicates effective combining of Fe3O4 NPs and NCQDs.
The FTIR spectra of Fe3O4@NCQDs NCs synthesised using different proportion of NCQDs depicted in Fig. 3b. FTIR spectra show broad overlapping band around 3360 cm−1, which can be attributed to the ν (O–H) and ν (N–H) stretching vibration of the hydroxyl and amine group of NCQDs. The band at 1050 cm−1 ascribed to the presence of an alcoholic C – O stretching.35 The bands at 1624 cm−1 and 1400 cm−1 are ascribed to asymmetric (νas) and symmetric (νs) stretching of the COO− respectively.36 The band at 1624 cm−1 is also due to the N – H bending mode of the amine group coupling with the νas C – O. The energy difference (Δν) between the νas (COO−) and vs (COO−) IR bands can reveal the interaction between the carboxylate head and the metal atom.37 The Δv (1624−1400 = 224 cm−1) is ascribed to bridging and bidentate coordination, where the interaction between the COO− group and the Fe atom was covalent.38 The characteristic absorption peaks for Fe3O4 NPs were observed at 580 cm−1 and 418 cm−1 which ascribed to the stretching vibrations of Fe2+ – O and Fe3+ – O bonds for Fe3O4 NPs respectively.39
The crystallite structure of the as prepared NCQDs, Fe3O4 NPs and Fe3O4@NCQDs NCs were determined by using X-ray diffraction (XRD) technique. Fig. 3d shows the XRD pattern of Fe3O4 NPs and Fe3O4@NCQDs NCs. The XRD peaks at 2θ of 18.48°, 30.32°, 35.64°, 38.36°, 43.38°, 53.76°, 57.32°, 62.78°, 64.88°, 74.30° and 77.98° correspond to the diffraction crystallite planes of (111), (220), (311), (222), (400), (422), (511), (440), (530), (622) and (444) respectively in which all peaks indexed to the inverse spinal phase of magnetite (JCPDS file, no. 19-0629). In addition to Fe3O4 NPs patterns, in the XRD pattern of Fe3O4@NCQDs NCs (Fig. 3c), there is an additional weak peak at 22.64° which is characteristic of graphitic NCQDs and can be indexed to the (002) reflection indicating good binding of Fe3O4 NPs and NCQDs in formation of Fe3O4@NCQDs NCs. The sharp and strong peaks indicate high crystallinity of the as synthesized Fe3O4@NCQDs NCs.40
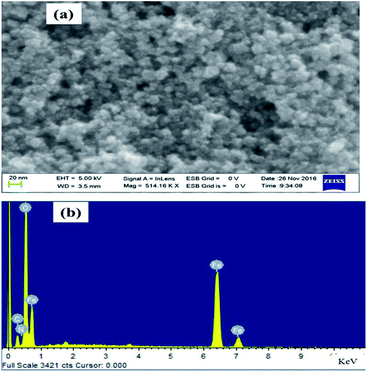
Morphological study of the synthesised Fe3O4@NCQDs NCs was investigated using FESEM and TEM. As depicted in Fig. 4, FESEM images clearly showed that the Fe3O4@NCQDs NCs have nearly spherical shape with uniform distribution. The presence of iron (Fe), oxygen (O), carbon(C) and nitrogen (N) in EDS spectrum confirms the successful formation of Fe3O4@NCQDs NCs.
The representative TEM images of Fe3O4@NCQDs NCs were presented in Fig. 5a and b. It is clear from TEM images that Fe3O4@NCQDs NCs have spherical shape without any aggregation. The particle size distribution of the as synthesized nanocomposites is shown in histogram (Fig. 5d) and the calculated average particle size based on over 100 particles is 5 nm. In addition, crystalline diffraction rings from the selected area diffraction (SEAD) patterns (Fig. 5c) demonstrated that the crystalline nature of the as prepared Fe3O4@NCQDs NCs. The inset in Fig. 5a obtained from HRTEM indicates the lattice space (0.44 nm) which is comparable to XRD results.
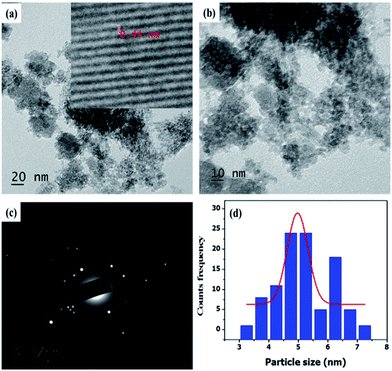 | ||
| Fig. 5 (a and b) Representative TEM images (c) SAED and (d) particle size distribution of Fe3O4@NCQDs NCs. | ||
3.2 Optimization of adsorption parameters
3.3 Isotherm modelling of adsorption
The adsorption data were analyzed by fitting to isotherm models that are Langmuir, Freundlich and Temkin. The isotherm experiments were carried out at 293, 298 and 303 K with 100 mL MB solution of 2.5–10 mg L−1 concentrations, at solution pH 11.0 and adsorbent dosage of 0.5 g L−1.| Ce/Qe = Ce/Q0 + 1/Q0b | (3) |
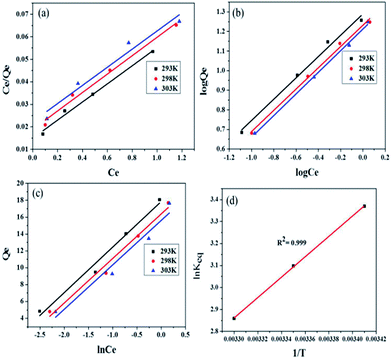 | ||
| Fig. 8 (a) Langmuir adsorption isotherm plot (b) Freundlich adsorption isotherm plot (c) Temkin adsorption isotherm plot (d) thermodynamic plot of MB dye adsorption onto Fe3O4@NCQDs NCs. | ||
A separation factor which also known as dimensionless equilibrium parameter, RL and its value indicates the adsorption nature: unfavorable if RL > 1, linear if RL = 1, favourable if 0 < RL < 1.44 RL was calculated using the following equation:
| RL = 1/(1 + bCe) | (4) |
The calculated value of RL at 293, 298 and 303 K are 0.436, 0.428 and 0.414, respectively, indicating the suitability of Fe3O4@NCQDs NCs for adsorption of MB dye solution from waste water.
| Qe = KFCe1/n | (5) |
log![[thin space (1/6-em)]](https://www.rsc.org/images/entities/char_2009.gif) Qe = log Qe = log![[thin space (1/6-em)]](https://www.rsc.org/images/entities/char_2009.gif) KF + 1/n(log KF + 1/n(log![[thin space (1/6-em)]](https://www.rsc.org/images/entities/char_2009.gif) Ce) Ce)
| (6) |
Freundlich constants, KF (adsorption capacity), and n (adsorption intensity) calculated from the slopes and intercepts of the Freundlich plots, log![[thin space (1/6-em)]](https://www.rsc.org/images/entities/char_2009.gif) Qe vs. log
Qe vs. log![[thin space (1/6-em)]](https://www.rsc.org/images/entities/char_2009.gif) Ce (Fig. 8b). Magnitude of ‘KF’ can be taken as a relative measure of adsorption capacity of Fe3O4@NCQDs NCs for the adsorption of MB. The Freundlich constant n (intensity of adsorption) varies with the heterogeneity of the adsorbent and for favourable adsorption ‘n’ values should be in the range 1–10.46,47
Ce (Fig. 8b). Magnitude of ‘KF’ can be taken as a relative measure of adsorption capacity of Fe3O4@NCQDs NCs for the adsorption of MB. The Freundlich constant n (intensity of adsorption) varies with the heterogeneity of the adsorbent and for favourable adsorption ‘n’ values should be in the range 1–10.46,47
The values of Freundlich constant ‘n’ at 293, 298 and 303 K were 1.838, 1.842, and 1.811 are higher than unity suggesting feasibility of adsorption of MB onto the surface of Fe3O4@NCQDs NCs. The values of ‘KF’ were 19.491, 17.069 and 16.317 mg g−1, which clearly showed that ‘KF’ decreased slightly from 293 to 303 K, indicating the decrease in the adsorption capacity at higher temperature. This is in agreement with Langmuir isotherm observations. The regression coefficients were more close to unity as compared to that of Langmuir isotherm showing better fitting of the Freundlich model, which suggest adsorption of MB onto heterogeneous Fe3O4@NCQDs NCs surface.
Qe = RT/bT(ln![[thin space (1/6-em)]](https://www.rsc.org/images/entities/char_2009.gif) AT + ln AT + ln![[thin space (1/6-em)]](https://www.rsc.org/images/entities/char_2009.gif) Ce) Ce)
| (7) |
The plot of Qe vs. ln![[thin space (1/6-em)]](https://www.rsc.org/images/entities/char_2009.gif) Ce is shown in Fig. 9c. The constants ‘bT’ and ‘AT’ were calculated from the slope and intercept of the plot, respectively, and are listed in ESI: Table ESI1† along with regression coefficients. High magnitudes of ‘AT’ and ‘bT” indicated high interactions between MB and adsorbent. Therefore, the process might be chemisorption. The values of R2 were well close to the unity showing good fitting of the adsorption data to Temkin isotherm model.
Ce is shown in Fig. 9c. The constants ‘bT’ and ‘AT’ were calculated from the slope and intercept of the plot, respectively, and are listed in ESI: Table ESI1† along with regression coefficients. High magnitudes of ‘AT’ and ‘bT” indicated high interactions between MB and adsorbent. Therefore, the process might be chemisorption. The values of R2 were well close to the unity showing good fitting of the adsorption data to Temkin isotherm model.
3.4 Thermodynamic studies of adsorption
Thermodynamic studies are used to describe any reaction in a better way. In this work, thermodynamic studies were performed and the thermodynamic parameters (ΔG°, ΔH°, and ΔS°) were determined at 293, 298 and 303 K temperature using the equations:| Keq = Qe/Ce | (8) |
ΔG° = −RT![[thin space (1/6-em)]](https://www.rsc.org/images/entities/char_2009.gif) ln ln![[thin space (1/6-em)]](https://www.rsc.org/images/entities/char_2009.gif) Keq Keq
| (9) |
ln![[thin space (1/6-em)]](https://www.rsc.org/images/entities/char_2009.gif) Keq = −ΔH°/RT + ΔS°/R Keq = −ΔH°/RT + ΔS°/R
| (10) |
![[thin space (1/6-em)]](https://www.rsc.org/images/entities/char_2009.gif) Keq vs. 1/T, respectively (Fig. 8d). Negative values of ΔG° indicated spontaneity and feasibility while negative values of entropy change ΔS° and enthalpy change ΔH° indicated the exothermic nature of adsorption of MB dye solution onto Fe3O4@NCQDs NCs.
Keq vs. 1/T, respectively (Fig. 8d). Negative values of ΔG° indicated spontaneity and feasibility while negative values of entropy change ΔS° and enthalpy change ΔH° indicated the exothermic nature of adsorption of MB dye solution onto Fe3O4@NCQDs NCs.
3.5 Kinetics and mechanism of MB dye adsorption studies onto Fe3O4@NCQDs NCs
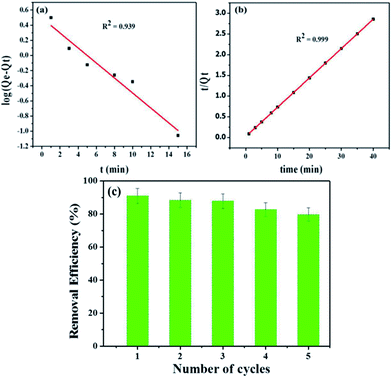
The kinetics of adsorption which shows the rate of transport of the dye from solution to the surface of adsorbent was investigated by pseudo-first-order and pseudo-second order kinetic models.Linearized mathematical form of pseudo-first order model50
log(Qe − Qt) = log![[thin space (1/6-em)]](https://www.rsc.org/images/entities/char_2009.gif) Qe − (k1/2.303) × t Qe − (k1/2.303) × t
| (11) |
Linearized mathematical form of pseudo-second order model51
| t/Qt = 1/h + t/Qe | (12) |
According to the values of correlation coefficient and Qe(calc.) (ESI: Table ESI3†) and Fig. 9b, the pseudo-second order model is found to be more suitable to describe the adsorption kinetic data than the pseudo-first order model for adsorption of MB dye onto Fe3O4@NCQDs NCs. Hence, it has been confirmed that the adsorption process follows pseudo-second order kinetic behaviour.
3.6 Recyclability of adsorbent
Fe3O4@NCQDs NCs was used as adsorbent for removal of MB from aqueous solution. The used Fe3O4@NCQDs NCs can be easily separated from solution at end of application using external magnet. Recyclability of the Fe3O4@NCQDs NCs in MB removal was tested for 5 times and the results are depicted in Fig. 9c. The desorption process of MB was conducted by adjusting pH to 2 using 0.1 M HCl to remove MB form surface of Fe3O4@NCQDs NCs, then washing with acetone. The regenerated Fe3O4@NCQDs NCs adsorbent was used to evaluate the reusability of the Fe3O4@NCQDs NCs for adsorption times. The removal efficiency for the first time 90.8% decreases to 79.2% at the fifth cycle. Our results suggested that the Fe3O4@NCQDs NCs can be reused over 5 times.4 Conclusion
In conclusion, we have developed a cost effective method to prepare spherical shaped Fe3O4@NCQDs NCs using lemon extract as precursor. Superparamagnetic Fe3O4@NCQDs NCs have spherical morphology with an average particle size of 5 nm. Fe3O4@NCQDs NCs were used as adsorbent removal of MB dye pollutant from aqueous solution. Batch adsorption experiments showed enhanced rapid removal of MB dye within 20 minutes with adsorption efficiency of about 90.84% at optimum conditions. The adsorption data showed good fitting to Freundlich with R2 of 0.993 at 298 K temperature. The Freundlich constant ‘n’ value at 298 K was 1.842 which suggested the feasibility of adsorption of MB onto the surface of Fe3O4@NCQDs NCs. Thermodynamic studies indicated the spontaneity and exothermic nature of the adsorption process. From kinetics study, it was found that, the pseudo-second order model is more suitable to describe the adsorption kinetic data than the pseudo-first order model for adsorption of MB dye onto Fe3O4@NCQDs NCs.Conflicts of interest
There are no conflicts to declare.Acknowledgements
The authors are grateful for the support of the Ministry of Education, Federal Democratic Republic of Ethiopia and Adama Science and Technology University. We are also grateful to Dr P.Shyamala, Department of PNCO, Andhra University for PL studies. Thanks also go to Department of Inorganic and Analytical Chemistry, Andhra University (UGC, India- No. F.540/18/DesI/2016(SaI-1) and DST-FIST-India(5R/FIST/CSI-241/2012(C).References
- Z. Jabbar, A. Angham and G. Hadi Ferdoos Sami, Orient. J. Chem., 2014, 30, 571–575 CrossRef
.
- D. Kaušpėdienė, A. Gefenienė, E. Kazlauskienė, R. Ragauskas and A. Selskienė, Water, Air, Soil Pollut., 2013, 224, 24 CrossRef
.
- A. Fouda, S. Hassan, M. Azab and E. Saied, Br. Biotechnol. J., 2016, 15, 1–18 CrossRef
.
- S. H. Lin and M. L. Chen, Desalination, 1997, 109, 121–130 CrossRef CAS
.
- K. Shen and M. A. Gondal, J. Saudi Chem. Soc., 2017, 21, S120–S127 CrossRef CAS
.
- M. F. Abid, M. A. Zablouk and A. M. Abid-Alameer, Iran. J. Environ. Health Sci. Eng., 2012, 9, 17 CrossRef PubMed
.
- G. E. Üstün, S. K. A. Solmaz and A. Birgül, Resour., Conserv. Recycl., 2007, 52, 425–440 CrossRef
.
- P. K. Malik, J. Hazard. Mater., 2004, 113, 81–88 CrossRef CAS PubMed
.
- N. P. Raval, P. U. Shah and N. K. Shah, Appl. Water Sci., 2017, 7, 3407–3445 CrossRef CAS
.
- R. Weissleder, D. D. Stark, B. L. Engelstad, B. R. Bacon, C. C. Compton, D. L. White, P. Jacobs and J. Lewis, AJR, Am. J. Roentgenol., 1989, 152, 167–173 CrossRef CAS PubMed
.
- K. Buyukhatipoglu, T. A. Miller and A. M. Clyne, in Biomedical and Biotechnology Engineering, vol. 2, 2008 Search PubMed
.
- C. Thammawong, P. Opaprakasit, P. Tangboriboonrat and P. Sreearunothai, J. Nanopart. Res., 2013, 15, 1689 CrossRef
.
- E. Y. Jomma and S.-N. Ding, Sensors, 2016, 16, 243 CrossRef PubMed
.
- P. J. Vikesland, R. L. Rebodos, J. Y. Bottero, J. Rose and A. Masion, Environ. Sci.: Nano, 2016, 3, 567–577 RSC
.
- A.-H. Lu, E. L. Salabas and F. Schüth, Angew. Chem., Int. Ed. Engl., 2007, 46, 1222–1244 CrossRef CAS PubMed
.
- I. Ali, Z. A. AL-Othman and A. Alwarthan, J. Mol. Liq., 2016, 219, 858–864 CrossRef CAS
.
- N. Belachew, D. Rama Devi and K. Basavaiah, J. Exp. Nanosci., 2017, 1–15 Search PubMed
.
- W. Shen, M. Shi, M. Wang and H. Chen, Mater. Chem. Phys., 2010, 122, 588–594 CrossRef CAS
.
- X. Liu, Q. Hu, Z. Fang, X. Zhang and B. Zhang, Langmuir, 2009, 25, 3–8 CrossRef CAS PubMed
.
- A. K. Mishra and S. Ramaprabhu, Energy Environ. Sci., 2011, 4, 889–895 CAS
.
- L. Ai, C. Zhang, F. Liao, Y. Wang, M. Li, L. Meng and J. Jiang, J. Hazard. Mater., 2011, 198, 282–290 CrossRef CAS PubMed
.
- Y.-W. Liu, M.-X. Guan, L. Feng, S.-L. Deng, J.-F. Bao, S.-Y. Xie, Z. Chen, R.-B. Huang and L.-S. Zheng, Nanotechnology, 2013, 24, 025604 CrossRef PubMed
.
- R. Mohammad-Rezaei, H. Razmi, V. Abdollahi and A. A. Matin, Anal. Methods, 2014, 6, 8413–8419 RSC
.
- M. Shen, Y. Yu, G. Fan, G. Chen, Y. M. Jin, W. Tang and W. Jia, Nanoscale Res. Lett., 2014, 9, 296 CrossRef PubMed
.
- K. A. S. Fernando, S. Sahu, Y. Liu, W. K. Lewis, E. A. Guliants, A. Jafariyan, P. Wang, C. E. Bunker and Y.-P. Sun, ACS Appl. Mater. Interfaces, 2015, 7, 8363–8376 CAS
.
- K. Hola, Y. Zhang, Y. Wang, E. P. Giannelis, R. Zboril and A. L. Rogach, Nano Today, 2014, 9, 590–603 CrossRef CAS
.
- M. Amjadi, T. Hallaj, H. Asadollahi, Z. Song, M. de Frutos and N. Hildebrandt, Sens. Actuators, B, 2017, 244, 425–432 CrossRef CAS
.
- S. Zhao, D. Xie, X. Yu, Q. Su, J. Zhang and G. Du, Mater. Lett., 2015, 142, 287–290 CrossRef CAS
.
- A. B. Bourlinos, A. Stassinopoulos, D. Anglos, R. Zboril, M. Karakassides and E. P. Giannelis, Small, 2008, 4, 455–458 CrossRef CAS PubMed
.
- Z. Yan, J. Shu, Y. Yu, Z. Zhang, Z. Liu and J. Chen, Luminescence, 2015, 30, 388–392 CrossRef CAS PubMed
.
- X. T. Zheng, A. Ananthanarayanan, K. Q. Luo and P. Chen, Small, 2015, 11, 1620–1636 CrossRef CAS PubMed
.
- Z.-X. Wang and S.-N. Ding, Anal. Chem., 2014, 86, 7436–7445 CrossRef CAS PubMed
.
- A. Hao, X. Guo, Q. Wu, Y. Sun, C. Cong and W. Liu, J. Lumin., 2016, 170, 90–96 CrossRef CAS
.
- Q.-Y. Cai, J. Li, J. Ge, L. Zhang, Y.-L. Hu, Z.-H. Li and L.-B. Qu, Biosens. Bioelectron., 2015, 72, 31–36 CrossRef CAS PubMed
.
- N. Song, X.-L. Wu, S. Zhong, H. Lin and J.-R. Chen, J. Mol. Liq., 2015, 212, 63–69 CrossRef CAS
.
- H. Gupta, P. Paul, N. Kumar, S. Baxi and D. P. Das, J. Colloid Interface Sci., 2014, 430, 221–228 CrossRef CAS PubMed
.
- N. Belachew, D. Rama Devi and K. Basavaiah, J. Mol. Liq., 2016, 224, 713–720 CrossRef CAS
.
- F. Ozel and H. Kockar, J. Supercond. Novel Magn., 2016, 30, 2023–2027 CrossRef
.
- A. Akhundi and A. Habibi-Yangjeh, Mater. Chem. Phys., 2016, 174, 59–69 CrossRef CAS
.
- R. P. Araújo-Neto, E. L. Silva-Freitas, J. F. Carvalho, T. R. F. Pontes, K. L. Silva, I. H. M. Damasceno, E. S. T. Egito, A. L. Dantas, M. A. Morales and A. S. Carriço, J. Magn. Magn. Mater., 2014, 364, 72–79 CrossRef
.
- A. A. Inyinbor, F. A. Adekola and G. A. Olatunji, Water Resources and Industry, 2016, 15, 14–27 CrossRef
.
- I. Langmuir, J. Am. Chem. Soc., 1916, 38, 2221–2295 CrossRef CAS
.
- G. Crini and P.-M. Badot, Sorption Processes and Pollution: Conventional and Non-conventional Sorbents for Pollutant Removal from Wastewaters, Presses Univ. Franche-Comté, 2010 Search PubMed
.
- C.-J. Sun, L.-Z. Sun and X.-X. Sun, Ind. Eng. Chem. Res., 2013, 52, 14251–14260 CrossRef CAS
.
- W. Rogers and M. Sclar, J. Phys. Chem., 1931, 36, 2284–2291 CrossRef
.
- T. A. Khan, S. A. Chaudhry and I. Ali, J. Mol. Liq., 2015, 202, 165–175 CrossRef CAS
.
- T. K. Saha, J. Water Resour. Prot., 2010, 02, 898–906 CrossRef CAS
.
- A. O. Dada, A. P. Olalekan, A. M. Olatunya and O. Dada, IOSR J. Appl. Chem., 2012, 3, 38–45 CrossRef
.
- R. R. Sheha and E. Metwally, J. Hazard. Mater., 2007, 143, 354–361 CrossRef CAS PubMed
.
- J.-P. Simonin, Chem. Eng. J., 2016, 300, 254–263 CrossRef CAS
.
- Y. S. Ho and G. McKay, Process Biochem., 1999, 34, 451–465 CrossRef CAS
.
Footnote |
| † Electronic supplementary information (ESI) available: Emission spectra of NCQDs, EDS and TGA/DTA data, magnetization curve, tables for isotherm parameters, thermodynamic and kinetic data. See DOI: 10.1039/c8ra00158h |
| This journal is © The Royal Society of Chemistry 2018 |

