 Open Access Article
Electromagnetic and microwave absorption characteristics of PMMA composites filled with a nanoporous resorcinol formaldehyde based carbon aerogel
A. Abolghasemi Mahania,
S. Motahari *a and
V. Nayyeri
 b
b
aSchool of Chemical Engineering, Faculty of Engineering, University of Tehran, P. O. Box: 11365/4563, Tehran, Iran. E-mail: a.m.abolghasemi@ut.ac.ir; smotahari@ut.ac.ir
bAntenna and Microwave Research Laboratory, Iran University of Science and Technology, Tehran, Iran. E-mail: nayyeri@iust.ac.ir
First published on 19th March 2018
Abstract
Nanostructured carbons have opened up new perspectives in fields of electromagnetic (EM) applications. The present study aims at the processing of microwave absorbing (MA) materials based on carbon aerogels (CAs) in polymethyl methacrylate (PMMA) matrix to be used in X-band frequency. CAs were synthesized by carbonization of a sol–gel derived organic gel from resorcinol and formaldehyde as starting materials. Microwave attenuation properties of the prepared composites were investigated in terms of CAs particle size distribution (PSD) and mass fraction. To do so, the optimal PSD was initially determined by assessing the EM attenuation performance of the CAs/PMMA composites with constant mass loading (10 wt%) and differing particle sizes. Next, the EM properties of the selected CAs with the optimal particle size was measured as a function of mass fraction varying from 1 to 15 wt% in order to obtain a highly efficient CAs based MA. The results indicate that the dielectric loss of CAs composites can be enhanced by optimizing the PSD as well as the mass fraction of CAs. The effective absorption bandwidth of composites containing 10 wt% of CAs exceeded 3.7 GHz at a very thin thickness of 1.9 mm indicating that these materials present advantages as microwave absorbers.
Introduction
During the current decade, with the rapid developments in information technology, electromagnetic (EM) wave radiation is drawing global attention as a new source of pollution.1,2 To eliminate adverse electromagnetic radiation in healthcare and electronic circuit's performance, much attention has been paid to the development of highly efficient microwave absorber (MA) materials.3–6According to the microwave absorption theory, MA can be divided into dielectric and magnetic loss materials.4 In this regard, solid particles such as ferrites, ceramics, and their hybrids are conventional materials widely utilized as MA constituents. However, high density, poor chemical stability, narrow frequency band absorption, and high loading content are the main drawbacks hindering practical applications of the above-mentioned materials. Hence, to overcome such problems, special efforts have been devoted to the development and utilization of new alternatives as lightweight and broadband MA.4,7–13
Typically, broadband dielectric loss composites containing carbon fillers such as carbon black, carbon fibers, carbon nanotubes as well as porous carbons exhibits significant performance as MA. This is due to their special features including chemical resistivity, lightweight, and tunable absorbing characteristics.8,14–17 Recently, special efforts have been made to use of porous carbons as efficient MA due to their high specific surface area, porosity, polarizability and multiple scattering properties. Structural properties, chemical functionality as well as particle size distribution (PSD) are some special intrinsic characteristics having the dominant effect on the electromagnetic properties of these types of absorbents.4,8,18–21 For example, Huang et al.22 investigated the effect of pore texture of sol–gel derived resorcinol-furfural on EM characteristics of the mesoporous carbons. It was concluded that the synthesized porous carbons with a cage-like structure exhibited interesting electromagnetic properties in terms of the real and imaginary parts of the permittivity. Du et al.23 examined the carbonization temperature on the electromagnetic absorption properties of the ordered mesoporous carbons in K band frequency. They found that the pyrolyzed mesoporous carbons at 650 °C demonstrated a considerable reflection loss of −27 dB at 16.1 GHz. Li et al.24 studied the electromagnetic absorption properties of CNF and porous-CNF composites. The results confirmed that the composite containing 6 wt% of porous CNF exhibited the maximum reflection loss of −31 dB at 9.7 GHz. As yet another example, Yin et al.19 reported a successful method in the preparation of mesoporous carbon hollow microspheres (PCHMs) with enhancement in electromagnetic absorption. They found that a composite containing 20 wt% PCHMs demonstrated a competitive electromagnetic absorption performance in the X band frequency.
Carbon aerogels (CAs) are low-density nano/micro-porous materials, consisting of continuous porosities accompanied by the ordered assembly of carbon particles. Generally, this type of materials produced by carbonization of sol–gel derived organic precursors.25,26 They are used in many various engineering applications such as super thermal insulation, hydrogen storage, catalyst applications, and electrochemical double-layer capacitors. High porosity (>80%), large surface area (400–2700 m2 g−1) and tunable structural characteristics are their valuable intrinsic properties.25–28 Hence, special efforts have been made to modulate the synthesis and processing conditions to tune the CAs structures for their target applications. Among the large variety of CAs precursors, resorcinol formaldehyde (RF) aerogels are still the primary commercial source to produce CAs.29 Concerning the electrical application point of view, a great deal of attention has been paid to investigating and synthesizing high performance 3D interconnected RF-based CAs as targeting materials.30–32 However, restricted information exists on the EM wave absorbing properties of RF-based CAs.
The present study aims at producing RF-based CAs as X-band MA components. The samples are synthesized by carbonization of sol–gel derived RF aerogel at 950 °C under argon (Ar) atmosphere. The influences of PSD and mass fraction are investigated on dielectric and microwave characteristics of the corresponding CAs/PMMA composites. The electromagnetic characterization of CA composites was specified via transmission/reflection line method in the X-band frequency. Initially, the optimal PSD determined by investigating the effective EM attenuation performance, maximum absorption bandwidth below −10 dB, of the prepared CAs/PMMA composites sharing the same mass loading but different particle sizes. Next, in order to assess the impact of filler content on the MA performance of CAs, the EM attenuation properties of the selected CAs were measured as a function of mass fraction ranging from 1 to 15 wt%. With the best knowledge of the authors, this is the first study about the comprehensive investigation of the effects of PSD and mass fraction on electromagnetic and X-band microwave absorption performance of mesoporous resorcinol formaldehyde based carbon aerogel/PMMA composites.
Experimental
Materials
All chemicals including resorcinol (∼99%), formaldehyde (37% wt), as starting materials, methyl methacrylate (MMA) and sodium carbonate, as polymer matrix precursor and catalyst, respectively, were purchased from Merck (Merck Chemical Co) and used without extra purification. Deionized water was used as solvent.Sample preparation
The organic RF aerogel was prepared by reaction between resorcinol and formaldehyde under basic condition. In a typical procedure, 5 g resorcinol (0.0454 mol) was dissolved in 16.882 g (0.93 mol) of distilled water. After mixing and homogenizing with 9.74 g (0.68 mol) of 37 wt% aqueous formaldehyde, the prepared solution was mixed with 0.954 g of sodium carbonate solution with the molarity of 0.0119. The final solution was stirred for 30 min and poured into glass vials which were then sealed and cured at 60 °C for 2 days for the purpose of both gelation and the aging of the wet gels. Over the period of 2 days, the initially colorless solution became dark red when the RF wet gel formed. To dry and control the exerted capillary pressure, the samples with 180 ml of water were placed in a stainless steel vessel. The insulated system was heated gradually to reach the elevated temperature and pressure of 200 °C and 16 bar, respectively, followed by a sudden drop in system pressure. Under such condition, the vessel pressure reached the atmospheric pressure at constant temperature (200 °C). Through this operation, RF aerogels with lower degree of shrinkage can be produced.The carbonization process of the RF aerogel was conducted as follows: the samples were placed in an electrical ceramic type furnace and heated from ambient temperature to 600 °C under Ar atmosphere at a heating rate of 7 °C min−1. Then the samples were heated to 950 °C at a heating rate of 3 °C min−1 with no delay. Finally, the samples were held at 950 °C for 2 h and then the furnace was cooled down to room temperature naturally under the inert condition. Finally, the synthesized CAs were ground into the fine particles using a planetary ball mill. The PSD of the samples was controlled by variation of milling time from 1 to 6 h and the samples were named as Gr-n, in which n represents the grinding time in h. For the purpose of dielectric characterization, the prepared CAs was dispersed in a MMA monomer with the help of an ultrasonic bath and a magnetic stirrer. Then, CAs/MMA monomer mixtures were casted into a rectangular shaped mold with a certain size fitting the waveguide dimensions (i.e. 0.4 × 0.9 inch2) and cured in an oven for 12 h. The optimal PSD was determined by investigating the EM attenuation performance of the prepared CAs/PMMA composites in term of maximum effective absorption bandwidth. After that, CAS with the optimal PSD was selected for further experiments in order to specify the most effective weight percent. At this stage, composites with different load of CAs from 1 to 15 wt% were prepared and examined.
Characterization methods
The characterization of the as-prepared CA powders was specified by implementing various techniques. The graphitization level of the prepared CAs was investigated by X-ray diffraction method (X'Pert MPD, Philips, Holland, using Cu-Kα radiation). Chemical bond formation in prepared samples were studied by FTIR spectroscopy under transmittance mode, in the range of 400–4000 cm−1 using (Bruker Equinox 55LS 101 series, Germany). Morphology study of the CAs samples was conducted using FE-SEM (TESCAN, MIRA3 LMH/LMU). The PSD of CAs was evaluated by Fritsch particle size analyzer (MERC, Germany). The measurement of specific surface areas and pore analysis of CAs were performed at 77 K by nitrogen (N2) physisorption on a BELSORP-mini II (Bell Japan Inc.) analyzer. The microwave absorbing performances of CA composites were evaluated on an Agilent E8362B vector network analyzer in the X-band frequency region. The porosity percentage of the prepared CAs was measured using the following formula33,34 and found to be 82%.where ρa and ρs are apparent (bulk) and skeletal density of the aerogels, respectively. The skeletal density was measured by helium pycnometer (HelPyc Che-1701, Omid Petro Energy Khavaran CO) and found to be 1.831 (g cm−3). The apparent densities of the CAs were evaluated by calculating the ratio of the measured mass to unit volume of the carbons.
Electromagnetic considerations
In this research, the electromagnetic and reflection loss properties of CAs composites are calculated according to transmission line theory and the perfect electric conductor (PEC) model, respectively. As implied by the model, wave impedance at the interface of air/absorber is expressed by the following equation;8,35,36
 | (1) |
 | (2) |
The dip in RL indicates higher absorption ability of EM wave at a certain frequency for a particular sample thickness.
It is well known that, the thickness of EM absorbers is a determining factor to both the position and intensity of the maximum RL.4 Hence, in this research the thickness of samples is optimized based on geometrical effect for simplicity of comparison. Under geometrical effect, microwave absorbers show their maximum absorption loss, which is ascribed to the thickness of absorber (tm) when the following equation is satisfied;4,24,38
 | (3) |
Results and discussions
Pore texture analysis
The nitrogen adsorption–desorption isotherms as well as pore size distributions for the grinded CAs samples are shown in Fig. 1. As illustrated, the sorption isotherm shows a rapid rise at low relative pressures, which then gets horizontal plateau at higher relative pressures. According to IUPAC classification this behavior is characteristic of type I isotherm, which confirms that during carbonization, micropores were developed in the CAs.39,40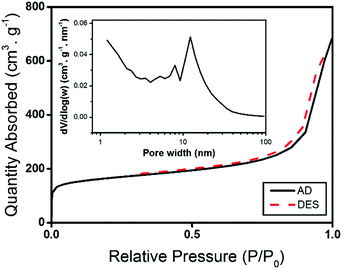 | ||
| Fig. 1 Effect of grinding on textural properties of CAs (nitrogen adsorption–desorption isotherms as well as pore size distribution analysis). | ||
Adsorption–desorption isotherms of the CAs also exhibits a type-IV IUPAC with hysteresis loop of type-H3. This type of hysteresis loop with the out-of-level N2 adsorption at high relative pressures (P/P0 = 0.99) is characteristic of capillary condensation in mesoporous structures, as well as the plate-like particles which give rise to slit-shaped pores.39,41,42 This finding is further proved by estimated pore size distribution from BJH method.
Pore size distribution of CAs is evaluated by BJH method, which is present in the inset of Fig. 1. As depicted, in all samples a broad pore size distribution from micro to mesopore size is observed, which is varying from 1 to 40 nm and not distributed uniformly. Main pore sizes in CAs were found to be 1 and 40 nm, which is indicative of micro and mesopore size, respectively. Similarity of the pore size distribution for the samples grinded in different time is an evidence confirming that grinding time does not affect the pore texture of CAs.
The variation of specific surface areas of the samples as a function of grinding time is tabulated in Table 1. Although increasing of grinding time creates smaller grains, it does not affect total specific surface area significantly. Specific surface area of CAs increased about 10% from 561 to 618 (m2 g−1) when the grinding time varied from 1 to 6 h, respectively.
| Sample | Surface area (m2 g−1) |
|---|---|
| RF aerogel | 370 |
| Gr-1 | 561 |
| Gr-2 | 587 |
| Gr-4 | 610 |
| Gr-6 | 618 |
Morphology study and particle size analysis
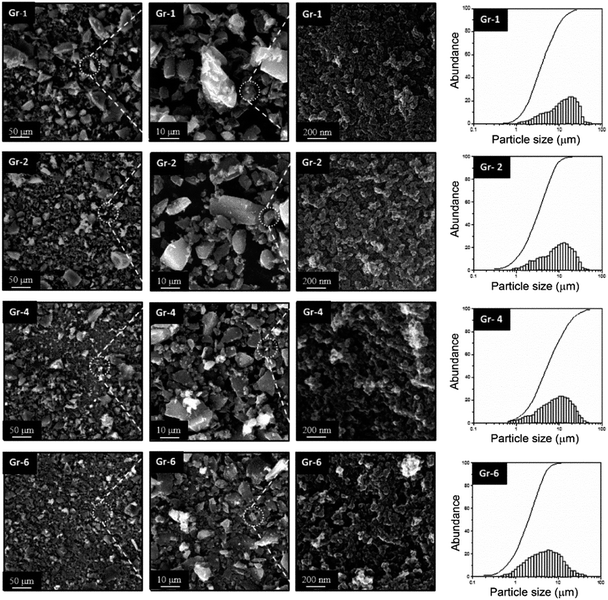
Effect of grinding time on morphology and PSD of the prepared CAs is illustrated in FE-SEM graph (Fig. 2). The FE-SEM micrographs confirmed that the porous CAs are made of interconnected nano-metric particles. The average particle size is calculated using analytical method and found to be ∼43.5 nm under the spherical shape assumption of carbon particles. The observed pore size values were also consistent with pore size distribution of N2 physisorption measurements.The structural observation revealed that all grinded CAs have highly ordered 3D porous structure with the same values of pores and particle sizes. On the other hand, as indicated in BET and BJH analysis, morphology observation revealed that, pore characteristic of CAs was not affected by grinding process.
The PSD analysis from CAs samples also confirms what the SEM graphs show. PSD of the samples decreases while the grinding time increases. As illustrated in Fig. 2 the amount of the particles with PSD below 10 μm are 45%, 63%, 74% and 82% in the samples grinded for 1, 2, 4 and 6 h, respectively.
The observed pore size values were also consistent with pore size distribution of N2 physisorption measurements. The structural observation revealed that all grinded CAs have highly ordered 3D porous structure with the same values of pores and particle sizes. On the other hand, as indicated in BET and BJH analysis, morphology observation revealed that, pore characteristic of CAs was not affected by grinding process. The PSD analysis from CAs samples also confirms what the SEM graphs show. PSD of the samples decreases while the grinding time increases. As illustrated in Fig. 2 the amount of the particles with PSD below 10 μm are 45%, 63%, 74% and 82% in the samples grinded for 1, 2, 4 and 6 h, respectively.
XRD Analysis
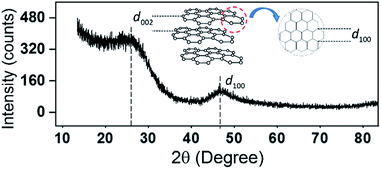
In order to study the development of crystallinity in CAs, the XRD analysis was carried out and the results is presented in Fig. 3. Since all XRD patterns of CAs are similar to each other, here only one of them is presented as an example. The two broad peaks positioned at 2θ = 24° and 42° correspond to the reflections of (002) and (100) planes of graphite, respectively.22,29,35 Since the peak intensity of d002 plane in CAs is weak, it is concluded that the CAs structure consists of low degree of crystallinity.FTIR analysis
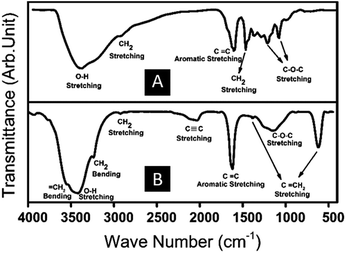
FTIR spectroscopy is used to study surface chemistry and the changes in chemical functional groups during the pyrolysis of RF aerogel. The FTIR spectra of RF aerogel and corresponding CAs are shown in Fig. 4a and Fig. 4b, respectively. Since all FTIR spectra of the grinded CAs are similar to each other, here only one of them is presented. The broad peak at 3422 cm−1 corresponds to the –OH group on the resorcinol ring in RF aerogel. The peaks at 1460 and 2925 cm−1 are related to the stretching vibration of CH2 groups. The peak at 1614 cm−1 also corresponds to the benzene ring stretching. The observed peaks at 1091 and 1220 cm−1 confirm the stretching of C–O–C linkage between resorcinol molecules which is created during sol–gel reaction.43–45 As shown in Fig. 4b pyrolysis process has a crucial effect on the chemical nature of the original RF aerogel.For example, the hydroxyl peak characteristic at 3422 cm−1 becomes more intensive and a new peak can be observed at 3553 cm−1.
These significant changes in hydroxyl group intensity and a new peak at 3553 cm−1 may originated from the thermal decomposition of C–O–C linkage and formation of ![[double bond, length as m-dash]](https://www.rsc.org/images/entities/char_e001.gif) CH2 and CH2OH chemical bonds, respectively. This is further supported by the observed new intense peak in CAs at 660 and 1383 cm−1 due to the presence of C
CH2 and CH2OH chemical bonds, respectively. This is further supported by the observed new intense peak in CAs at 660 and 1383 cm−1 due to the presence of C![[double bond, length as m-dash]](https://www.rsc.org/images/entities/char_e001.gif) CH2 groups that are not visible in FTIR spectra of RF aerogel. As shown in Fig. 4b, weak and broad peak in the wave number region from 1098–1367 is characteristic of C–O–C linkage, implying that some linkages are intact during pyrolysis. The observed weak peak at 3238 cm−1 is indicative of bending vibration of C–H. The new observed peak at 2198 cm−1 can be attributed to –C
CH2 groups that are not visible in FTIR spectra of RF aerogel. As shown in Fig. 4b, weak and broad peak in the wave number region from 1098–1367 is characteristic of C–O–C linkage, implying that some linkages are intact during pyrolysis. The observed weak peak at 3238 cm−1 is indicative of bending vibration of C–H. The new observed peak at 2198 cm−1 can be attributed to –C![[triple bond, length as m-dash]](https://www.rsc.org/images/entities/char_e002.gif) C– bonds which means that some benzene rings are broken under the heating process and new C
C– bonds which means that some benzene rings are broken under the heating process and new C![[triple bond, length as m-dash]](https://www.rsc.org/images/entities/char_e002.gif) C bonds are formed at the broken ends. Finally, presence of an intensive aromatic peak at 1614 cm−1 implies that the chemical structure of the prepared CAs are uniformly composed of benzene ring arrangement.43–47
C bonds are formed at the broken ends. Finally, presence of an intensive aromatic peak at 1614 cm−1 implies that the chemical structure of the prepared CAs are uniformly composed of benzene ring arrangement.43–47
Electromagnetic properties
Fig. 5 illustrates the variation of dielectric constants of the CAs/PMMA composites containing 10 wt% of CAs as a function of frequency and PSD. As can be inferred from Fig. 5, from Gr-1 to Gr-6 samples both imaginary and real parts of permittivity show a relative escalation when the PSD of CAs turns into the finer particles. When the grinding time duration increased from 1 to 6 h, the ε′r values shown a relative 26% rise from 14.4 to 18.16 at 10 GHz. As indicated in Fig. 5, by only enhancing the time duration from 4 to 6 h less variation could be recorded for ε′r (almost 10%). By increasing the grinding time ε′′r also has led to similar alteration as those happening in real part of permittivity. The reason behind such variation in permittivity parameters is closely related to the theoretical density of composite powders and the rule of mixtures. According to theoretical density, when CAs are milled into fine particles the density of the proceeded CAs decreases.7,19 Hence, in composites with the same mass content of CAs, the volume fraction of the prepared CAs with the longer milling time is higher than those proceeded carbons under the shorter milling time. This would lead to a better conductivity in the samples, which in turn enhances the permittivity level.
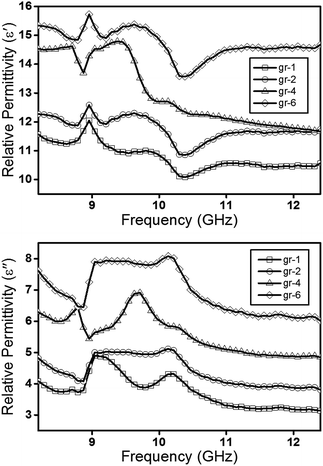 | ||
| Fig. 5 Variation of dielectric constants of the CAs/PMMA composites containing 10 wt% of CAs as a function of frequency and PSD. | ||
It should be noted that, in this research the CAs are dielectric absorbers with no magnetic susceptibility so the values of complex magnetic permeability can be disregarded (i.e. μ′r = 1, μ′′r ≈ 0).
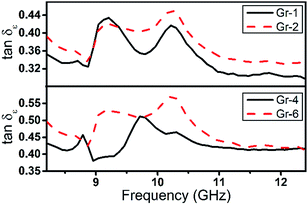
In dielectric absorbers, the dielectric loss tangent (tan![[thin space (1/6-em)]](https://www.rsc.org/images/entities/char_2009.gif) δε = ε′′/ε′) is an important parameter to evaluate the EM attenuation capability of absorber when the permittivity meets the impedance matching requirements.49 The tan
δε = ε′′/ε′) is an important parameter to evaluate the EM attenuation capability of absorber when the permittivity meets the impedance matching requirements.49 The tan![[thin space (1/6-em)]](https://www.rsc.org/images/entities/char_2009.gif) δε of CAs composites were calculated based on the real and imaginary parts of permittivity and shown in Fig. 6. The tan
δε of CAs composites were calculated based on the real and imaginary parts of permittivity and shown in Fig. 6. The tan![[thin space (1/6-em)]](https://www.rsc.org/images/entities/char_2009.gif) δε of samples exhibited nonlinear behavior with bimodal characteristic. The positions where tan
δε of samples exhibited nonlinear behavior with bimodal characteristic. The positions where tan![[thin space (1/6-em)]](https://www.rsc.org/images/entities/char_2009.gif) δε fluctuations occur are exactly similar to the resonance peaks of ε′′r, which is attributed to interfacial polarization.50 The values of tan
δε fluctuations occur are exactly similar to the resonance peaks of ε′′r, which is attributed to interfacial polarization.50 The values of tan![[thin space (1/6-em)]](https://www.rsc.org/images/entities/char_2009.gif) δε increased gradually from 0.36 to 0.55, at 10 GHz, as the milling time increased from 1 to 6 h.
δε increased gradually from 0.36 to 0.55, at 10 GHz, as the milling time increased from 1 to 6 h.
 | (4) |
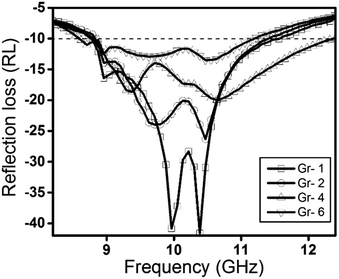 | ||
| Fig. 7 Minimum RL of the composites containing 10 wt% CAs as a function of frequency and milling time. | ||
To investigate the effect of filler content on MA performance of the prepared composites, the dielectric and electromagnetic and attenuation characteristics of CAs/PMMA composites were measured as function of CAs mass loading. For this purpose, desire amounts of Gr-4 samples, as CAs with the widest effective absorption wide band, were mixed with PMMA monomer to prepare composites with varied mass fractions of CAs from 1 to 15 wt%. As shown in Fig. 8, both ε′r and ε′′r of the CAs composites increased gradually and reached a maximum as the mass loading of CAs increased from 1 wt% to 15 wt%. It is worth mentioning that by increasing CAs mass fraction solely from 5 to 7 wt%, the values for ε′r and ε′′r parameters exhibited a sudden rise from 8 and 1.5 (at 10 GHz) to 11.2 and 4.3, respectively. Meanwhile, further increase in CAs mass fraction lead to less significant enhancement of the aforementioned parameter values. The sudden rise in the values of ε′r and ε′′r might be due to reaching the electrical percolation point in CAs composites along with the formation of a 3D conductivity network in PMMA matrix.56–58 Beside other parameters influencing attenuation property of EM waves, reaching electrical percolation can significantly increase conduction loss in composites filled with CAs particles and in turn promote the ε′′r value significantly (∼190%).
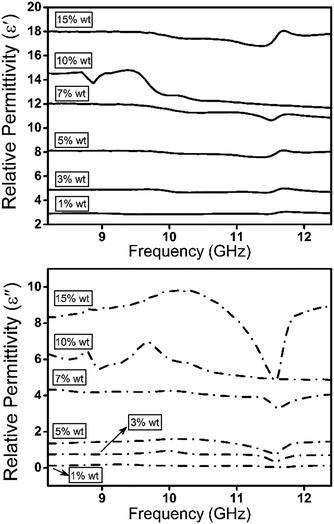 | ||
| Fig. 8 Variation of dielectric constants of the CAs/PMMA composites as a function of frequency and CAs mass loading. | ||
Fig. 9, illustrates the RL of the prepared composites with different CAs content. As shown in Fig. 9, when the composites are combined with the low content of CAs, the corresponding composites show weak RL. On the contrary, by increase in CAs content, RL values show the enhanced attenuation performance especially when the CAs content reach the mass fraction level of 7 wt% or higher, which is corresponding to the electrical percolation point. As revealed in Fig. 9, maximum RL of composites improved from −0.6 to −48 dB when the CAs mass fraction varied from 1 to 7 wt% and declined to −10.8 dB (at 10 GHz) when CAs mass loading varied from 7 to 15 wt%. As mentioned previously, materials with a higher value of ε′′r suggest enhanced overall EM losses, which induce higher attenuation characteristic. However, as presented in Fig. 9, relative to the composite containing 7 wt% of CAS, prepared composites under the excessive mass fraction of CAs from 7 wt% possess weaker absorbing capability.
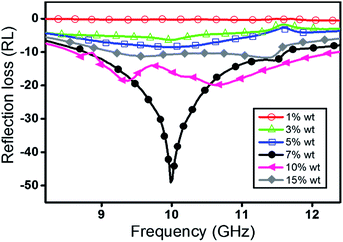 | ||
| Fig. 9 Variation of minimum reflection loss for the prepared CAs/PMMA composites as a function of frequency and CAs mass loading. | ||
On the other hand, when the mass fraction of CAs increases from 7 to 15 wt% the RL of the CAs composites decreases from −48 to −10.8 dB (at 10 GHz). To explain this behavior, impedance matching of the composites is another key factor to estimate the EM absorption performance, which should be balanced between the medium of propagation and absorber surface. The impedance matching level of CAs composites containing different content of CAs can be calculated in the following equation and is presented in Fig. 10;59–61
| Δ = |sinh2(Kfd) − M| | (5) |
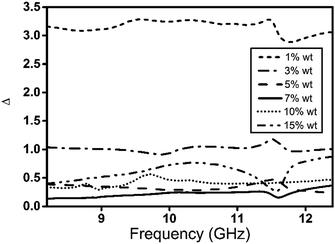 | ||
| Fig. 10 Variation of Δ value for the prepared CAs/PMMA composites as a function of frequency and CAs mass loading. | ||
As revealed in Fig. 10, when CAs contents increased from 1 to 7 wt% the Δ value decreased from 3.25 to the minimum value of 0.22 (at 10 GHz) implying better impedance matching in CAs/PMMA composites. On the contrary, the value of Δ for composites containing 10 and 15 wt% of CAs increased again to a maximum of 0.72, which implies poor impedance matching. Under such conditions, a strong reflection of EM wave occurs when the EM waves meet the surface of the absorber, which would restrict the absorption of EM waves inside the absorber.
It should be noted that impedance mismatching is also another reason for decreasing the RL of CAs composites, when the CAs particles proceeded under longer milling time (see Fig. 7).
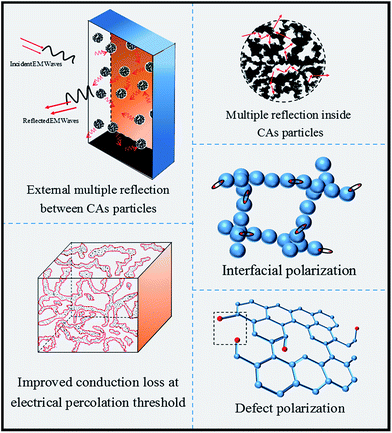
To better understanding the reason for high attenuation performance in CAs composites, Fig. 11, illustrates the possible absorption mechanisms of EM waves in the prepared samples. Firstly, when the EM waves retract into the CAs composites, the external multiple reflections accompanied with the conduction loss are the primary attenuation mechanisms of the prepared composites. Formation of a conductive network at percolation threshold improves MA performance of CAs composites by migration and hopping the electrons through the composites. Secondly, presence of pores in CAs can cause multiple reflection and scattering of EM waves inside the CAs particles which would in turn prolong the travelling path of EM waves and transforming more EM energy into heat. Besides multiple scattering and conduction loss mechanisms, polarization is also another important factor for excellent MA ability of CAs composites. In case of CAs, interfacial polarization occurs due to the existence of multiple interfaces and the difference in electrical conductivity between carbon particles–PMMA, carbon–carbon clusters, and the carbon particles-trapped air in the pores. Moreover, nanoporous structure of CAs with high specific surface area could dramatically increase the probability of polarization. High specific surface area of CAs causes the formation of more defects in the pore walls and thus brings more interface polarization.
Table 2, reflects a comparison between the prepared CAs composites and the recently reported porous carbon-based composites. It is well known that, effective absorption gap accompanied with RL are the most important parameters for microwave absorbers. The excellent MA performance of CAs composites is closely related to the well-tuned dielectric characteristics as well as the synergetic effect of CAs morphology. Formation of CAs with such porous characteristic accompanied with formation of conductive network enhanced the MA properties of CAs composites in terms of absorption intensity and effective bandwidth.
| Type of filler | Filler loading | Optimal thickness [mm] | Frequency band | Maximum RL [dB] | Absorption bandwidth [GHz] | Ref. |
|---|---|---|---|---|---|---|
| CAs | 7 wt% | 2.2 | X | ∼48 | 3.7 | This study |
| Porous carbon fiber | 6 wt% | 2.4 | X | ∼30 | 3.2 | 24 |
| Walnut shell-derived nano-porous carbon | 70 wt% | 2 | X | 42.5 | 1.76 | 52 |
| 3D MWCNT/graphene hybrid | 2 wt% | 2 | X | 26 | 1.6 | 50 |
| 3D graphene-coated Fe nanocomposites | 40 wt% | 2.5 | X | ∼28 | ∼4 | 5 |
| Co3O4/porous graphitic carbon nanosheets | 50 wt% | 2.1 | X | 32 | 3.4 | 62 |
| Carbon fiber/nano-Fe2O3 3D structure | 25 wt% | 2 | X | 11 | 2 | 63 |
Conclusion
In this series of experiments, dielectric and MA characteristics of sol–gel derived RF based CAs/PMMA composites was investigated as a function of PSD and CAs mass loading. The provided data suggest that both PSD and filler content play dominant role in tuning EM absorption performance of CAs composites. The prepared CAs composites exhibit superior performance at a lower mass loading, thickness and broadband absorption characteristic. Combination of the above properties indicates a promising perspective for the implementation of CAs composites to development of lightweight high performance MA. The impedance matching condition and RL of the composites were improved by tuning the addition amount of CAs due to the enhancement of interfacial polarization, dipolar polarization and formation of conductive network. It can be concluded from the results that at constant mass loading of 10 wt% the Gr-1 sample displays the strongest microwave absorbing capability of ∼−42 dB at 10 GHz while Gr-4 sample shows the widest effective absorption bandwidth of 3.7 GHz (from 8.5 to 11.5 GHz) with RL less than −10 dB.Conflicts of interest
There are no conflicts to declare.References
- G. Redlarski, B. Lewczuk, A. Żak, A. Koncicki, M. Krawczuk, J. Piechocki, K. Jakubiuk, P. Tojza, J. Jaworski, D. Ambroziak, Ł. Skarbek and D. Gradolewski, BioMed Res. Int., 2015, 2015, 1–18 CrossRef PubMed.
- D. Soghomonyan, K. Trchounian and A. Trchounian, Appl. Microbiol. Biotechnol., 2016, 100, 4761–4771 CrossRef CAS PubMed.
- C. Hu, Z. Mou, G. Lu, N. Chen, Z. Dong, M. Hu and L. Qu, Phys. Chem. Chem. Phys., 2013, 15, 13038 RSC.
- F. Qin and C. Brosseau, J. Appl. Phys., 2012, 111, 61301 CrossRef.
- X. Zhao, Z. Zhang, L. Wang, K. Xi, Q. Cao, D. Wang, Y. Yang and Y. Du, Sci. Rep., 2013, 3, 3421 CrossRef PubMed.
- G. Sun, B. Dong, M. Cao, B. Wei and C. Hu, Chem. Mater., 2011, 23, 1587–1593 CrossRef CAS.
- X.-J. Zhang, G.-S. Wang, W.-Q. Cao, Y.-Z. Wei, J.-F. Liang, L. Guo and M.-S. Cao, ACS Appl. Mater. Interfaces, 2014, 6, 7471–7478 CAS.
- G. Li, T. Xie, S. Yang, J. Jin and J. Jiang, J. Phys. Chem. C, 2012, 116, 9196–9201 CAS.
- X. F. Zhang, X. L. Dong, H. Huang, B. Lv, J. P. Lei and C. J. Choi, J. Phys. D: Appl. Phys., 2007, 40, 5383–5387 CrossRef CAS.
- B. Wen, M. Cao, M. Lu, W. Cao, H. Shi, J. Liu, X. Wang, H. Jin, X. Fang, W. Wang and J. Yuan, Adv. Mater., 2014, 26, 3484–3489 CrossRef CAS PubMed.
- P. Meng, K. Xiong, K. Ju, S. Li and G. Xu, J. Magn. Magn. Mater., 2015, 385, 407–411 CrossRef CAS.
- Y.-X. Gong, L. Zhen, J.-T. Jiang, C.-Y. Xu, W.-S. Wang and W.-Z. Shao, CrystEngComm, 2011, 13, 6839 RSC.
- R. C. Che, L.-M. Peng, X. F. Duan, Q. Chen and X. L. Liang, Adv. Mater., 2004, 16, 401–405 CrossRef CAS.
- Z. Wang and G.-L. Zhao, Open J. Compos. Mater., 2013, 3, 17–23 CrossRef.
- Y. P. Duan, L. Wang, Z. Liu and S. C. Gu, Plast., Rubber Compos., 2013, 42, 82–87 CrossRef CAS.
- G. Wang, Z. Gao, S. Tang, C. Chen, F. Duan, S. Zhao, S. Lin, Y. Feng, L. Zhou and Y. Qin, ACS Nano, 2012, 6, 11009–11017 CrossRef CAS PubMed.
- O. A. Al-Hartomy, A. A. Al-Ghamdi, F. Al-Salamy, N. Dishovsky, R. Shtarkova, V. Iliev and F. El-Tantawy, Int. J. Mater. Chem., 2012, 2, 116–122 CrossRef.
- Y. Du, T. Liu, B. Yu, H. Gao, P. Xu, J. Wang, X. Wang and X. Han, Mater. Chem. Phys., 2012, 135, 884–891 CrossRef CAS.
- H. Xu, X. Yin, M. Zhu, M. Han, Z. Hou, X. Li, L. Zhang and L. Cheng, ACS Appl. Mater. Interfaces, 2017, 9, 6332–6341 CAS.
- F. Moglie, D. Micheli, S. Laurenzi, M. Marchetti and V. Mariani Primiani, Carbon, 2012, 50, 1972–1980 CrossRef CAS.
- Z. Fang, C. Li, J. Sun, H. Zhang and J. Zhang, Carbon, 2007, 45, 2873–2879 CrossRef CAS.
- Y. Huang, Y. Wang, Z. Li, Z. Yang, C. Shen and C. He, J. Phys. Chem. C, 2014, 118, 26027–26032 CAS.
- Y. Du, T. Liu, B. Yu, H. Gao, P. Xu, J. Wang, X. Wang and X. Han, Mater. Chem. Phys., 2012, 135, 884–891 CrossRef CAS.
- G. Li, T. Xie, S. Yang, J. Jin and J. Jiang, J. Phys. Chem. C, 2012, 116, 9196–9201 CAS.
- J. Fricke and R. Petricevic, in Handbook of Porous Solids, Wiley-VCH Verlag GmbH, Weinheim, Germany, 2008, pp. 2037–2062 Search PubMed.
- M. A. Aegerter, N. Leventis and M. M. Koebel, Advances in Sol-Gel Derived Materials and Technologies, 2011 Search PubMed.
- M. Koebel, A. Rigacci and P. Achard, J. Sol-Gel Sci. Technol., 2012, 63, 315–339 CrossRef CAS.
- A. M. ElKhatat and S. A. Al-Muhtaseb, Adv. Mater., 2011, 23, 2887–2903 CrossRef CAS PubMed.
- S. Chandrasekaran, P. G. Campbell, T. F. Baumann and M. A. Worsley, J. Mater. Res., 2017, 32, 4166–4185 CrossRef CAS.
- A. Borenstein, O. Hanna, R. Attias, S. Luski, T. Brousse and D. Aurbach, J. Mater. Chem. A, 2017, 5, 12653–12672 CAS.
- N. Rey-Raap, A. Arenillas and J. A. Menéndez, in Submicron Porous Materials, Springer International Publishing, Cham, 2017, pp. 25–52 Search PubMed.
- M. J. Crane, M. B. Lim, X. Zhou and P. J. Pauzauskie, Microsyst. Nanoeng., 2017, 3, 17032 CrossRef.
- A. Abolghasemi Mahani, S. Motahari and A. Mohebbi, Mar. Pollut. Bull. DOI:10.1016/j.marpolbul.2017.10.012.
- A. Allahbakhsh and A. R. Bahramian, RSC Adv., 2016, 6, 72777–72790 RSC.
- X. X. C. Zhou and S. Geng, Carbon, 2016, 108, 234–241 CrossRef.
- B. Liu, J. Li, L. Wang, J. Ren and Y. Xu, Composites, Part A, 2017, 97, 141–150 CrossRef CAS.
- Y. Du, W. Liu, R. Qiang, Y. Wang, X. Han, J. Ma and P. Xu, ACS Appl. Mater. Interfaces, 2014, 6, 12997–13006 CAS.
- C. Song, X. Yin, M. Han, X. Li, Z. Hou, L. Zhang and L. Cheng, Carbon, 2017, 116, 50–58 CrossRef CAS.
- M. Kruk and M. Jaroniec, Chem. Mater., 2001, 13, 3169–3183 CrossRef CAS.
- M. Thommes, K. Kaneko, A. V Neimark, J. P. Olivier, F. Rodriguez-Reinoso, J. Rouquerol and K. S. W. Sing, Pure Appl. Chem., 2015, 87, 1051–1069 CrossRef CAS.
- M. Thommes, Chem.-Ing.-Tech., 2010, 82, 1059–1073 CrossRef CAS.
- D. D. Do, E. A. Ustinov and H. D. Do, in Adsorption by Carbons, 2008, pp. 239–271 Search PubMed.
- M. A. Elsayed, P. J. Hall and M. J. Heslop, in Adsorption, 2007, vol. 13, pp. 299–306 Search PubMed.
- Y. Wang, B. Chang, D. Guan and X. Dong, J. Solid State Electrochem., 2015, 19, 1783–1791 CrossRef CAS.
- A. Kobayashi and G. I. Konishi, Molecules, 2009, 14, 364–377 CrossRef CAS PubMed.
- B. Chang, D. Guan, Y. Tian, Z. Yang and X. Dong, J. Hazard. Mater., 2013, 262, 256–264 CrossRef CAS PubMed.
- S. Motahari, B. S. Heidari and G. H. Motlagh, J. Appl. Polym. Sci., 2015, 132(37), 42543 CrossRef.
- T. Zhang, B. Xiao, P. Zhou, L. Xia, G. Wen and H. Zhang, Nanotechnology, 2017, 28, 35 Search PubMed.
- W. Xie, X. Zhu, S. Yi, J. Kuang, H. Cheng, W. Tang and Y. Deng, Mater. Des., 2016, 90, 38–46 CrossRef CAS.
- L. Ding, A. Zhang, H. Lu, Y. Zhang and Y. Zheng, RSC Adv., 2015, 5, 83953–83959 RSC.
- R. Kumar, A. P. Singh, M. Chand, R. P. Pant, R. K. Kotnala, S. K. Dhawan, R. B. Mathur and S. R. Dhakate, RSC Adv., 2014, 4, 23476 RSC.
- X. Qiu, L. Wang, H. Zhu, Y. Guan and Q. Zhang, Nanoscale, 2017, 9, 7408–7418 RSC.
- O. Levy and D. Stroud, Phys. Rev. B, 1997, 56, 8035–8046 CrossRef CAS.
- R. Qiang, Y. Du, Y. Wang, N. Wang, C. Tian, J. Ma, P. Xu and X. Han, Carbon, 2016, 98, 599–606 CrossRef CAS.
- L. Wang, X. Jia, Y. Li, F. Yang, L. Zhang, L. Liu, X. Ren and H. Yang, J. Mater. Chem. A, 2014, 2, 14940 CAS.
- K. Sun, P. Xie and Z. Wang, et al., Polymer, 2017, 125, 50–57 CrossRef CAS.
- H. Bin Zhang, W. G. Zheng, Q. Yan, Z. G. Jiang and Z. Z. Yu, Carbon, 2012, 50, 5117–5125 CrossRef.
- T. Wu, Y. Zhao, Y. Li, W. Wu and G. Tong, ChemCatChem, 2017, 9, 3486–3496 CrossRef CAS.
- Z. Ma, C.-T. Cao, Q.-F. Liu and J.-B. Wang, Chin. Phys. Lett., 2012, 29, 38401 CrossRef.
- J. Jiang, D. Li, D. Geng, J. An, J. He, W. Liu and Z. Zhang, Nanoscale, 2014, 6, 3967–3971 RSC.
- F. Meng, W. Wei, X. Chen, X. Xu, M. Jiang, L. Jun, Y. Wang and Z. Zhou, Phys. Chem. Chem. Phys., 2015, 18, 2510–2516 RSC.
- F. Wen, H. Hou, J. Xiang, X. Zhang, Z. Su, S. Yuan and Z. Liu, Carbon, 2015, 89, 372–377 CrossRef CAS.
- M. Gholampoor, F. Movassagh-Alanagh and H. Salimkhani, Solid State Sci., 2017, 64, 51–61 CrossRef CAS.
| This journal is © The Royal Society of Chemistry 2018 |


