DOI:
10.1039/C8RA00240A
(Paper)
RSC Adv., 2018,
8, 9741-9748
Improving the efficiency of Fenton reactions and their application in the degradation of benzimidazole in wastewater
Received
9th January 2018
, Accepted 19th February 2018
First published on 8th March 2018
Abstract
Reducing the quantity of sludge produced in Fenton reactions can be partly achieved by improving their efficiency. This paper firstly studies the effect of uniform deceleration feeding (ferrous iron and hydrogen peroxide) on the efficiency of a Fenton reaction by measuring the yield of hydroxyl radicals (˙OH) and chemical oxygen demand (COD) removal rate. The dynamic behavior of ˙OH was also investigated. The results indicated that uniform deceleration feeding was the best feeding method compared with one-time feeding and uniform feeding methods when the same amount of Fenton reagents and the same reaction times were used. Besides, it was found the COD removal rate reached 79.3% when this method was applied to degrade 2-(a-hydroxyethyl)benzimidazole (HEBZ); this COD removal rate is larger than those when the other two modes were used (they reached 60.7% and 72.1%, respectively). The degradation pathway of HEBZ was determined using PL, UV-vis, FTIR, HPLC and GC-MS. Ultimately, HEBZ was decomposed into three small molecules (2-hydroxypropylamine, oxalic acid, and 2-hydroxypropamide). This research is of great significance for the application of Fenton reactions in wastewater treatment.
1. Introduction
The Fenton1,2 reaction, as one of the most successful advanced oxidation processes (AOPs),3–9 has attracted great interest in recent years due to its advantages of high performance, procedural simplicity, low cost and low reagent toxicity.10 The reaction is based on the in situ production of hydroxyl radicals (˙OH), which are one of the most reactive free radicals and exhibit non-selective reactivity, with reactive rate constants commonly in the order of 107–1010 M−1 S−1,11 and oxidizing potentials of 2.8 V, second only to fluorine gas.12–14 The Fenton reaction can be applied to degrade a wide range of recalcitrant and toxic pollutants found in pharmaceutical and dye wastewaters,15,16 especially aromatic compounds with electron-donating groups.17 Its efficiency is determined by the amount of ˙OH produced in the process.18
The problem with the Fenton reaction is the large quantity of sludge generated in the process. To overcome this issue, electro-Fenton, photo-Fenton, Fenton-like etc. technologies have been developed. Most electro-Fenton processes were used for dye wastewater treatment,9,19–21 but the process was cumbersome and high-cost, and wasted power. The photo-Fenton process was investigated for its high degradation efficiency,22–24 such as by Carra’s group,25 who dealt with agricultural effluent using the technology, and by Cabrera et al.26 who degraded pyrimethanil in a raceway pond reactor, both achieving relatively high chemical oxygen demand (COD) removal rates. However, all these studies suggested that a long reaction time, low initial COD and high clarity of water were necessary. Recently, Fenton-like processes have attracted far-ranging attention and have been studied extensively. Wang et al.27 used iron(III) and hydrogen peroxide (H2O2) to treat acid black 1 wastewater, and the results indicated that the decolorization rate of the wastewater was similar to that in Fenton processes. Souza’s group28 studied the removal of diclofenac from aqueous solutions at near neutral pH with ferric oxalate complexes, and the results showed that the introduction of C2O42− can promote the recycling of Fe2+ and Fe3+ and broaden the pH range. Yongkoo and Iraj29 investigated the oxidation of chlorinated ethylenes in soil solution systems using a citric acid-modified Fenton reaction, and proved that this process was beneficial for the degradation of pollutants. However, these Fenton-like processes had some grave drawbacks, such as being time-consuming due to the low reaction rate, increasing the value of COD for the addition of complexes, and the difficulty of removing the iron complexes, as well as the lack of flocculation of Fe(OH)3, which greatly reduces the COD value etc. All the above drawbacks limited the application of Fenton-like processes in wastewater treatment. Therefore, it is still of great significance to improve the efficiency of Fenton reactions.
In recent years, some groups have made efforts to improve the efficiency of Fenton reactions. Hui Zhang’s group30 and Yoo et al.31 disposed of landfill leachate using batch feedings of Fenton’s reagent. Likewise, Yang Deng et al.32 treated leachate with stepwise addition of H2O2, when Fe2+ was added at once. All these studies proved that the feeding method can affect the removal rate of organic matter (RH).33 In our previous work, a ME (micro-electrolysis)-Fenton process34 was used to treat high concentration pesticide wastewater when only H2O2 was added at a slow and uniform rate. The results suggested that the COD removal rate was well improved.
2-(a-Hydroxyethyl)benzimidazole (HEBZ), with an electron-rich benzene ring and a heterocycle coupling structure as an intermediate, is widely found in pharmaceutical and dye wastewater (Fig. 1).35 Since it is difficult to degrade due to its very stable chemical structure, it has brought some negative effects on the environment and human health. Fenton reactions are ideally suitable for degrading HEBZ in wastewater, based on its structural properties. Herein, we first utilized a deceleration feeding mode in the Fenton process and researched its effect on the degradation efficiency of HEBZ in wastewater, by measuring the yield of hydroxyl radicals (˙OH) and the COD removal rate, and comparing these with those from one-time feeding and uniform feeding methods. The dynamic behaviour and total amount of ˙OH, as well as the Fe2+ and H2O2 concentrations over time, were investigated for these feeding modes. At the same time, UV-vis absorption spectroscopy (UV-vis), photoluminescence spectroscopy (PL), Fourier transform infrared spectroscopy (FTIR), high performance liquid phase chromatography (HPLC), and gas chromatography mass spectrometry (GC-MS) were used to explore the degradation pathway of HEBZ in the optimal feeding mode.
 |
| | Fig. 1 The structure of 2-(a-hydroxyethyl)benzimidazole. | |
2. Materials and methods
2.1. Materials
2-(a-Hydroxyethyl)benzimidazole (HEBZ, 19018-24-7, 98%), FeSO4·7H2O (AR, 99.0 ∼ 101.0%), H2O2 (AR, 30%, w/v), methylene blue (BS), and titanium oxalate potassium (AR, 98%) were purchased from Aladdin. The pH value of the wastewater in each test was adjusted using H2SO4 (Adamas, AR, 98%) solutions. The initial pH and COD value of the simulated wastewater were 3 and 3555 mg L−1, respectively.
2.2. Experimental set-up
The Fenton process was performed in a magnetically stirred Fenton reactor (1.5 L). The simulated wastewater was prepared using HEBZ solid, to give a concentration of 2.5 g L−1. The pH of the wastewater was adjusted to 3.0 using sulfuric acid (H2SO4) and maintained at this value throughout the experiment (this is the optimal pH of our previous experiment). The theoretical H2O2 concentration required for the degradation of HEBZ was calculated using the COD, as shown in eqn (1).36,37| | |
[H2O2] = 34/16(CODHEBZ)
| (1) |
The addition of FeSO4·7H2O was based on a molar ratio of Fe2+ to H2O2 of 1![[thin space (1/6-em)]](https://www.rsc.org/images/entities/char_2009.gif) :
:![[thin space (1/6-em)]](https://www.rsc.org/images/entities/char_2009.gif) 3 (1
3 (1![[thin space (1/6-em)]](https://www.rsc.org/images/entities/char_2009.gif) :
:![[thin space (1/6-em)]](https://www.rsc.org/images/entities/char_2009.gif) 3 is the best molar ratio as determined in the previous experiment). For the three feeding methods the total concentrations of Fe2+ and H2O2 were 3.73 g L−1 and 21.60 mL L−1, respectively. In the first method of feeding, 3.73 g Fe2+ and 21.6 mL H2O2 were added to 1 L HEBZ wastewater at one time; this is denoted one-time feeding. In the second method of feeding, FeSO4·7H2O and H2O2 were added at 0.187 g L−1 min−1 and 1.080 mL L−1 min−1 for 20 min using a uniform auto sampler. In the uniform deceleration feeding method, FeSO4·7H2O and H2O2 were added using the decompression device depicted in Fig. 2 (the initial speed of uniform deceleration feeding and uniform feeding was the same). All the above experiments were performed in triplicate. In addition, PL, UV-vis, FTIR, HPLC and GC-MS were employed to qualitatively characterize the wastewater before and after the Fenton reactions.
3 is the best molar ratio as determined in the previous experiment). For the three feeding methods the total concentrations of Fe2+ and H2O2 were 3.73 g L−1 and 21.60 mL L−1, respectively. In the first method of feeding, 3.73 g Fe2+ and 21.6 mL H2O2 were added to 1 L HEBZ wastewater at one time; this is denoted one-time feeding. In the second method of feeding, FeSO4·7H2O and H2O2 were added at 0.187 g L−1 min−1 and 1.080 mL L−1 min−1 for 20 min using a uniform auto sampler. In the uniform deceleration feeding method, FeSO4·7H2O and H2O2 were added using the decompression device depicted in Fig. 2 (the initial speed of uniform deceleration feeding and uniform feeding was the same). All the above experiments were performed in triplicate. In addition, PL, UV-vis, FTIR, HPLC and GC-MS were employed to qualitatively characterize the wastewater before and after the Fenton reactions.
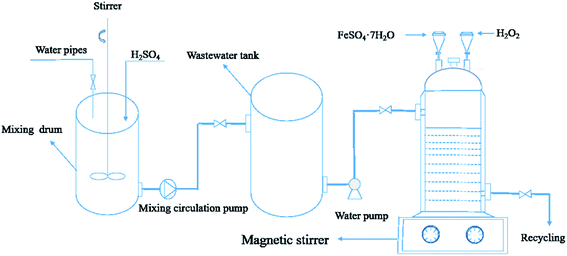 |
| | Fig. 2 A diagram of the uniform deceleration feeding Fenton reaction device. | |
2.3. Analytical methods
The samples were taken out and immediately added to a sample tube containing manganese dioxide, which was employed to stop the reaction as it reacted with H2O2. In order to show the change in COD removal rate over time for the three feeding methods, the COD values at different reaction times during the Fenton processes were compared. The COD values were obtained via standard methods for the examination of wastewater.38 The H2O2 concentrations were measured via a titanium potassium oxalate colorimetric method using a Hitachi U2910 UV-vis spectrometer at a wavelength of 388 nm.39 The Fe2+ concentration was determined via photometric measurement with 1,10-phenanthroline according to ISO 6332 using a UV-vis spectrophotometer (Zuzi 4418PC).40 Quantification of ˙OH was carried out using methylene blue spectrophotometry at 666 nm.41–43 The HEBZ concentration was determined using HPLC (Agilent, Palo Alto, CA) at 240 nm. The mobile phase was a mixture of acetonitrile and water (5/95, v/v) at a flow rate of 1.0 mL min−1. The photoluminescence spectra (PL) were obtained using a FluoroMax-4 fluorescence spectrophotometer (Horiba, USA). The UV-vis absorption spectra were recorded using a Shimadzu UV-2450 spectrophotometer (Tokyo, Japan). The FTIR spectra were obtained using a Nicolet 5700 (USA) IR spectrometer in the range 400–4000 cm−1. Analysis of the target compounds was performed using a GC-MS (Agilent, 7890B GC, 5977A Quadrupole MS) with a HP-5MS analytical column.
3. Results and discussion
3.1. COD removal rate using three different feeding methods in the Fenton reaction
The COD removal rates using the three feeding modes (one-time feeding, uniform feeding, and uniform deceleration feeding) under the same operating conditions (reaction time = 40 min, [H2O2] = 24.0 g L−1, Fe2+/H2O2 (mol mol−1) = 1![[thin space (1/6-em)]](https://www.rsc.org/images/entities/char_2009.gif) :
:![[thin space (1/6-em)]](https://www.rsc.org/images/entities/char_2009.gif) 3, CODinitial = 3555 mg L−1) are shown in Fig. 3. From Fig. 3 we can see that, in the one-time feeding mode (Line I), the COD removal rate increased rapidly in the first 10 min and then became steady during the next 10 min. After 20 min, little change took place and the total COD removal rate of HEBZ was 60.7% at 40 min. In the uniform feeding mode (Line II), when both Fe2+ and H2O2 were added equably at a low speed, the COD removal rate raised evenly in the first 20 min and then more slowly during the next 10 min. What was noteworthy was that the COD removal rate exceeded that of the one-time feeding mode at 15 min. After 30 min, the COD removal rate became stable and eventually reached 72.1%, which is 11.4% higher than that of the one-time feeding mode. In the uniform deceleration feeding mode (Line III), when both Fe2+ and H2O2 were introduced at a decreasing rate, the COD removal rate rose persistently in the initial 30 min and then the growth became smooth. Notably, the COD removal rate surpassed that of the uniform feeding mode in 23 min and ultimately reached 79.3%, which is 18.6% higher than that of the one-time feeding mode. The above results suggested that the feeding method had a big effect on the degradation of HEBZ and that uniform deceleration feeding was the best feeding mode, which may be related to the non-reactive oxidation of Fe2+, H2O2 self-decomposition,31,44 and the quenching of ˙OH.
3, CODinitial = 3555 mg L−1) are shown in Fig. 3. From Fig. 3 we can see that, in the one-time feeding mode (Line I), the COD removal rate increased rapidly in the first 10 min and then became steady during the next 10 min. After 20 min, little change took place and the total COD removal rate of HEBZ was 60.7% at 40 min. In the uniform feeding mode (Line II), when both Fe2+ and H2O2 were added equably at a low speed, the COD removal rate raised evenly in the first 20 min and then more slowly during the next 10 min. What was noteworthy was that the COD removal rate exceeded that of the one-time feeding mode at 15 min. After 30 min, the COD removal rate became stable and eventually reached 72.1%, which is 11.4% higher than that of the one-time feeding mode. In the uniform deceleration feeding mode (Line III), when both Fe2+ and H2O2 were introduced at a decreasing rate, the COD removal rate rose persistently in the initial 30 min and then the growth became smooth. Notably, the COD removal rate surpassed that of the uniform feeding mode in 23 min and ultimately reached 79.3%, which is 18.6% higher than that of the one-time feeding mode. The above results suggested that the feeding method had a big effect on the degradation of HEBZ and that uniform deceleration feeding was the best feeding mode, which may be related to the non-reactive oxidation of Fe2+, H2O2 self-decomposition,31,44 and the quenching of ˙OH.
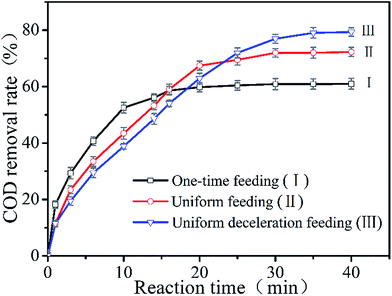 |
| | Fig. 3 The COD removal rate over the reaction time for the different feeding methods (reaction time = 40 min, [H2O2] = 24.0 g L−1, Fe2+/H2O2 (mol mol−1) = 1![[thin space (1/6-em)]](https://www.rsc.org/images/entities/char_2009.gif) : :![[thin space (1/6-em)]](https://www.rsc.org/images/entities/char_2009.gif) 3, CODinitial = 3555 mg L−1). 3, CODinitial = 3555 mg L−1). | |
3.2. Study of the hydroxyl radicals in the three feeding methods in the Fenton reaction
3.2.1 The dynamic behavior of ˙OH in the three feeding methods. In order to illustrate the effect of the feeding mode on the COD removal rate, the dynamic behavior of ˙OH and the concentrations of Fe2+ and H2O2 in the solution were investigated. Fig. 4a shows the evolution of the ˙OH concentration over the reaction time for the three feeding methods of Fe2+ and H2O2. It can be seen that, in the one-time feeding mode (Line I), the concentration of ˙OH sharply grew to a maximum (12.9 μM) in 10 min and the COD removal rate rapidly increased in the corresponding time. Then it continuously decreased to 0 μM and the COD degradation rate was basically unchanged (as shown in Fig. 3). In the uniform feeding mode (Line II), the concentration of ˙OH increased slowly over 1–20 min reaching a maximum (9.1 μM) at 20 min and the COD removal rate was growing equably during this time. Then the degradation rate of COD became steady while the ˙OH concentration quickly reduced to 0 μM. Remarkably, the concentration of ˙OH exceeded that in the one-time feeding mode at 15 min (as shown in Fig. 3). In the uniform deceleration feeding mode (Line III), the ˙OH concentration generated was almost flat over 1–30 min, reaching a maximum (7.9 μM) at 30 min, which indicated that the generation and consumption of ˙OH was approximately equal during the feeding. Then the concentration of ˙OH gradually reduced to 0 μM and the COD removal rate of the whole process grew steadily and rapidly (as shown in Fig. 4a). The above results revealed that the degradation rate of COD was consistent with the concentration of ˙OH, and the ˙OH generated rapidly via the reaction in eqn (2)29,45 was not consumed immediately and accumulated to a maximum. In addition, in the uniform and uniform deceleration feeding modes, the ˙OH concentration would drop promptly once the feeding was terminated because its consumption was greater than the yield. It should be noted that, compared with the other two feeding modes, ˙OH was accumulated very smoothly in the uniform deceleration feeding mode, proving that this method can better control the generation and consumption of ˙OH, thus improving its utilization efficiency. Therefore, reducing excess Fe2+ and H2O2 properly via uniform deceleration feeding can actually improve the efficiency of the Fenton response.| | |
Fe2+ + H2O2 → Fe3+ + ˙OH + OH−
| (2) |
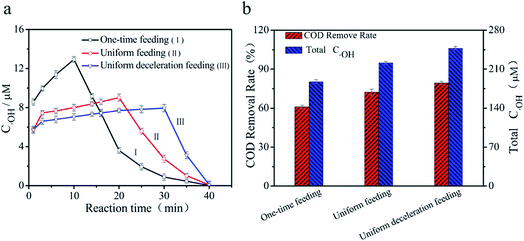 |
| | Fig. 4 (a) The change of ˙OH concentration with the reaction time and (b) the total concentration of ˙OH and the COD removal rate within 40 min for the three feeding methods of Fe2+ and H2O2 (reaction time = 40 min, [H2O2] = 24.0 g L−1, Fe2+/H2O2 (mol mol−1) = 1![[thin space (1/6-em)]](https://www.rsc.org/images/entities/char_2009.gif) : :![[thin space (1/6-em)]](https://www.rsc.org/images/entities/char_2009.gif) 3, CODinitial = 3555 mg L−1). 3, CODinitial = 3555 mg L−1). | |
3.2.2 The total concentration of ˙OH in the three feeding methods. Improving the efficiency of the Fenton reaction can also be studied by monitoring the total amount of ˙OH in the solution. As depicted in Fig. 4b, the total concentration of ˙OH in each feeding method increased in the order of one-time feeding, uniform feeding and uniform deceleration feeding (the total concentration of ˙OH was obtained from the integral area of the polyline in Fig. 4a), and was 187.52 μM, 221.52 μM and 247.77 μM, respectively. The corresponding COD removal rates were 60.7%, 72.1% and 79.3%, respectively. This further verified that the uniform deceleration feeding according to the reaction mechanism may make the best use of ˙OH. This may be attributed to the fact that non-reactive oxidation of Fe2+ and H2O2 self-decomposition34,44 were vastly reduced in this feeding method. In addition, the quenching effects of Fe2+ and H2O2 on ˙OH (through reactions (3) and (4))29,45 and even those between free radicals (through reaction (5)) were effectively weakened.35| | |
˙OH + H2O2 → HO2˙ + H2O
| (3) |
| | |
˙OH + Fe2+ → Fe3+ + OH−
| (4) |
3.2.3 The effect of Fe2+ and H2O2 concentration on ˙OH. As is known, the Fe2+ and H2O2 content has a significant effect on the efficiency of the Fenton reaction, since H2O2 is catalyzed by Fe2+ to produce ˙OH, which oxidizes many pollutants.45 The residual H2O2 and Fe2+ content was investigated in the three feeding modes (Fig. 5). In the one-time feeding mode (Line I), the concentrations of Fe2+ and H2O2 were reduced drastically in the first 10 minutes, therefore, the production of ˙OH was high and the COD removal rate grew faster during this period (as can be seen in Fig. 3 and 4a). After 10 min, the Fe2+ and H2O2 were basically consumed, so the ˙OH concentration was very small and the COD degradation rate was mostly unchanged. In the uniform feeding mode (Line II), the Fe2+ and H2O2 were uniformly consumed in the first 20 min. This indicated that the concentration of ˙OH and the removal rate of COD increased steadily (as seen in Fig. 3 and 4a). With increasing reaction time, the ˙OH concentration decreased quickly and the COD removal rate was essentially unchanged. This suggested that slowing the addition rate of Fe2+ and H2O2 would enhance the utilization efficiency of Fe2+ and H2O2, which may be beneficial to the production of ˙OH and the augmentation of the COD degradation rate. In the uniform deceleration feeding mode (Line III), the remaining Fe2+ and H2O2 content decreased very uniformly within 30 min. Simultaneously, the concentration of ˙OH and the corresponding COD removal rate were growing evenly during the process, indicating that Fe2+ and H2O2 were more effectively used compared to in the uniform feeding mode. Of the two reagents, H2O2 was more critical because it directly affected the theoretical maximum mass of ˙OH generated. Generally, eqn (6) was used to evaluate the efficiency of H2O2 usage in the Fenton processes.35,46| | |
η = 2.12CODoxi/[H2O2]
| (6) |
where η represents the efficiency of H2O2 usage, CODoxi is the COD removed by oxidation, and [H2O2] is the dosage of added peroxide. Table 1 shows that the utilization efficiency of H2O2 was highest in the uniform deceleration feeding mode, and was 99.1% in this mode. This revealed that the self-decomposition of H2O2 could be ignored in this feeding mode. The above analysis proves that the uniform deceleration feeding mode was the best feeding method when a Fenton reaction was used to degrade HEBZ, and immensely enhanced the efficiency of the Fenton reaction. Therefore, the addition rate of the reagents was a very crucial operating parameter in practice and needed to be carefully controlled.
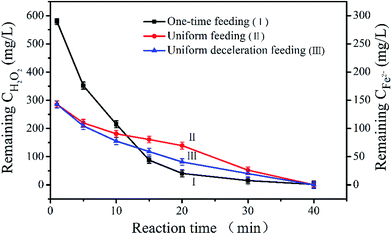 |
| | Fig. 5 Variation of the H2O2 and Fe2+ concentrations during the reaction time in HEBZ wastewater for the three feeding modes (reaction time = 40 min, [H2O2] = 24.0 g L−1, Fe2+/H2O2 (mol mol−1) = 1![[thin space (1/6-em)]](https://www.rsc.org/images/entities/char_2009.gif) : :![[thin space (1/6-em)]](https://www.rsc.org/images/entities/char_2009.gif) 3, CODinitial = 3555 mg L−1). 3, CODinitial = 3555 mg L−1). | |
Table 1 The efficiency of H2O2 usage
| Feeding mode |
One-time feeding |
Uniform feeding |
Uniform deceleration feeding |
| η/% |
78.9 |
96.2 |
99.1 |
3.3. The degradation pathway of HEBZ
In order to investigate the HEBZ degradation pathway in the optimal feeding mode for the Fenton reaction, UV-vis, PL, FTIR, HPLC and GC-MS were performed. Fig. 6a and b show the UV-vis absorption and PL spectra of HEBZ before and after the Fenton reaction with the uniform deceleration feeding mode. The strong and broad absorption peak of HEBZ was mainly in the region 190–290 nm and its corresponding emission peak was located at 370 nm when excited at 300 nm, due to the fused structure of the benzene ring and imidazole heterocyclic ring in HEBZ. The absorption range dramatically shifted to 190–230 nm and the PL emission peak completely disappeared after Fenton treatment. This difference may be attributed to the structural decomposition of HEBZ. Moreover, the absorption peak at 200 nm belongs to carboxylic acid substances, so it can be inferred that the degradation products of HEBZ may contain small molecule carboxylic acids.
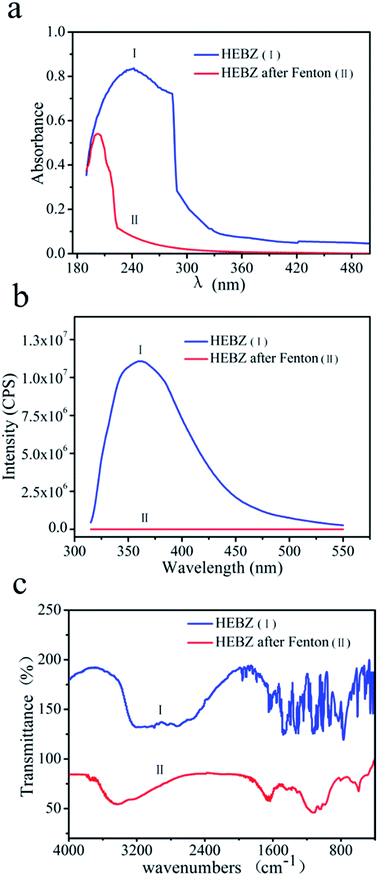 |
| | Fig. 6 UV-vis spectra (a), PL spectra (b) and FTIR spectra (c) of HEBZ wastewater before and after Fenton reaction with the uniform deceleration feeding mode. | |
Additionally, the successful degradation of HEBZ was confirmed by FTIR analysis (Fig. 6c). An absorption peak at 3418 cm−1 appeared and can be attributed to –NH2, implying the fracture of the heterocyclic bond in HEBZ and the production of amides.15 The two bands at 1450 cm−1 and 1600 cm−1 corresponding to the skeleton vibrations of benzene disappeared, further indicating the breakage of the benzene ring skeleton. Furthermore, two new bands at 1040 cm−1 and 1670 cm−1 appeared after the Fenton reaction and were ascribed to the characteristic absorptions of –OH and –C![[double bond, length as m-dash]](https://www.rsc.org/images/entities/char_e001.gif) O, respectively, which suggested alcohols or carboxylic acids might be produced. These results corroborated that the benzene ring and heterocyclic structure of HEBZ were destroyed after the Fenton reaction. In addition, hydramines, amides or carboxylic acids may be generated.
O, respectively, which suggested alcohols or carboxylic acids might be produced. These results corroborated that the benzene ring and heterocyclic structure of HEBZ were destroyed after the Fenton reaction. In addition, hydramines, amides or carboxylic acids may be generated.
To further probe the final degradation products of HEBZ, the HPLC pattern and GC-MS profile before and after the Fenton reaction were investigated (Fig. 7 and 8). As shown in Fig. 7a, the HEBZ concentration varied from 2.5 g L−1 at the beginning, to 0 g L−1 when the Fenton reaction reached 40 min. Fig. 7b also reveals that HEBZ (m/z = 163.1) disappeared completely and could be degraded into three new substances after the Fenton process. From the GC-MS profile in Fig. 8, it could be inferred that the three new substances were 2-hydroxypropylamine (m/z = 75.1), oxalic acid (m/z = 90.03) and 2-hydroxypropamide (m/z = 89.1), which was consistent with the results of UV-vis, PL and FTIR. Moreover, according to the above results, the pathway of a possible degradation mechanism of HEBZ is proposed in Fig. 9. Briefly, when ˙OH attacks the benzene ring of a HEBZ molecule, the bonds may break down to form oxalic acid (the bonds were broken from (1) (2) or (1) (6)). When the imidazole heterocycle of HEBZ was attacked by ˙OH, 2-hydroxypropylamine and 2-hydroxypropamide may be produced (the bonds were broken from (3) (4) and (3) (5)). These small molecules may be easily degraded via biological methods.
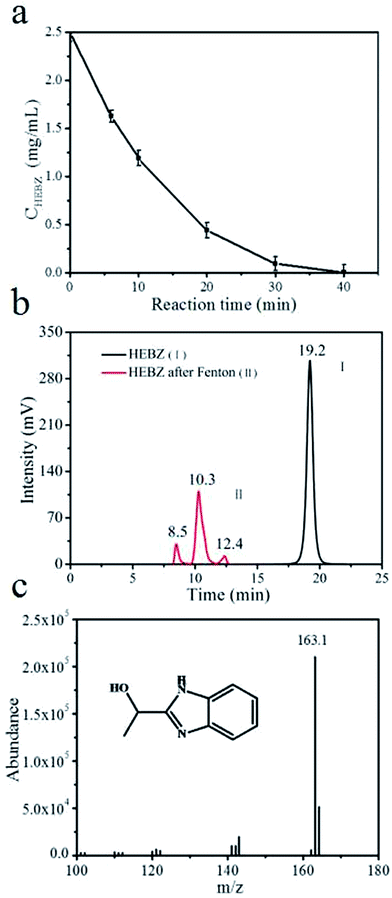 |
| | Fig. 7 (a) The variation of HEBZ concentration over time, (b) the HPLC profiles of HEBZ wastewater before and after Fenton reaction, (c) the MS profile of HEBZ. | |
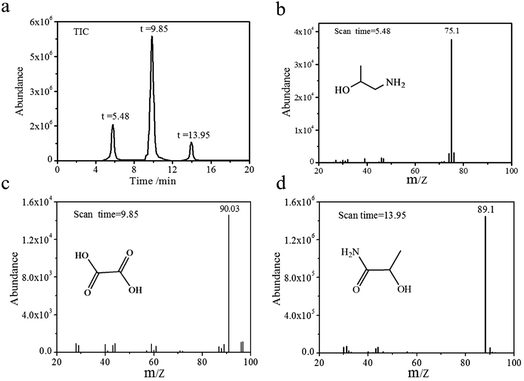 |
| | Fig. 8 GC-MS profile of wastewater containing HEBZ after the Fenton reaction with the uniform deceleration feeding mode, (a) TIC profile, (b) MS profile of 2-hydroxypropylamine, (c) MS profile of oxalic acid, and (d) MS profile of the 2-hydroxypropamide. | |
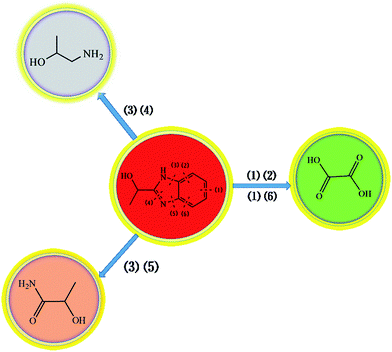 |
| | Fig. 9 The proposed degradation pathway of HEBZ in the Fenton system. | |
4. Conclusions
In this work, the effect of different feeding modes (one-time feeding, uniform feeding and uniform deceleration feeding) on Fenton response efficiency was studied by monitoring the production of ˙OH and the COD removal rate. According to the reaction mechanism, uniform deceleration feeding was the optional feeding method out of these three feeding methods. In this feeding mode, the quantity of ˙OH generated and consumed may be controlled to be roughly the same by slowing the speed at which Fe2+ and H2O2 were added; this greatly reduced the quenching of ˙OH and enhanced its utilization efficiency. With this feeding mode, the total concentration of ˙OH reached a maximum (247.77 μM) and the COD removal rate was also highest (79.3%), which greatly improved the degradation efficiency of HEBZ in wastewater. Notably, the degradation pathway suggested that the Fenton reaction was suitable for dealing with the refractory HEBZ, and HEBZ could eventually be decomposed into 2-hydroxypropylamine, oxalic acid and 2-hydroxypropamide, as determined using UV-vis, PL, FTIR, HPLC and GC-MS analysis. More significantly, these small molecules produced in the Fenton reaction can be degraded easily via biological and various other methods.
Conflicts of interest
There are no conflicts to declare.
Acknowledgements
This work was supported by the National Natural Science Foundation of China under grant number 81571812, and a project funded by the Priority Academic Program Development of Jiangsu Higher Education Institutions (PAPD) under grant number 1107047002.
References
- W. Zhang, X. Yang and D. Wang, Ind. Eng. Chem. Res., 2013, 52, 5765–5771 CrossRef CAS.
- F. Ting, Y. Li and Z. Hui, Ind. Eng. Chem. Res., 2017, 56, 11684–11696 CrossRef.
- O. Legrini, E. Oliveros and A. Braun, Chem. Rev., 1993, 93, 671–698 CrossRef CAS.
- A. Idil, A. Nuray and O. Tugba, Appl. Catal., B, 2010, 96, 208–217 CrossRef.
- R. James, G. Keith and T. Willlam, Appl. Catal., B, 2010, 73, 627–637 Search PubMed.
- I. Arslan-Alaton, T. Olmez-Hanci, B. Gursoy and G. Tureli, Chemosphere, 2009, 76, 587–594 CrossRef CAS PubMed.
- I. Keisuke and G. Mohamed, Ozone: Sci. Eng., 2005, 27, 83–114 CrossRef.
- C. P. Huang and D. Chen, Waste Manage., 1993, 13, 361–377 CrossRef CAS.
- N. N. Rao, G. Bose, P. Khare and S. N. Kaul, J. Environ. Eng., 2006, 132, 367–376 CrossRef CAS.
- S. W. Peng and W. J. Zhang, J. Environ. Sci., 2016, 41, 16–23 CrossRef PubMed.
- J. P. Joseph, O. Esther and M. Allison, Crit. Rev. Environ. Sci. Technol., 2007, 36, 1–84 Search PubMed.
- M. S. Ewa, W. Anna and S. Piotr, J. Hazard. Mater., 2007, 147, 497–502 CrossRef PubMed.
- M. A. Behnajady, N. Modirshahla and F. Ghanbary, J. Hazard. Mater., 2007, 148, 98–102 CrossRef CAS PubMed.
- C. M. Francisca, A. R. Rui and B. Enric, Appl. Catal., B, 2017, 202, 217–267 CrossRef.
- H. Zhou and D. Smith, Can. J. Civ. Eng., 2001, 28, 49–66 CrossRef.
- T. Oppenländer, Photochemical Purification of Water and Air, 2002, pp. 12–30 Search PubMed.
- X. H. Sun, Y. Y. Jia and J. Ma, Technol. Water Treat., 2009, 35, 74–78 CAS.
- C. L. Yap, S. Gan and H. K. Ng, Chemosphere, 2011, 83, 1414–1430 CrossRef CAS PubMed.
- G. Elodie, T. Stephane, L. Claude and A. Mehmet, Environ. Chem. Lett., 2003, 1, 38–44 CrossRef.
- G. A. Abdollah, E. S. H. Zahra and M. A. Bahrami, J. Environ. Chem. Eng., 2017, 5, 2313–2324 CrossRef.
- Z. Yan, M. Gao, S. G. Wang and W. Z. Zhou, Electrochim. Acta, 2017, 231, 694–770 CrossRef.
- B. J. De, X. Y. Liu and X. Xu, J. Phys. Chem. Solids, 2018, 112, 209–215 Search PubMed.
- A. J. Expósito, J. M. Monteagudo and I. Durán, J. Hazard. Mater., 2018, 342, 597–605 CrossRef PubMed.
- F. Spyros, M. M. Jose and D. Antonio, Electrochim. Acta, 2018, 612, 605–612 Search PubMed.
- C. Irene, S. Carla and P. Laura, Chemosphere, 2015, 130, 73–81 CrossRef PubMed.
- R. Cabrera and J. L. Miralles, Sci. Total Environ., 2017, 605, 230–237 CrossRef PubMed.
- S. B. Wang, Dyes Pigm., 2008, 76, 714–720 CrossRef CAS.
- M. Bianca, M. D. Souza and A. R. Rui, Chem. Eng. J., 2014, 256, 448–457 CrossRef.
- S. Yongkoo and J. Iraj, Chemosphere, 2008, 72, 537–542 CrossRef PubMed.
- Z. Hui, H. Jin and C. Huang, J. Hazard. Mater., 2005, 125, 166–174 CrossRef PubMed.
- H. Yoo and S. Cho, J. Environ. Sci. Health, Part A: Toxic/Hazard. Subst. Environ. Eng., 2001, 36, 39–48 CrossRef CAS.
- D. Yang and D. E. James, Water Res., 2006, 40, 3683–3694 CrossRef PubMed.
- W. J. Zhang, X. Y. Yang and D. S. Wang, Ind. Eng. Chem. Res., 2013, 52, 5765–5771 CrossRef CAS.
- C. Li, K. Qian and Q. Liu, Environ. Technol., 2017, 1–10 Search PubMed.
- M. Vanga and R. Kunduru, Chem. Pharm. Bull., 2010, 7, 953–956 Search PubMed.
- G. Wolfgang, K. Thomas and G. Andreas, Chemosphere, 2003, 50, 71–78 CrossRef.
- M. Vedrenne, R. Vasquez-Medrano and D. Prato-Garcia, J. Hazard. Mater., 2012, 243, 292–301 CrossRef CAS PubMed.
- H. Josef and J. KopaCek, Analyst, 1990, 115, 1463–1467 RSC.
- S. W. Peng and W. J. Zhang, J. Environ. Sci., 2016, 41, 16–23 CrossRef PubMed.
- L. G. Saywel and L. B. Cunningham, Ind. Eng. Chem., 2008, 9, 67–69 Search PubMed.
- M. F. Li and H. Q. Wang, Acta Agric. Univ. Jiangxiensis, 2003, 25, 794–796 CAS.
- I. Satoru, N. Nobuto and O. Kei, Polym. Degrad. Stab., 2016, 123, 131–136 CrossRef.
- Y. S. Andrea, T. Jamese and J. Susan, Environ. Sci. Technol., 2007, 41, 2881–2887 CrossRef.
- G. Ipek, A. S. Gulerman and B. D. Filiz, J. Hazard. Mater., 2006, 136, 763–769 CrossRef PubMed.
- H. Zhang, H. J. Choi and C. Huang, J. Hazard. Mater., 2005, 125, 166–174 CrossRef CAS PubMed.
- Y. W. Kang and K. Y. Hwang, Water Res., 2000, 34, 2786–2790 CrossRef CAS.
|
| This journal is © The Royal Society of Chemistry 2018 |
Click here to see how this site uses Cookies. View our privacy policy here.  Open Access Article
 ,
Kun Qian,
Jinxu Qi,
Chenru Li,
Chen Yao,
Wei Song and
Yihong Wang*
![[thin space (1/6-em)]](https://www.rsc.org/images/entities/char_2009.gif) :
:![[thin space (1/6-em)]](https://www.rsc.org/images/entities/char_2009.gif) 3 (1
3 (1![[thin space (1/6-em)]](https://www.rsc.org/images/entities/char_2009.gif) :
:![[thin space (1/6-em)]](https://www.rsc.org/images/entities/char_2009.gif) 3 is the best molar ratio as determined in the previous experiment). For the three feeding methods the total concentrations of Fe2+ and H2O2 were 3.73 g L−1 and 21.60 mL L−1, respectively. In the first method of feeding, 3.73 g Fe2+ and 21.6 mL H2O2 were added to 1 L HEBZ wastewater at one time; this is denoted one-time feeding. In the second method of feeding, FeSO4·7H2O and H2O2 were added at 0.187 g L−1 min−1 and 1.080 mL L−1 min−1 for 20 min using a uniform auto sampler. In the uniform deceleration feeding method, FeSO4·7H2O and H2O2 were added using the decompression device depicted in Fig. 2 (the initial speed of uniform deceleration feeding and uniform feeding was the same). All the above experiments were performed in triplicate. In addition, PL, UV-vis, FTIR, HPLC and GC-MS were employed to qualitatively characterize the wastewater before and after the Fenton reactions.
3 is the best molar ratio as determined in the previous experiment). For the three feeding methods the total concentrations of Fe2+ and H2O2 were 3.73 g L−1 and 21.60 mL L−1, respectively. In the first method of feeding, 3.73 g Fe2+ and 21.6 mL H2O2 were added to 1 L HEBZ wastewater at one time; this is denoted one-time feeding. In the second method of feeding, FeSO4·7H2O and H2O2 were added at 0.187 g L−1 min−1 and 1.080 mL L−1 min−1 for 20 min using a uniform auto sampler. In the uniform deceleration feeding method, FeSO4·7H2O and H2O2 were added using the decompression device depicted in Fig. 2 (the initial speed of uniform deceleration feeding and uniform feeding was the same). All the above experiments were performed in triplicate. In addition, PL, UV-vis, FTIR, HPLC and GC-MS were employed to qualitatively characterize the wastewater before and after the Fenton reactions.![[thin space (1/6-em)]](https://www.rsc.org/images/entities/char_2009.gif) :
:![[thin space (1/6-em)]](https://www.rsc.org/images/entities/char_2009.gif) 3, CODinitial = 3555 mg L−1) are shown in Fig. 3. From Fig. 3 we can see that, in the one-time feeding mode (Line I), the COD removal rate increased rapidly in the first 10 min and then became steady during the next 10 min. After 20 min, little change took place and the total COD removal rate of HEBZ was 60.7% at 40 min. In the uniform feeding mode (Line II), when both Fe2+ and H2O2 were added equably at a low speed, the COD removal rate raised evenly in the first 20 min and then more slowly during the next 10 min. What was noteworthy was that the COD removal rate exceeded that of the one-time feeding mode at 15 min. After 30 min, the COD removal rate became stable and eventually reached 72.1%, which is 11.4% higher than that of the one-time feeding mode. In the uniform deceleration feeding mode (Line III), when both Fe2+ and H2O2 were introduced at a decreasing rate, the COD removal rate rose persistently in the initial 30 min and then the growth became smooth. Notably, the COD removal rate surpassed that of the uniform feeding mode in 23 min and ultimately reached 79.3%, which is 18.6% higher than that of the one-time feeding mode. The above results suggested that the feeding method had a big effect on the degradation of HEBZ and that uniform deceleration feeding was the best feeding mode, which may be related to the non-reactive oxidation of Fe2+, H2O2 self-decomposition,31,44 and the quenching of ˙OH.
3, CODinitial = 3555 mg L−1) are shown in Fig. 3. From Fig. 3 we can see that, in the one-time feeding mode (Line I), the COD removal rate increased rapidly in the first 10 min and then became steady during the next 10 min. After 20 min, little change took place and the total COD removal rate of HEBZ was 60.7% at 40 min. In the uniform feeding mode (Line II), when both Fe2+ and H2O2 were added equably at a low speed, the COD removal rate raised evenly in the first 20 min and then more slowly during the next 10 min. What was noteworthy was that the COD removal rate exceeded that of the one-time feeding mode at 15 min. After 30 min, the COD removal rate became stable and eventually reached 72.1%, which is 11.4% higher than that of the one-time feeding mode. In the uniform deceleration feeding mode (Line III), when both Fe2+ and H2O2 were introduced at a decreasing rate, the COD removal rate rose persistently in the initial 30 min and then the growth became smooth. Notably, the COD removal rate surpassed that of the uniform feeding mode in 23 min and ultimately reached 79.3%, which is 18.6% higher than that of the one-time feeding mode. The above results suggested that the feeding method had a big effect on the degradation of HEBZ and that uniform deceleration feeding was the best feeding mode, which may be related to the non-reactive oxidation of Fe2+, H2O2 self-decomposition,31,44 and the quenching of ˙OH.

![[thin space (1/6-em)]](https://www.rsc.org/images/entities/char_2009.gif) :
:![[thin space (1/6-em)]](https://www.rsc.org/images/entities/char_2009.gif) 3, CODinitial = 3555 mg L−1).
3, CODinitial = 3555 mg L−1).
![[double bond, length as m-dash]](https://www.rsc.org/images/entities/char_e001.gif) O, respectively, which suggested alcohols or carboxylic acids might be produced. These results corroborated that the benzene ring and heterocyclic structure of HEBZ were destroyed after the Fenton reaction. In addition, hydramines, amides or carboxylic acids may be generated.
O, respectively, which suggested alcohols or carboxylic acids might be produced. These results corroborated that the benzene ring and heterocyclic structure of HEBZ were destroyed after the Fenton reaction. In addition, hydramines, amides or carboxylic acids may be generated.


