 Open Access Article
Chemical reaction characteristics, structural transformation and electrochemical performances of new cathode LiVPO4F/C synthesized by a novel one-step method for lithium ion batteries
Qiyuan Lia,
Zheng Wena,
Changling Fan *ab,
Taotao Zenga and
Shaochang Hana
aCollege of Materials Science and Engineering, Hunan University, Changsha 410082, China. E-mail: fancl@hnu.edu.cn
bHunan Province Key Laboratory for Advanced Carbon Materials and Applied Technology, Hunan University, Changsha, Hunan 410082, China
First published on 13th February 2018
Abstract
A new cathode LiVPO4F/C with a high working voltage of around 4.2 V was synthesized by a novel one-step method. The color of the solution turns green, which implies that V2O5 is successfully reduced to V3+. The reaction thermodynamics indicates that LiVPO4F/C is formed when the sintering temperature is higher than 650 °C, while the accompanying impurity phase Li3V2(PO4)3/C is also generated. The reaction kinetics proves that the reaction is third order and the activated energy is 208.9 kJ mol−1. X-ray photoelectron spectra imply that the components of LiVPO4F/C prepared at 800 °C (LVPF800) are in their appropriate valence. LVPF800 is composed of micron secondary particles aggregating from nano subglobose. The structural transformation shows that the V![[thin space (1/6-em)]](https://www.rsc.org/images/entities/char_2009.gif) :
:![[thin space (1/6-em)]](https://www.rsc.org/images/entities/char_2009.gif) P
P![[thin space (1/6-em)]](https://www.rsc.org/images/entities/char_2009.gif) :
:![[thin space (1/6-em)]](https://www.rsc.org/images/entities/char_2009.gif) F ratio in LVPF800 is close to 1
F ratio in LVPF800 is close to 1![[thin space (1/6-em)]](https://www.rsc.org/images/entities/char_2009.gif) :
:![[thin space (1/6-em)]](https://www.rsc.org/images/entities/char_2009.gif) 1
1![[thin space (1/6-em)]](https://www.rsc.org/images/entities/char_2009.gif) :
:![[thin space (1/6-em)]](https://www.rsc.org/images/entities/char_2009.gif) 1. The reason behind generation of impurity Li3V2(PO4)3 at a high temperature of 850 °C is demonstrated directly, which is mainly due to the volatilization of VF3. The electrochemical performances of the cathode are related to the crystallite content of LiVPO4F/C and Li3V2(PO4)3/C. The specific capacities at 0.2 and 5C of LVPF800 are as high as 139.3 and 116.5 mA h g−1. Electrochemical analysis reveals that LVPF800 possesses an excellent reversibility in the extraction and insertion process and minimum charge transfer resistance.
1. The reason behind generation of impurity Li3V2(PO4)3 at a high temperature of 850 °C is demonstrated directly, which is mainly due to the volatilization of VF3. The electrochemical performances of the cathode are related to the crystallite content of LiVPO4F/C and Li3V2(PO4)3/C. The specific capacities at 0.2 and 5C of LVPF800 are as high as 139.3 and 116.5 mA h g−1. Electrochemical analysis reveals that LVPF800 possesses an excellent reversibility in the extraction and insertion process and minimum charge transfer resistance.
Introduction
Non-renewable energy sources, such as coal, petroleum and natural gas, play an indispensable role in the development of the modern society. However, their reserves are limited. Further, their application generates exhaust gas, and dust, which pollutes the environment. Recently, severe fog and haze engulfed the north of China, affecting the life and work of people. Fog and haze are partially caused by the exhaust gas from automobiles. Electric vehicles equipped with zero emission lithium ion batteries can solve this problem. Batteries are more beneficial particularly when they are charged with electricity generated from wind energy, water energy, solar energy and other renewable energy sources.Several electroactive materials with a particular crystallite structure, such as spinel LiMn2O4, layered LiNi1−x−yCoxMnyO2 and olivine LiFePO4, are commonly used as cathodes for lithium ion batteries. However, they cannot entirely meet the demanding aspects of structural stability, power density and safety performance. In 2002, Barker et al.1 synthesized a new cathode LiVPO4F with the same structure as natural minerals KAlPO4F and LiAlPO4F. The LiVPO4F phase comprises a three dimensional framework building up from a PO4 tetrahedron and a VO4F2 octahedron. Its crystal structure is a triclinic system and the lattice parameters are as follows: a = 5.1687(2) Å, b = 5.3062(2) Å, c = 7.5031(3) Å, α = 66.856(2)°, β = 67.004(2)°, γ = 81.583(2)°. In addition, the cell volume is 174.21(1) Å3.2 The V3+/V4+ redox couple potential is 4.2 V, which is 0.3 V and 0.8 V higher than those of LiCoO2 and LiFePO4.3 It results from the element fluorine with the highest electronegativity of 3.98, which makes the PO4 tetrahedron and VO4F2 octahedron more stable.4,5 The heat flow,6 self-heating rate7 and energy releasing reaction with electrolyte8 show that the thermal stability of LiVPO4F is superior to LiMn2O4, LiNi1−x−yCoxMnyO2 and LiFePO4. Hence, triclinic LiVPO4F delivers the advantages of high working voltage, stable crystallite structure and excellent thermal stability and is a possible candidate to replace the above cathode.
However, the electronic conductivity of LiVPO4F is very poor. Currently, studies have been primarily focused on the preparation of LiVPO4F with excellent performances by developing new methods, such as carbon coating and metallic ions-doping.
The studies on this new LiVPO4F cathode are few. LiVPO4F/C has often been prepared by two-step carbothermal reduction, which comprises of two sintering processes at high temperature.9–11 The intermediate VPO4 is synthesized by heating precursors at 700–800 °C for several hours and the energy consumption is large. In order to synthesize LiVPO4F/C in an energy-saving manner, a one-step method was developed, in which the synthesis of VPO4 was omitted. One typical treatment is the so-called hydrogel method, which is performed by adding H2O2 solution to V2O5 (ref. 12) or melting V2O5 in a crucible at 700 °C.13,14 The other method is mixing the raw materials using an agate mortar, followed by magnetic stirring and ball milling.15–18
Although carbon black can improve the performances of LiVPO4F/C by enhancing conductivity, the excessive carbon content (20–50%) used to reduce V2O5 is the other drawback of the two-step method. The high content of residual carbon will decrease the tap density and volumetric energy density. To the best of our knowledge, in enhancing the conductivity of the LiVPO4F/C cathode, carbon black is inferior to organic carbon sources.19 The abovementioned one-step method decreases the carbon content by introducing oxalic acid. Carbon sources such as sucrose,13 multi-walled carbon nanotubes20 and graphene21–24 have been used to modify LiVPO4F/C through a form conducting network and enhance the rate and cyclic performances.
Compared to carbon coating, doping of metallic ions is also an effective method to improve the intrinsic conductivity and the rate performances of crystallite LiFePO4.25 The substitution of V3+ with Al3+,26–28 Ti4+,4,29 Mn4+ (ref. 30 and 31) and Y3+ (ref. 32) enhances the performance of LiVPO4F; however, most of these doped materials are prepared by the traditional two-step carbothermal method.
Although the one-step method is superior to the traditional two-step method, most approaches take several hours to complete the reduction of V5+. In this paper, we propose a novel one-step method, in which the synthesis of VPO4 is omitted. The reduction of V5+ in NH4VO3 at an elevated temperature in a short time was systematically investigated. The chemical reaction characteristics including thermodynamics and kinetics were studied. The transformation law of the triclinic LiVPO4F/C crystallite with the sintering temperature was researched and the electrochemical performances were analyzed.
Experimental section
Synthesis of materials
LiVPO4F/C was synthesized by a novel one-step method at an elevated temperature. The target amount of LiVPO4F/C was kept at 0.02 mol in a 100 mL system. First, NH4VO3 (AR, 2.3632 g, 0.02 mol) was dissolved in deionized water (70 mL) in a polytetrafluoroethylene (PTFE) beaker under vigorous magnetic stirring. It was fully reduced by H2C2O4 (AR, 3.8001 g, 0.03 mol) in the mole ratio of 1![[thin space (1/6-em)]](https://www.rsc.org/images/entities/char_2009.gif) :
:![[thin space (1/6-em)]](https://www.rsc.org/images/entities/char_2009.gif) 1.5 at 60 °C to obtain green color solution in 10 min. Then, LiF (CP, 0.5558 g, 0.021 mol), NH4H2PO4 (AR, 2.3236 g, 0.02 mol) and poly(vinylidene fluoride) (PVDF) (95%, 1.4943 g) suspension were added to the above solution. The suspension was prepared by dispersing PVDF in water (30 mL) containing hexadecyl trimethyl ammonium bromide (CTAB) (AR, 0.7363 g), accompanied with ultrasonic dispersion at 50 °C. Next, the solution was heated in a vacuum drying oven at 80 °C. Finally, the dry precursor was pre-sintered at 400 °C for 5 h and then sintered from 650 °C to 850 °C for 4 h in a tubular furnace under flowing argon atmosphere.
1.5 at 60 °C to obtain green color solution in 10 min. Then, LiF (CP, 0.5558 g, 0.021 mol), NH4H2PO4 (AR, 2.3236 g, 0.02 mol) and poly(vinylidene fluoride) (PVDF) (95%, 1.4943 g) suspension were added to the above solution. The suspension was prepared by dispersing PVDF in water (30 mL) containing hexadecyl trimethyl ammonium bromide (CTAB) (AR, 0.7363 g), accompanied with ultrasonic dispersion at 50 °C. Next, the solution was heated in a vacuum drying oven at 80 °C. Finally, the dry precursor was pre-sintered at 400 °C for 5 h and then sintered from 650 °C to 850 °C for 4 h in a tubular furnace under flowing argon atmosphere.
Characterization
Reaction thermodynamics was investigated using a SETSYS-24 thermal analyzer at the rate of 10 °C min−1. The crystallite structure of the sample LiVPO4F/C was analyzed using a Rigaku D/MAX 2500 X-ray diffraction (XRD) instrument. The valence of the element in the sample was determined by an ESCALAB 250Xi X-ray photoelectron spectroscopy (XPS). The morphology was observed by a Navo NanoSEM230 Scanning electron microscope (SEM) with energy disperse spectroscopy (EDS). The morphology and selected area electron diffraction (SAED) of the sample were observed by a JEOL-3010 high resolution transmission electron microscope (HRTEM). The electronic conductivity was determined by a ST2722-SZ resistivity tester at 25 MPa. The carbon content in the sample was determined using a HH2000A high frequency infrared carbon sulfur analyzer.Electrochemical measurements
Cathode films were prepared by mixing the sample, acetylene black and PVDF in N-methyl pyrrolidone solvent at the mass ratio of 80![[thin space (1/6-em)]](https://www.rsc.org/images/entities/char_2009.gif) :
:![[thin space (1/6-em)]](https://www.rsc.org/images/entities/char_2009.gif) 15
15![[thin space (1/6-em)]](https://www.rsc.org/images/entities/char_2009.gif) :
:![[thin space (1/6-em)]](https://www.rsc.org/images/entities/char_2009.gif) 5. The slurry was coated on an aluminum current collector and dried in a vacuum drying oven at 120 °C for 12 h. The load weight of the cathode material with the diameter of 14 mm was maintained at 2.5 mg. The 2016 type cell was assembled in a Super (1220/750) glove box filled with ultra-purity argon gas. The counter electrode was lithium foil. The electrolyte was 1.3 mol L−1 LiPF6 solved in a solvent mixture of ethylene carbonate, dimethyl carbonate and ethyl methyl carbonate in the weight ratio of 1
5. The slurry was coated on an aluminum current collector and dried in a vacuum drying oven at 120 °C for 12 h. The load weight of the cathode material with the diameter of 14 mm was maintained at 2.5 mg. The 2016 type cell was assembled in a Super (1220/750) glove box filled with ultra-purity argon gas. The counter electrode was lithium foil. The electrolyte was 1.3 mol L−1 LiPF6 solved in a solvent mixture of ethylene carbonate, dimethyl carbonate and ethyl methyl carbonate in the weight ratio of 1![[thin space (1/6-em)]](https://www.rsc.org/images/entities/char_2009.gif) :
:![[thin space (1/6-em)]](https://www.rsc.org/images/entities/char_2009.gif) 1
1![[thin space (1/6-em)]](https://www.rsc.org/images/entities/char_2009.gif) :
:![[thin space (1/6-em)]](https://www.rsc.org/images/entities/char_2009.gif) 1.
1.
The LiVPO4F/C cathode was charged and discharged at different rates by a BT2000 Battery test system in the potential range of 3.000–4.500 V (vs. Li+/Li). The electrochemical impedance spectra and cyclic voltammogram of the cathode were obtained using a CHI 660C electrochemical workstation. The amplitude of potential was 5 mV and the frequency range was from 100 kHz to 0.01 Hz. The scanning rate of cyclic voltammogram was 0.1 mV s−1.
Results and discussion
Reduction procedure analysis
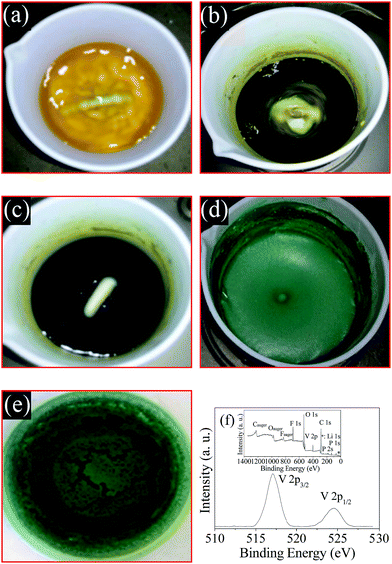
In this paper, NH4VO3 containing high valence V5+ is reduced by H2C2O4 at the temperature of 60 °C. The transformation process of the solution color is presented in Fig. 1.First, after the addition of the reducing agent H2C2O4, the color of the NH4VO3 solution turns gradually from white to yellow (a), blend color (b), blue (c) and green (d). The mixed color in (b) is a blend of yellow, blue and green. The ion constituent and valence of vanadium are VO2+ (V5+), VO2+ (V5+) (coexisting with VO2+ (V4+)), VO2+ (V4+) and V3+. Then, the color of the solution is still similar to Fig. 1(d) after the addition of LiF, NH4H2PO4, PVDF and CTAB. The color of the dry precursor (e) is green. It is well known that V3+ ion is typically green in color. The binding energy peak in the XPS spectrum of the dry precursor is around 571.2 eV and 524.6 eV. This indicates that the valency of vanadium is 3+ according to literature.9 These observations indicate that raw NH4VO3 is reduced completely to V3+ by H2C2O4 in 10 minutes at 60 °C. Therefore, the general reaction takes place according to eqn (1).
| NH4VO3 + H2C2O4 + 3H+ → V3+ + 3H2O + NH3 + 2CO2 | (1) |
The reduction time of NH4VO3 is shorter compared to the long-time ball milling in other one-step methods.24
Reaction thermodynamics
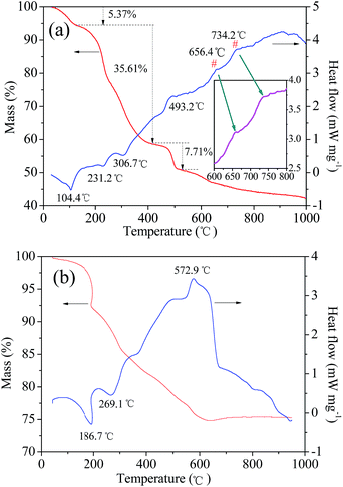
The feasibility of a chemical reaction, i.e., whether it can take place or not plays an important role in research, particularly when a new method is proposed. In general, we can determine the possibility by checking the classical binary or ternary phase diagrams of ceramic materials such as LiMn2O4 in the Li–Mn–O phase. However, to the best of our knowledge, there is no phase diagram based on the synthesis of LiVPO4F/C from typical raw materials such as LiF, NH4VO3, and NH4H2PO4. This is because LiVPO4F/C is a rather new cathode material. Therefore, the reaction thermodynamics of LiVPO4F can only be analyzed through thermogravimetric (TG) and differential scanning calorimetry (DSC) analysis. The TG–DSC curves of the dry precursor for LiVPO4F are shown in Fig. 2. The TG–DSC curve of Li3V2(PO4)3 is also shown for comparison. The DSC curve in the temperature range of 600 °C to 800 °C is amplified and inserted in it. The experiments are conducted in inert argon atmosphere, which is the same as the sintering atmosphere.It can be observed that several visible stages of weight loss and thermal exchange appear in the TG–DSC curve of LiVPO4F/C. The first endothermic peak at 104.4 °C represents the release of absorbed water in the raw materials;33 the mass loss is 5.37%. The other stage of weight loss (35.61%) takes place between 120 °C and 420 °C. The endothermic peaks at around 231.2 °C and 306.7 °C represent the decomposition of H2C2O4.17 The exothermic peak at 493.2 °C is attributed to the decomposition of NH4H2PO4.16 The exothermic peak at around 656.4 °C shows that LiVPO4F crystallite is formed initially. The broad peak at 734.2 °C (700–800 °C) represents the crystallization process of LiVPO4F. It is concluded that the triclinic system LiVPO4F is formed when the sintering temperature is higher than 650 °C.
It is well known that monoclinic Li3V2(PO4)3 can be synthesized by a carbothermal reduction method17 using raw materials Li2CO3, V2O5, NH4H2PO4 and carbon sources (such as epoxy resin). These are very similar to LiF, NH4VO3, NH4H2PO4 and H2C2O4 used in this study. High valence V2O5 or NH4VO3 are reduced to +3 either by pyrolysis carbon from epoxy resin19 or H2C2O4 in this study. The most evident difference is the existence of F− in LiF and the reducing agent H2C2O4 in this study. The TG–DSC analysis of the dry precursor for Li3V2(PO4)3/C was performed, which was made by grinding the abovementioned mixture in a planetary mill. The endothermic peak at 269.1 °C arises from the decomposition of NH4H2PO4. The exothermic peak at around 572.9 °C represents the formation of Li3V2(PO4)3 according to eqn (2).
| 3Li2CO3 + 2V2O5 + 6NH4H2PO4 + 4C → 2Li3V2(PO4)3 + 9H2O + 6NH3 + 3CO2 + 4CO | (2) |
From the above analysis, it can be found that LiVPO4F will be synthesized successfully by the one-step method proposed in this paper. However, Li3V2(PO4)3 impurity is also generated in this process. Therefore, the growth of Li3V2(PO4)3 should be restrained in the synthesis of the high-purity LiVPO4F/C cathode.
Crystallite transformation
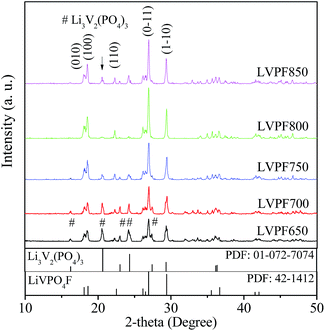
The dry precursor of LiVPO4F/C was pre-sintered at 400 °C and then sintered at different temperatures (650, 700, 750, 800 and 850 °C) to prepare LiVPO4F/C. The samples obtained were labeled as LVPF650, LVPF700, LVPF750, LVPF800 and LVPF850, respectively. The crystallite transformation of LiVPO4F was investigated via XRD analysis to determine whether the generation of the Li3V2(PO4)3 impurity is eliminated. The XRD patterns are shown in Fig. 3.After comparing with the standard pattern (shown in the bottom in Fig. 3), we found that the sample LVPF650 is made up of target LiVPO4F and impurity Li3V2(PO4)3. This proves that LiVPO4F is successfully prepared in this condition. However, the diffraction peaks are not strong enough and the crystallinity is low. In addition, this sintering temperature, used to prepare the sample LVPF650 is in the range of exothermic peaks at around 656.4 °C. Moreover, the strongest peak of impurity Li3V2(PO4)3 at 20.551° is visible. This is in accordance with the prediction based on reaction thermodynamics. It is concluded that the thermodynamics investigation is credible.
Upon increasing the sintering temperature, the intensity of the strongest peak of LiVPO4F at 26.978° increases gradually. On the contrary, the peak intensity of Li3V2(PO4)3 at 20.551° decreases. This infers that the crystallite LiVPO4F becomes increasingly perfect and its content also increases, accompanied with the drop in the content of the impurity. From the thermodynamics analysis, we know that the exothermic temperature of Li3V2(PO4)3 (572.9 °C) is lower than that of LiVPO4F, which implies that Li3V2(PO4)3 is easier to be prepared. Therefore, it is understandable that the formation of impurity Li3V2(PO4)3 accompanies the synthesis of LiVPO4F. When the sintering temperature reaches 800 °C, there is nearly no impurity Li3V2(PO4)3 in the LiVPO4F phase. Nonetheless, the impurity peak of Li3V2(PO4)3 appears again when the temperature rises to 850 °C.
It can be observed that the diffraction angle and peak intensity of the sample LVPF800 are very close to the standard pattern of LiVPO4F in the bottom. Also, its crystallite structure is a typical triclinic system. It is a three-dimensional network, which is built from PO4 tetrahedron and VO4F2 octahedron. Its thermal stability is excellent due to the strong covalence between phosphate and oxygen. The main peak (0–11) is sharp and symmetric, which shows that the crystallite structure is perfectly developed. The lattice parameters a, b, c and cell volume are 5.1672 Å, 5.3060 Å, 7.2893 Å and 173.97 Å3, respectively, which are similar to those obtained in previous studies.27,30
According to Scherer's equation, the crystallite sizes of LiVPO4F in the face of (0–11) at around 26.978° prepared at 650, 700, 750, 800 and 850 °C are 19, 21, 23, 31 and 40 nm, respectively. The crystallite size increases significantly. The crystallite size of LiVPO4F prepared at 800 °C is smaller than those reported in other literatures.12,34 It is concluded that this sample possesses a well-developed crystallite structure and moderate size.
Reaction kinetics
Although the preparation of LiVPO4F/C is possible based on reaction thermodynamics, the chemical reaction kinetics has not been discussed. Even in the commonly used cathodes such as LiMn2O4, LiNi1/3Mn1/3Co1/3O2 and LiFePO4, the kinetics is seldom investigated. The kinetics of LiFePO4 with polyanion group has been investigated using the Kissinger method35 based on the TG and DSC analysis at different heating rates of 5, 10, 15 and 20 K min−1. However, in our opinion, the reactions in the sintering and heat preservation process of precursors are really complex. The analysis in ref. 35 cannot entirely represent the actual reaction.In order to determine the activation energy, the degree of difficulty and reaction order of the preparation of the LiVPO4F/C cathode, the reaction kinetics was investigated from the viewpoint of the classical Arrhenius equation. The reactant concentration and chemical reaction rate constant of the synthesis reaction of LiVPO4F/C were calculated on the basis of the mole fractions of the resultant LiVPO4F/C, which were determined indirectly using Jade 6.0 software according to the XRD patterns shown in Fig. 3. After the calculation, we find that the mole fractions of the samples LVPF650, LVPF700, LVPF750, LVPF800 and LVPF850 are 0.7475, 0.8382, 0.9285, 0.9605 and 0.9133, respectively.
It can be noted that the mole fractions of LiVPO4F/C are very low when the sintering temperature is lower than 750 °C, which are 0.7475 (650 °C) and 0.8382 (700 °C). This indicates that there is a large amount of impurity Li3V2(PO4)3/C in the resultant, that is to say, the competition reaction of the formation of Li3V2(PO4)3/C is obvious. Therefore, low sintering temperature is not beneficial to the preparation of LiVPO4F/C. The mole fraction of LiVPO4F/C increases to 0.9285 and 0.9605 when the temperature rises to 750 and 800 °C. The mole fraction of LiVPO4F/C does not increase, but decreases to 0.9133 when the temperature increases to 850 °C. In other words, the content of impurity Li3V2(PO4)3/C increases again.
The Arrhenius equation, which is often used to discuss the kinetics of chemical reactions, was applied herein to investigate the kinetics of LiVPO4F/C prepared by the one-step method. The condition of 850 °C was eliminated in the subsequent analysis due to its inverse changing of mole fraction.
The initial reactant concentration (CA,0) was 0.2 mol L−1, in which 0.02 mol of reactant NH4VO3 was dissolved in the 100 mL reaction system of. Assuming that if x percent reactant was consumed at a given temperature, the reactant concentration (CA) would be 0.2(1 − x) mol L−1. The rate constants (kA) of the preparation reaction of LiVPO4F/C were calculated according to eqn (3)–(6) when the reaction order was supposed to be zero, first, second and third. In these equations, t is the reaction time and its unit is second (s).
Zero order,
| CA,0 − CA = kAt | (3) |
First order,
| ln(CA,0/CA) = kAt | (4) |
Second order,
| 1/CA − 1/CA,0 = kAt | (5) |
Third order,
| (1/CA2 − 1/CA,02)/2 = kAt | (6) |
The Arrhenius eqn (7) was used to investigate the relationship between the rate constant (kA) and the absolute reaction temperature (T). Ea is the activation energy of the reaction and R is the universal gas constant. C is the pre-exponential factor. The Arrhenius equation can be expressed in the format of eqn (8). The plot of ln![[thin space (1/6-em)]](https://www.rsc.org/images/entities/char_2009.gif) kA vs. 1/T was plotted at different supposed reaction orders. 1/T is transformed to 1000/T in order to make the scale of abscissa more appropriate. The results are shown in Fig. 4. As expected, the obtained plots linear and the slope can be calculated from linear fitting. Therefore, we can obtain the activation energy from eqn (9)
kA vs. 1/T was plotted at different supposed reaction orders. 1/T is transformed to 1000/T in order to make the scale of abscissa more appropriate. The results are shown in Fig. 4. As expected, the obtained plots linear and the slope can be calculated from linear fitting. Therefore, we can obtain the activation energy from eqn (9)
ln![[thin space (1/6-em)]](https://www.rsc.org/images/entities/char_2009.gif) kA = −Ea/RT + C kA = −Ea/RT + C
| (7) |
| Y = A × X + B | (8) |
| Ea = −A × R | (9) |
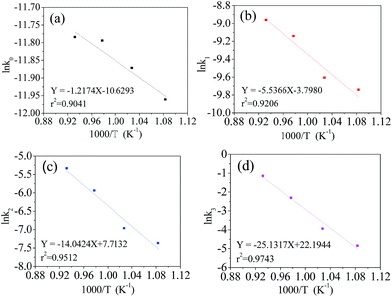 | ||
Fig. 4 Dependence of ln![[thin space (1/6-em)]](https://www.rsc.org/images/entities/char_2009.gif) kA on 1000/T at supposed reaction orders, zero (a), first (b), second (c), third (d). kA on 1000/T at supposed reaction orders, zero (a), first (b), second (c), third (d). | ||
It can be noted that ln![[thin space (1/6-em)]](https://www.rsc.org/images/entities/char_2009.gif) kA fits well with 1000/T in different orders of reaction. Their coefficients are greater than 0.9. The estimated activated energies at the zero, first, second and third order reactions are 10.1, 46.0, 116.8 and 208.9 kJ mol−1, respectively. The coefficient of the third order reaction is as high as 0.9743, which is larger than that of the other orders. This indicates that the preparation process of the LiVPO4F/C cathode is very close to the third order reaction, which is a complex procedure.
kA fits well with 1000/T in different orders of reaction. Their coefficients are greater than 0.9. The estimated activated energies at the zero, first, second and third order reactions are 10.1, 46.0, 116.8 and 208.9 kJ mol−1, respectively. The coefficient of the third order reaction is as high as 0.9743, which is larger than that of the other orders. This indicates that the preparation process of the LiVPO4F/C cathode is very close to the third order reaction, which is a complex procedure.
From the viewpoint of chemical reaction, the activation energy is in the range of 60–250 kJ mol−1.35 The reaction activation energy of LiVPO4F/C is near to the upper limit. According to the classical activation theory, the consumed energy is very large and the synthesis reaction will be difficult. Therefore, it can be predicted that the reaction mechanism of LiVPO4F/C in this study is complex. It contains of not only the conversion of the initial reactant to the resultant LiVPO4F/C, but also the crystallinity transformation from low degree to high degrees.
Morphology and structural transformation
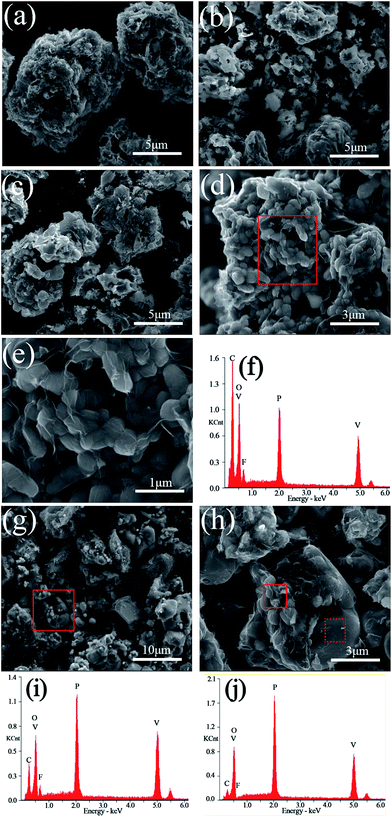
The SEM images and EDS mappings of the LiVPO4F/C samples are presented in Fig. 5. It can be observed that the particles are irregular and their granularity distribution is wide when the sintering temperature is lower than 800 °C. The aggregation phenomenon in them is evident.When the sample is sintered at 800 °C, a large amount of subglobose nanoparticles are generated, which accumulate to form secondary larger particles with micron size. This conforms to the opinion that the primary particles of the cathode may be nanosized and the secondary particles must be micron sized. The nanoparticles enable the rapid extraction and insertion of lithium ions. We can realize its excellent rate performances when it is used as a cathode for lithium ion batteries. However, nanoparticles cannot be packed tightly and this will lower the tap density and volumetric energy density of the cathode. This is a typical feature of nanomaterials, where the tap density of acetylene black (d50 = 50 nm) is about 0.2 g cm−3. The aggregation of nanoparticles and the formation of micron particles in the sample LiVPO4F/C can improve the tap density and the volumetric energy density. This is the advantage of the particles in the sample LVPF800 obtained by the one-step method in this study.
It can be clearly observed that numerous thin layers of pyrolytic carbon are coated on the particles' surface of LVPF800 (Fig. 5(e)). The residual carbon content in its superficial layer is 51.09 wt%, which is much greater than the bulk content of 11.76 wt%. Therefore, its electronic conductivity is as high as 0.21 S cm−1. A visible peak belonging to fluorine can also be found in the EDS pattern of the sample LVPF800. This indicates that there is a certain content of elemental fluorine. The atomic percentages of V, P and F are 3.08%, 3.05% and 3.12%, which shows that the mole ratio of V![[thin space (1/6-em)]](https://www.rsc.org/images/entities/char_2009.gif) :
:![[thin space (1/6-em)]](https://www.rsc.org/images/entities/char_2009.gif) P
P![[thin space (1/6-em)]](https://www.rsc.org/images/entities/char_2009.gif) :
:![[thin space (1/6-em)]](https://www.rsc.org/images/entities/char_2009.gif) F is very close to the stoichiometric value of 1
F is very close to the stoichiometric value of 1![[thin space (1/6-em)]](https://www.rsc.org/images/entities/char_2009.gif) :
:![[thin space (1/6-em)]](https://www.rsc.org/images/entities/char_2009.gif) 1
1![[thin space (1/6-em)]](https://www.rsc.org/images/entities/char_2009.gif) :
:![[thin space (1/6-em)]](https://www.rsc.org/images/entities/char_2009.gif) 1.
1.
The atomic content and ratio of F![[thin space (1/6-em)]](https://www.rsc.org/images/entities/char_2009.gif) :
:![[thin space (1/6-em)]](https://www.rsc.org/images/entities/char_2009.gif) V in the above samples are illustrated in Table 1. It is known that the content of fluorine in the sample represents the content of LiVPO4F crystallite. The content of fluorine and the ratio of F
V in the above samples are illustrated in Table 1. It is known that the content of fluorine in the sample represents the content of LiVPO4F crystallite. The content of fluorine and the ratio of F![[thin space (1/6-em)]](https://www.rsc.org/images/entities/char_2009.gif) :
:![[thin space (1/6-em)]](https://www.rsc.org/images/entities/char_2009.gif) V are very low when the sample is prepared at 650 °C. This implies that the content of the LiVPO4F crystallite is low at this condition. On increasing the sintering temperature, the content of LiVPO4F crystallite increases due to the gradual increase in the content of fluorine and F
V are very low when the sample is prepared at 650 °C. This implies that the content of the LiVPO4F crystallite is low at this condition. On increasing the sintering temperature, the content of LiVPO4F crystallite increases due to the gradual increase in the content of fluorine and F![[thin space (1/6-em)]](https://www.rsc.org/images/entities/char_2009.gif) :
:![[thin space (1/6-em)]](https://www.rsc.org/images/entities/char_2009.gif) V. It should be noted that the content of phosphate is much higher than that of vanadium. This is because the ratio of P
V. It should be noted that the content of phosphate is much higher than that of vanadium. This is because the ratio of P![[thin space (1/6-em)]](https://www.rsc.org/images/entities/char_2009.gif) :
:![[thin space (1/6-em)]](https://www.rsc.org/images/entities/char_2009.gif) V in Li3V2(PO4)3 is 1.5
V in Li3V2(PO4)3 is 1.5![[thin space (1/6-em)]](https://www.rsc.org/images/entities/char_2009.gif) :
:![[thin space (1/6-em)]](https://www.rsc.org/images/entities/char_2009.gif) 1. The content of LiVPO4F crystallite in sample LVPF800 attains the largest value owing to the highest value of F
1. The content of LiVPO4F crystallite in sample LVPF800 attains the largest value owing to the highest value of F![[thin space (1/6-em)]](https://www.rsc.org/images/entities/char_2009.gif) :
:![[thin space (1/6-em)]](https://www.rsc.org/images/entities/char_2009.gif) V (1.013) when the sintering temperature reaches 800 °C. These analyses are in accordance with the XRD results. It is noted that there is a difference between the ratio of F
V (1.013) when the sintering temperature reaches 800 °C. These analyses are in accordance with the XRD results. It is noted that there is a difference between the ratio of F![[thin space (1/6-em)]](https://www.rsc.org/images/entities/char_2009.gif) :
:![[thin space (1/6-em)]](https://www.rsc.org/images/entities/char_2009.gif) V and the real content of LiVPO4F crystallite because EDS is only determined from the superficial layer and not from the bulk of the samples.
V and the real content of LiVPO4F crystallite because EDS is only determined from the superficial layer and not from the bulk of the samples.
| Samples | V (%) | P (%) | F (%) | F![[thin space (1/6-em)]](https://www.rsc.org/images/entities/char_2009.gif) : :![[thin space (1/6-em)]](https://www.rsc.org/images/entities/char_2009.gif) V V |
|---|---|---|---|---|
| LVPF650 | 4.23 | 5.76 | 0.95 | 0.225 |
| LVPF700 | 3.86 | 5.36 | 1.06 | 0.275 |
| LVPF750 | 3.76 | 4.56 | 1.31 | 0.348 |
| LVPF800 | 3.08 | 3.05 | 3.12 | 1.013 |
| LVPF850-solid | 7.39 | 7.23 | 4.95 | 0.670 |
| LVPF850-dot | 8.32 | 12.29 | 0.36 | 0.043 |
When the sintering temperature increases to 850 °C (Fig. 5(g) and (h)), great changes take place in the morphology of the particles. A great deal of particles with large size and smooth surface appear and simultaneously, a large number of primary nanoparticles disappear. From the XRD patterns, we found that the crystallite size increases clearly from 31 nm (LVPF800) to 40 nm (LVPF850). The XRD analysis proves the formation of impurity Li3V2(PO4)3. For an in-depth analysis, the EDS analysis is conducted at two typical zones in the SEM images of sample LVPF850 and the results are presented in Fig. 5(i) and (j) and Table 1.
It can be noted that the peak attributed to fluorine in primary nanoparticles in the solid zone is visible, indicating the presence of LiVPO4F/C. However, the atomic ratio of F![[thin space (1/6-em)]](https://www.rsc.org/images/entities/char_2009.gif) :
:![[thin space (1/6-em)]](https://www.rsc.org/images/entities/char_2009.gif) V is 0.670, which is much lower than that of sample LVPF800. To our surprise, there is nearly no fluorine peak in the dot sample. The atomic content of fluorine in the dot sample is 0.36% and the ratio of F
V is 0.670, which is much lower than that of sample LVPF800. To our surprise, there is nearly no fluorine peak in the dot sample. The atomic content of fluorine in the dot sample is 0.36% and the ratio of F![[thin space (1/6-em)]](https://www.rsc.org/images/entities/char_2009.gif) :
:![[thin space (1/6-em)]](https://www.rsc.org/images/entities/char_2009.gif) V is only 0.043. This implies that there is nearly no LiVPO4F crystallites on the surface of large particles.
V is only 0.043. This implies that there is nearly no LiVPO4F crystallites on the surface of large particles.
It is concluded that the sintering temperature plays a vital role in the preparation of sample LiVPO4F/C. The temperature of 800 °C is proved to be an ideal condition to synthesize LiVPO4F/C with well-developed crystallites.
Formation mechanism of Li3V2(PO4)3
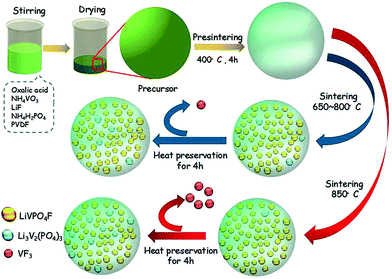
It is well known that fluoride is unstable and is easy to volatilize when a substance containing fluoride is heat-treated at high temperatures. The appearance of Li3V2(PO4)3 in sample LVPF850 is due to the volatilization of fluoride in LiVPO4F according to eqn (10). The loss of VF3 from LiVPO4F in this study is in accordance with the analysis in literature.36| 3LiVPO4F → Li3V2(PO4)3 + VF3 | (10) |
The volatilization phenomenon exists in the solid zone, as shown in the Fig. 6(b), and drops the ratio of F![[thin space (1/6-em)]](https://www.rsc.org/images/entities/char_2009.gif) :
:![[thin space (1/6-em)]](https://www.rsc.org/images/entities/char_2009.gif) V in the nanoparticles, which results from the generation of Li3V2(PO4)3. These are similar to the XRD analysis, where impurity Li3V2(PO4)3 is formed again in sample LVPF850. However, the formation of impurity at 850 °C is rather different from the sample when the sintering is lower than 800 °C. These can be illustrated by the Scheme 1. When the temperature is between 650 and 800 °C, it is more beneficial to the crystallization of the LiVPO4F. Li3V2(PO4)3 is the accompanying phase because its formation temperature is much lower than LiVPO4F according to the thermodynamics analysis. However, when the temperature rises to 850 °C, the decomposition of the LiVPO4F becomes the dominant reaction compared to the formation of LiVPO4F; hence, more Li3V2(PO4)3 impurity is formed. This also proves that fluoride is not stable at high temperature.
V in the nanoparticles, which results from the generation of Li3V2(PO4)3. These are similar to the XRD analysis, where impurity Li3V2(PO4)3 is formed again in sample LVPF850. However, the formation of impurity at 850 °C is rather different from the sample when the sintering is lower than 800 °C. These can be illustrated by the Scheme 1. When the temperature is between 650 and 800 °C, it is more beneficial to the crystallization of the LiVPO4F. Li3V2(PO4)3 is the accompanying phase because its formation temperature is much lower than LiVPO4F according to the thermodynamics analysis. However, when the temperature rises to 850 °C, the decomposition of the LiVPO4F becomes the dominant reaction compared to the formation of LiVPO4F; hence, more Li3V2(PO4)3 impurity is formed. This also proves that fluoride is not stable at high temperature.
Therefore, it is concluded that the formation mechanisms of impurity Li3V2(PO4)3 at different sintering temperature ranges are quite different. Moreover, there are significant differences in their crystallite structure. This can also be explained by the charge and discharge performance analysis, which were conducted subsequently. The partial curves belonging to impurity is smooth when the sintering temperature is lower than 800 °C. However, the corresponding curve in sample LVPF850 is not smooth but slant.
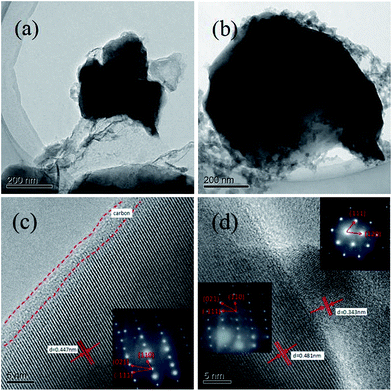
To further observe the morphology and micro structure of the samples, the typical TEM and HRTEM images of the sample LVPF800 and LVPF850 were recorded (Fig. 6). It can be observed that the primary particle size of sample LVPF800 and LVPF850 is about 200 nm and 500 nm. Moreover, we can clearly observe that each particle is coated by a non-uniform pyrolytic carbon layer and a core/shell structure is formed. The thickness of the carbon layer around the crystallite is about 3 nm. There is regular diffraction lattice in sample LVPF800. The layer distance is 0.447 nm. Its SAED pattern is a typical parallelogram, which is the characteristic of triclinic LiVPO4F/C. In case of sample LVPF850, there are two sets of diffraction lattice with different layer distances of 0.481 nm and 0.343 nm. Their SAED images are also rather different. Excluding the similar parallelogram pattern belonging to LiVPO4F/C, the other SAED pattern is attributed to the monoclinic Li3V2(PO4)3 impurity. This indicates that there are not only LiVPO4F crystallites, but also Li3V2(PO4)3 crystallites in the sample LVPF850.
XPS analysis
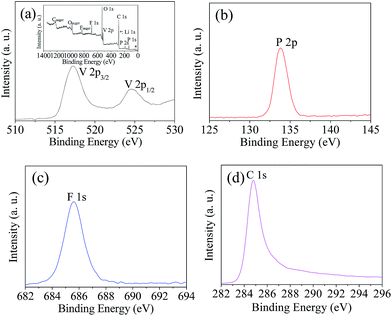
The structure and electrochemical performance of LiVPO4F/C are directly related to the elemental valence of the compositions in the sample obtained after sintering. XPS analysis of the typical sample LVPF800 synthesized at 800 °C was conducted in order to verify the valence of the main constituents. The spectra are illustrated in Fig. 7.It can be found that the binding energy peaks at around 517.2 eV and 524.6 eV are attributed to V 2p3/2 and V 2p1/2, respectively. This indicates that the valence of vanadium ion is +3.9,37 It is inferred that high valence vanadium was reduced effectively to low valence in the reaction. It is clear that the one-step method uses less carbon than the two-step method. This helps to inhibit the harmful effect of excessive carbon black in the cathode material, which is usually used to reduce V5+ at high temperature in the two-step method.
The binding energy peak at 133.8 eV is nearly the same as the P 2p3/2 of PO43−.38 However, it is different from the binding energy of VP (129.1 eV).39 This indicates that there is only one valence state of phosphorus. In addition, it shows that the reduction strength of H2C2O4 at 60 °C is moderate and it does not reduce P5+ in PO43− to P3+. Therefore, the PO43− anion can maintain its stability and the further reduction to VP does not occur. However, a similar substance Fe3P is formed sometimes in the preparation of LiFePO4.40 The binding energy peak of element fluorine at 1s is 685.7 eV, which is very near to 685.9 eV of LiF,41 which is rather different from that of the C–F bond (689.4 eV) in PVDF.42 This implies that F− exists in sample LVPF800 and C–F bonds in PVDF are entirely ruptured.
Furthermore, the carbon binding energy peak is closely attributed the highly oriented pyrolytic graphite (284.8 eV),43 which is a type of pyrolytic carbon. It is also far away from the carbon in H2C2O4 (289.9 eV) and PVDF (689.4 eV).42,44 This indicates that the carbonaceous materials are completely pyrolyzed and pyrolytic carbon with high conductivity is formed. This is beneficial to the formation of an excellent conductive network in the LiVPO4F/C cathode.
It can be concluded from the above analysis that the elemental components in LiVPO4F/C are in their appropriate valence. Therefore, triclinic LiVPO4F/C is successfully synthesized.
Electrochemical performances
The electrochemical performances of LiVPO4F/C cathode synthesized at different sintering temperatures are studied at various rates, in which 1C represents the current density of 156 mA g−1.45 The initial discharge curves of cathode LiVPO4F/C are presented in Fig. 8. It can be observed that there are four plateaus in the plots of sample LVPF650 at 4.2 V, 4.1 V, 3.7 V and 3.6 V. The potential plateau at around 4.2 V is attributed to the typical extraction and insertion characteristic of lithium ions of LiVPO4F/C, which is in accordance with the previous research by Barker et al.3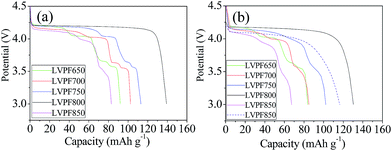 | ||
| Fig. 8 Initial discharge curves of samples at 0.2C (a), 1C (b) and the curve of sample LVPF800 at 5C (dash line in (b)). | ||
Moreover, the other three plateaus are attributed to the formation of impurity Li3V2(PO4)3/C.46 It should be noted that these plateaus are short and the specific capacity of LVPF650 is only 92.1 mA h g−1, which is much lower than the theoretical capacity of LiVPO4F (156 mA h g−1) and Li3V2(PO4)3 (132 mA h g−1).2,19 This implies that the above two crystallites are far away from the well-developed structure.
The discharge plateau can remain stable when the temperature reaches 700 °C. Furthermore, the section of plateau belonging to LiVPO4F/C is elongating and the specific capacity increases to 102.1 mA h g−1. This indicates that LiVPO4F crystallite becomes increasingly regular and the crystallinity degree is also enhanced. When the sintering temperature reaches 750 °C, the plateau of LiVPO4F/C at around 4.2 V is lengthened and the corresponding capacity increases to 74.6 mA h g−1 compared to the samples LVPF650 (43.8 mA h g−1) and LVPF700 (59.9 mA h g−1). The plateaus (I, II and III) belonging to impurity decrease evidently. This is directly related to the dropping of the mole fraction of Li3V2(PO4)3/C in LiVPO4F/C. From the viewpoint of electrochemical reaction, it can also be concluded that Li3V2(PO4)3/C is the accompanying phase in the preparation of LiVPO4F/C, which is already proved in the former analysis.
There is only one discharge plateau at 4.2 V in sample LVPF800 and the plateaus of Li3V2(PO4)3 vanish entirely. The discharge plateau is very stable and the discharge capacity (139.3 mA h g−1) is close to the theoretical capacity of LiVPO4F. It should be noted that there is 11.76 wt% pyrolytic carbon, which is electrochemically inactive and will not contribute to the discharge capacity of LiVPO4F/C. If the content of residual carbon is eliminated, the discharge capacity of LiVPO4F crystallite in sample LVPF800 is about 157.9 mA h g−1 and is even higher than the theoretical capacity. This results from the nonuniform distribution of carbon in the sample. However, the inert pyrolytic carbon is indispensible to the LiVPO4F/C cathode. It should be noted that pure LiVPO4F is nearly an insulator owing to its poor conductivity (10−11 S cm−1).47 The charge and discharge experiments of pure LiVPO4F without carbon cannot be conducted and the specific capacity is very low. However, the conductivity of LVPF800 rises to 10−3 S cm−1 as it changes from insulator to semiconductor. Only in this condition, it delivers a satisfactory electrochemical performance.
The reversible electrochemical redox reaction in the charge and discharge processes of the LiVPO4F/C cathode take place according to the following eqn (11).
| LiV3+PO4F ↔ Li1−xV4+PO4F + xLi+ + e− | (11) |
The reaction is related to the redox couple of V3+/V4+, i.e., the extraction and insertion of lithium ions from or into triclinic LiVPO4F crystallite. In the full discharged state, i.e., when the extraction degree of lithium ions is 100%, the lattice of VPO4F formed is near to that of LiVPO4F and the change in volume is only 3%. This implies that the lattice structure is rather stable. The covalent bond between stable PO43− and the strongest electronegativity element F is much greater than that of other cathodes. This improves the insertion potential of lithium ions to 4.2 V, which is superior to LiMn2O4, LiNi1−x−yCoxMnyO2 and LiFePO4.2,6
However, the plateau of sample LVPF850 at around 4.2 V becomes short and the plateau of impurity Li3V2(PO4)3/C reappears. This is due to the evaporation of fluorine according to eqn (10) and it is different from the samples prepared at 650, 700 and 750 °C. The discharge curve of impurity becomes slant because the crystallite is imperfect and the degree of crystallinity is low.
The rate performances of the LiVPO4F/C samples enhanced with an increase in the sintering temperature and most excellent performances are observed at 800 °C. Then, it drops significantly at 850 °C and it is even worse than that at 650 °C. The discharge capacity of sample LVPF800 at 1C is 130.3 mA h g−1, which is much larger than other samples. The capacity at 5C is 116.5 mA h g−1, which proves to be an excellent value compared with the literature.31
It is noted that the residual carbon in LVPF800 is 11.76 wt%. It is much lower than the traditional two-step reduction, in which the addition of carbon is about 20–50 wt%.4,12,31 Assuming that if the structure, real density and tap density of pyrolytic carbon and LiVPO4F in this study are similar to those reported in literature and the tap density of LiVPO4F/C is primarily determined by the content of residual carbon with low density, it is understandable that the tap density of LVPF800 will be evidently higher than the samples prepared by the two-step method.
The volumetric energy density (VED), which is an important index for the cathode in lithium ion batteries, can be calculated from eqn (12) and (13). In the equations, the symbols W, V, I, T, Q, U, D, m, c, ρ and A correspond to work, volume, current intensity, time, capacity, voltage, specific discharge capacity, mass, carbon content percentage, density and coefficient, respectively.
| VED = W/V = UIT/V = UQ/V = UDm(1 − c)/(m/ρ) = ρUDm(1 − c)/m = Aρ(1 − c) | (12) |
| VED = Aρ(1 − c) | (13) |
For the sake of simplicity, the volume of the cathode active material is applied to substitute the volume of batteries. Assuming that the voltage and discharge capacities of the samples prepared by the one-step or two-step method are nearly the same, it can be found that the volumetric energy density of LVPF800 will be significantly larger than that prepared by the traditional two-step method. This is also the advantage of the one-step method used in the study.
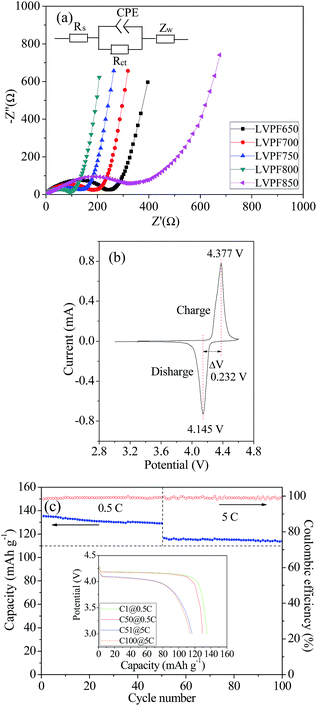
The electrochemical impedance spectra of the LiVPO4F/C samples are illustrated in Fig. 9(a and b). They have been fitted according to the given equivalent circuit in the figure and the results are listed in Table 2.
| Samples | Rct (Ω) | i0 (mA) |
|---|---|---|
| LVPF650 | 234.6 | 0.071 |
| LVPF700 | 183.9 | 0.091 |
| LVPF750 | 122.3 | 0.137 |
| LVPF800 | 96.8 | 0.172 |
| LVPF850 | 378.1 | 0.044 |
It can be noted that there are only depressed semi-circles in the high frequency region and an inclined line in the low frequency region. The charge transfer resistance, Rct, in sample LVPF650, which represents the transfer process of charge, is very large (234.6 Ω). With an increase in sintering temperature, the resistance of the charge transfer process decreases gradually and reaches a minimum value of 96.8 Ω in sample LVPF800. This implies that it is charge-transfer occurs easily in sample LVPF800.
However, the transfer charge resistance of sample LVPF850 rises to 378.1 Ω, which is nearly three times larger than that of sample LVPF800. From the SEM images, we can observe that there are impurity Li3V2(PO4)3/C particles with large size. It is well known that the larger the particle size of the cathode, the slower will be the diffusing speed of charge. Therefore, it is understandable that the charge-transfer resistance of sample LVPF850 is much higher than that of sample LVPF800.
It can be noted that the variation in exchange current i0 is similar to that in rate performances, which is inverse to the charge transfer resistance according to eqn (14).
| i0 = RT/nFRctS | (14) |
It is known that the larger the exchange current, the better will be the rate performance. The exchange current of sample LVPF800 is 0.172 mA, which is larger than other samples. Thus, we can understand that the rate performances of sample LVPF800 are excellent. The electrode kinetics parameters make an appropriate interpretation of the rate performances of cathode LiVPO4F/C.
The cyclic voltammogram of sample LVPF800 at the scanning speed of 0.1 mV s−1 is presented in Fig. 9(c). It can be observed that there is one pair of oxidation (charge) and reduction reaction (discharge) peaks in the figure. This can be interpreted by the reaction presented in eqn (11). The peak shape is symmetric and the intensity is high. The peak potentials are 4.377 V, and 4.145 V and the potential gap is as low as 0.232 V. This indicates that the reversibility in the electrochemical reaction in sample LVPF800 is very high. Thus, the charge and discharge reactions will be completed in a short time and rate performances will be satisfactory.
The cyclic performances of sample LVPF800 at 0.5C and 5C are illustrated in Fig. 9(c). From the insertion discharge curves, we can find that the discharge profiles of sample LVPF800 do not transform evidently after the 50 charge and discharge cycles at each rate of 0.5C or 5C. The profiles can also remain stable and the potential plateaus are very smooth. The only difference is that the capacity decreases slightly. It can be found that the discharge capacity at 0.5C is 135.3 mA h g−1, which decreases to 129.2 mA h g−1 in the 50th cycle. The specific capacity at 5C drops slowly from 116.5 mA h g−1 (51th cycle) to 114.0 mA h g−1 (100th cycle). The capacity retentions at 0.5C and 5C are 95.49% and 97.85%. Simultaneously, the charge and discharge efficiencies at 0.5C and 5C are clearly greater than 98%. Sample LVPF800 delivers an excellent reversibility of the crystallite structure in the extraction and insertion of lithium ions. Therefore, it is concluded that the sample LVPF800 synthesized by the novel one-step method in this study possesses excellent cyclic performances.
Conclusions
In this study, LiVPO4F/C cathode was successfully synthesized by a novel one-step method at an elevated temperature of 60 °C.The one-step method is more energy saving than the traditional two-step carbothermal reduction. This is because it contains only one section of high temperature treatment. Moreover, the content of the residual carbon is low because the high valence vanadium was already reduced to low valence by chemical reduction. It is reduced in a PTFE beaker by magnetic stirring and this does not bring metal impurity from stainless steel media in the ball milling procedure. This is beneficial to the electrochemical performances of the cathode.
The reaction thermodynamics and kinetics of this method were investigated. The activation energy is 208.9 kJ mol−1. The transformation behavior of the crystallite and structure were investigated. The elements in LVPF800 are in their appropriate valence. The impurity Li3V2(PO4)3/C is the accompanying phase and can only be eliminated by maintaining the sintering temperature at 800 °C. The as-obtained sample LVPF800 exhibits excellent rate and cyclic performances. This method possesses an impressive future in the synthesis of LiVPO4F/C.
Conflicts of interest
There are no conflicts to declare.Acknowledgements
This work was supported by the National Natural Science Foundation of China (No. 51472082, 51672079, 51372079).References
- J. Barker, M. Y. Saidi and J. L. Swoyer, J. Electrochem. Soc., 2003, 150, A1394–Al398 CrossRef CAS.
- J. Barker, R. K. B. Gover, P. Burns, A. Bryan, M. Y. Saidi and J. L. Swoyer, J. Power Sources, 2005, 146, 516–520 CrossRef CAS.
- H. Huang, T. Faulkner, J. Barker and M. Y. Saidi, J. Power Sources, 2009, 189, 748–751 CrossRef CAS.
- X. Sun, Y. Xu, G. Chen, P. Ding and X. Zheng, Solid State Ionics, 2014, 268, 236–241 CrossRef CAS.
- R. Ma, J. Shu, L. Hou, M. Shui, L. Shao, D. Wang and Y. Ren, Ionics, 2013, 19, 725–730 CrossRef CAS.
- R. K. B. Gover, P. Burns, A. Bryan, M. Y. Saidi, J. L. Swoyer and J. Barker, Solid State Ionics, 2006, 177, 2635–2638 CrossRef CAS.
- F. Zhou, X. Zhao and J. R. Dahn, Electrochem. Commun., 2009, 11, 589–591 CrossRef CAS.
- Y. Piao, C. K. Lin, Y. Qin, D. Zhou, Y. Ren, I. Bloom, Y. Wei, G. Chen and Z. Chen, J. Power Sources, 2015, 273, 1250–1255 CrossRef CAS.
- M. V. Reddy, G. V. S. Rao and B. V. R. Chowdar, J. Power Sources, 2010, 195, 5768–5774 CrossRef CAS.
- B. Zhang, Y. D. Han, J. C. Zheng, C. Shen, L. Ming and J. F. Zhang, J. Power Sources, 2014, 264, 123–127 CrossRef CAS.
- R. Ma, L. Shao, K. Wu, M. Shui, D. Wang, J. Pan, N. Long, Y. Ren and J. Shu, ACS Appl. Mater. Interfaces, 2013, 5, 8615–8627 CAS.
- Y. Li, Z. Zhou, X. P. Gao and J. Yan, J. Power Sources, 2006, 160, 633–637 CrossRef CAS.
- Q. Zhang, S. Zhong, L. Liu, J. Liu, J. Jiang, J. Wang and Y. Li, J. Phys. Chem. Solids, 2009, 70, 1080–1082 CrossRef CAS.
- S. Zhong, W. Chen, Y. Li, Z. Zou and C. Liu, Trans. Nonferrous Met. Soc. China, 2012, 22, s275–s278 CrossRef.
- J. Liu, S. Zhong, L. Wu, K. Wan and F. Lü, Trans. Nonferrous Met. Soc. China, 2012, 22, s157–s161 CrossRef.
- J. Wang, X. Li, Z. Wang, H. Guo, Y. Zhang, X. Xiong and Z. He, Electrochim. Acta, 2013, 91, 75–81 CrossRef CAS.
- J. X. Wang, Z. X. Wang, L. Shen, X. H. Li, H. J. Guo, W. J. Tang and Z. G. Zhu, Trans. Nonferrous Met. Soc. China, 2013, 23, 1718–1722 CrossRef CAS.
- J. Zheng, B. Zhang and Z. Yang, J. Power Sources, 2012, 202, 380–383 CrossRef CAS.
- C. L. Fan, S. C. Han, K. H. Zhang, L. F. Li and X. Zhang, New J. Chem., 2014, 38, 4336–4343 RSC.
- J. Li, A. Bao and G. Mo, Solid State Ionics, 2014, 264, 45–48 CrossRef CAS.
- Y. Wang, H. Zhao, Y. Ji, L. Wang and Z. Wei, Solid State Ionics, 2014, 268, 169–173 CrossRef CAS.
- Z. Liu, W. Peng, Y. Fan, X. Li, Z. Wang, H. Guo and J. Wang, J. Alloys Compd., 2015, 639, 496–503 CrossRef CAS.
- Z. Liu, W. Peng, Y. Fan, X. Li, Z. Wang, H. Guo and J. Wang, Ceram. Int., 2015, 41, 9188–9192 CrossRef CAS.
- K. Cui, S. Hu and Y. Li, J. Power Sources, 2016, 325, 465–473 CrossRef CAS.
- D. Y. Wang, H. Li, S. Q. Shi, X. J. Huang and L. Q. Chen, Electrochim. Acta, 2005, 50, 2955–2958 CrossRef CAS.
- S. Zhong, Z. Yin, Z. Wang and Q. Chen, Rare Met., 2007, 26, 445–449 CrossRef CAS.
- J. Barker, M. Y. Saidi, R. K. B. Gover, P. Burns and A. Bryan, J. Power Sources, 2007, 174, 927–931 CrossRef CAS.
- J. Wang, X. Li, Z. Wang, H. Guo, Y. Li, Z. He and B. Huang, J. Alloys Compd., 2013, 581, 836–842 CrossRef CAS.
- Z. Liu, W. Peng, K. Shih, J. Wang, Z. Wang, H. Guo, G. Yan, X. Li and L. Song, J. Power Sources, 2016, 315, 294–301 CrossRef CAS.
- X. Sun, Y. Xu, M. Jia, P. Ding, Y. Liu and K. Chen, J. Mater. Chem. A, 2013, 1, 2501–2507 CAS.
- J. Wang, Z. Liu, G. Yan, H. Li, W. Peng, X. Li, L. Song and K. Shih, J. Power Sources, 2016, 329, 553–557 CrossRef CAS.
- S. K. Zhong, F. P. Li, J. Q. Liu, Y. H. Li and X. S. Deng, J. Wuhan Univ. Technol., Mater. Sci. Ed., 2009, 24, 552–556 CrossRef CAS.
- R. Ma, L. Shao, K. Wu, M. Shui, D. Wang, N. Long, Y. Ren and J. Shu, J. Power Sources, 2014, 248, 874–885 CrossRef CAS.
- Z. Xiong, G. Zhang, J. Xiong, X. Yang and Y. Zhang, Mater. Lett., 2013, 111, 214–216 CrossRef CAS.
- P. Zhang, X. Li, Z. Luo, X. Huang, J. Liu, Q. Xu and X. Ren, J. Alloys Compd., 2009, 467, 390–396 CrossRef CAS.
- J. Barker, R. K. B. Gover, P. Burns, A. Bryan, M. Y. Saidi and J. L. Swoyer, J. Electrochem. Soc., 2005, 152, A1776–A1779 CrossRef CAS.
- R. Gopalakrishnan, B. V. R. Chowdari and K. L. Tan, Solid State Ionics, 1992, 53–56, 1168–1171 CrossRef CAS.
- L. M. Cornaglia and E. A. Lombardo, Appl. Catal., A, 1995, 127, 125–138 CrossRef CAS.
- C. E. Myers, H. F. Franzen and J. W. Anderegg, Inorg. Chem., 1985, 24, 1822–1824 CrossRef CAS.
- P. S. Herle, B. Ellis, N. Coombs and L. F. Nazar, Nat. Mater., 2004, 3, 147–152 CrossRef CAS PubMed.
- K. Hamrin, G. Johansson, U. Gelius, C. Nordling and K. Siegbahn, Phys. Scr., 1970, 1, 277–280 CrossRef CAS.
- D. T. Clark, W. J. Feast, D. Kilcast and W. K. R. Musgrave, J. Polym. Sci., Part A: Polym. Chem., 1973, 11, 389–411 CrossRef CAS.
- G. Witek, M. Noeske, G. Mestl, S. Shaikhutdinov and R. J. Behm, Catal. Lett., 1996, 37, 35–39 CrossRef CAS.
- U. Gelius, P. F. Heden, J. Hedman, B. J. Lindberg, R. Manne, R. Nordberg, C. Nordling and K. Siegbahn, Phys. Scr., 1970, 2, 70–80 CrossRef CAS.
- Z. Liu, W. Peng, Z. Xu, K. Shih, J. Wang, Z. Wang, X. Lv, J. Chen and X. Li, ChemSusChem, 2016, 9, 1–8 CrossRef.
- J. Barker, H. Huang, J. L. Swoyer and G. Adamson, Electrochem. Solid-State Lett., 2002, 5, A149–A151 CrossRef.
- P. F. Xiao, M. O. Lai and L. Lu, Solid State Ionics, 2013, 242, 10–19 CrossRef CAS.
| This journal is © The Royal Society of Chemistry 2018 |

