 Open Access Article
Rapid quantitation of multiple ions released from HeLa cells during emodin induced apoptosis by low-cost capillary electrophoresis with capacitively coupled contactless conductivity detection
Jing Zhanga,
Xuan Weib,
Yuanhang Wangc,
Bo Rena,
Litao Zhaoa,
Zhaoyan Wang *a and
Qiaosheng Puc
aSchool of Pharmacy, Lanzhou University, Lanzhou 730000, China. E-mail: wangzhy@lzu.edu.cn
bDepartment of Chemistry, Tonghua Normal University, Tonghua, 134002, China
cCollege of Chemistry and Chemical Engineering, Lanzhou University, Lanzhou 730000, China
First published on 18th May 2018
Abstract
Change in cation concentration, including that of potassium and sodium, is characteristic of apoptosis, therefore it is significant to detect cation concentration changes. In this work a rapid, sensitive, and practical method was developed for the determination of Na+ and K+ concentration in HeLa cells during emodin induced apoptosis by a low-cost capillary electrophoresis device with capacitively coupled contactless conductivity detection (CE-C4D). Under the optimized conditions, both ions were baseline separated in 4 min with 40 mM MES/40 mM His containing 1 mM 18-crown-6 as the separation buffer at pH 6.0. The limit of detections (LODs) and limit of quantifications (LOQs) were 0.47–1.15 μM and 1.58–3.86 μM, respectively. The precision for migration times and peak areas was below 0.56% and 3.74%, respectively. The data proved that the concentration of cations in cells can be accurately quantified. It was found that the K+ concentration decreased from 82.2 μM to 52.7 μM, and the Na+ concentration increased from 62.4 μM to 127.2 μM during the process of apoptosis when the cell density was 1 × 10⁵ cells per mL. The low-cost CE-C4D provides a convenient way to decipher the interaction of Na+ and K+ in the regulation of cell apoptosis.
Introduction
Apoptosis is a process of programmed cell death which maintains homeostasis and is controlled by genes.1 It is essential for the maintenance of embryonic development, immune system function, and tissue homeostasis in multicellular organisms.2–4 The deregulation of cell apoptosis leads to many pathological conditions such as cancer, neurodegenerative diseases, atherosclerosis, autoimmune diseases, and viral infection.3,5 In recent years, induction of target cell apoptosis has become one of the important mechanisms by which anticancer drugs eliminate precancerous lesions or tumor cells.6–9 Therefore apoptosis research, for the purpose of understanding the pathogenesis of disease and treatment, is very important.Cells undergoing apoptosis generally show characteristic biochemical changes, including cell volume decrease, phosphatidylserine valgus, DNA fragmentation, chromatin condensation, and so on.10 Studies have shown that intracellular cation migration plays an important role in the process of apoptosis, namely, that a decrease in intracellular potassium concentration can promote apoptosis. Apoptosis is inhibited when K+ efflux is prevented, and the cationic imbalance during apoptosis is accompanied by an increase in Na+ concentration and a decrease in K+ concentration.11–15 The morphological changes in the apoptosis process can be observed directly via microscopy, but the quantitative analysis of cellular ions cannot be performed so easily. Up until now, some techniques have been reported for ion concentration detection in cells, including energy dispersive X-ray microanalysis (EDXMA),16 atomic absorption spectroscopy,17,18 radioactive ion analogs,19 nuclear magnetic resonance (NMR),20 flow cytometry,11,21 and laser-induced fluorescence detection (LIF).22,23 These methods have their advantages and disadvantages, such as flow cytometry and microchip electrophoresis with LIF having a high sensitivity and high detection speed, however the cations need to be labelled before analysis due to the lack of chromophore groups, and EDXMA and NMR are expensive and their operation not so convenient. Therefore, a simple and rapid method for the determination of intracellular ion concentration changes in apoptosis is necessary.
Capillary electrophoresis (CE) is an efficient and inexpensive analytical technique that offers an attractive alternative to traditional methods. Capacitively coupled contactless conductivity detection (C4D) is a relatively new approach for ion detection,24,25 and has been used successfully in the determination of inorganic cations in different kinds of samples.26–31 Herein we describe a simple and fast method for the determination of cations in cells at different stages of apoptosis with CE-C4D. The effects of experimental conditions such as pH, concentration of background electrolyte, and separation voltage were systematically investigated with ammonium, potassium, calcium, sodium, and magnesium as model analytes. Under the optimal conditions, the concentrations of K+ and Na+ in cells were determined successfully, and the reproducibility and precision were found to be satisfactory for the study of the apoptosis process.
Experimental
Reagents and materials
Morpholine ethane sulfonic acid (MES, ≥99.5%) and L-histidine (His, 99%) were purchased from Aladdin Chemistry Co., Ltd. (Shanghai, China). Ammonium chloride, manganese chloride and sodium hydroxide were obtained from Tianjin Guangfu Science and Technology Development Co., Ltd. (Tianjin, China). Potassium chloride was a product of the Chengdu Union Chemical Reagent Research Institute (Chengdu, China). Anhydrous calcium chloride was obtained from the Tianjin Bodi Chemical Co., Ltd. (Tianjin, China). Sodium chloride was obtained from the Chengdu Kelon Chemical Reagent Plant (Chengdu, China), anhydrous magnesium chloride was a product of the Tianjin Guangfu Fine Chemical Research Institute (Tianjin, China). D-Glucose was purchased from the Xi’an Zhoudingguo Chemical Reagent Factory (Xi’an, China). All reagents were of analytical grade. All solutions were filtered through 0.22 μm membranes (Shanghai Xinya Purification Materials Factory, Shanghai, China) and degassed in an ultrasonic bath for 5 min before use. Deionized water was taken from a Milli-Q water purification system (Millipore) for solution preparation.RPMI-1640, penicillin-streptomycin, and trypsin were products of GE Healthcare Life Sciences HyClone Laboratories of the United States, and the fetal bovine serum was obtained from Zhejiang Tianhang Biotechnology Co., Ltd. (Zhejiang, China). Emodin was purchased from J&K Chemical Co. (Beijing, China); it was dissolved in dimethyl sulphoxide (DMSO) at a concentration of 40 mM to form a stock solution, which was then diluted to the final concentration with RPMI 1640 full culture medium when used. 3-(4,5-Dimethyl-thiazol-2-yl)-2,5-diphenyltetrazolium bromide (MTT) was obtained from Sigma Chemical Co. (USA). The Annexin V-FITC apoptosis detection kit was obtained from the Beyotime Institute of Biotechnology (Shanghai, China).
Apparatus
All electropherograms were acquired using a laboratory-made CE device with a capacitively coupled contactless conductivity detector, which contained a HV power module, a DDS signal generator and a laboratory-built low-cost C4D unit (Fig. 1). The electrodes were built in the same way as described by Zhang et al.32, except that a much smaller shielding box (4.2 × 2.5 × 2.5 cm) was used. All of these parts are small enough to be accommodated on a normal biological research platform. The signal was digitized by a USB-6003 data acquisition card of NI together with the control of the high voltage through a Labview program (National Instruments, Austin, TX, USA). The RT-6100 ELISA analyzer was obtained from Shenzhen Rayto Life Science Co., Ltd (Shenzhen, China) and the flow cytometer was obtained from LSRFortessa (BD Biosciences, San Jose, CA, USA). The H1650-W Centrifuge was purchased from Hunan Xiangyi Laboratory Instrument Development Co., Ltd (Hunan, China).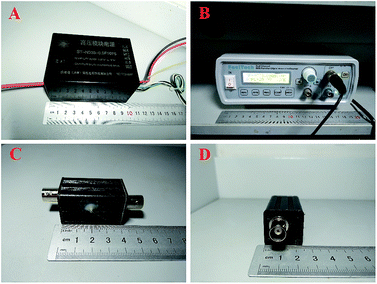 | ||
| Fig. 1 A schematic illustration of the CE-C4D system: (A) HV power module; (B) DDS signal generator; (C) and (D) the detection cell. | ||
The fused silica capillary was obtained from Xinnuo Spectrum Co., Ltd (Hebei, China). New fused silica capillaries were conditioned by rinsing with 1 M NaOH for 30 min, and deionized water for 10 min prior to first use. Prior to everyday use, the capillary was rinsed with 1 M NaOH for 10 min, then with deionized water for 5 min, and finally with the background electrolyte (BGE) for 5 min. The fused-silica capillary used in all experiments was 54 cm long (42 cm to the detector) and had a 50 μm internal diameter; the samples were injected at 1 kV for 10 s, and the volume was about 2.5 nL. In the progress of separation, glass bottles of 1.5 mL were used as the cathode and anode reservoirs. MES/His was used as the running buffer.
Cell culture
The human cervical cancer HeLa cells were cultured with RPMI 1640 medium containing 10% (v/v) fetal bovine serum, 100 U mL−1 penicillin, and 100 μg mL−1 streptomycin. Cells were incubated at 37 °C in a humidified incubator in an atmosphere of 5% CO2 and were passaged every 2–3 days.Preparation of cell lysates
Firstly, the cells were digested with trypsin, and an appropriate amount of cell culture medium was added and mixed well. The cell suspension was centrifuged at 1000 rpm for 5 min and the supernatant was discarded, after which the cells were re-suspended in 5% glucose solution and counted. Secondly, the cells in the control group and the dosing group were adjusted to the same concentration of 105 cells per ml and then washed three times with 5% glucose solution to remove the extracellular matrix. After that, 1% Triton X-100 was added with a volume ratio of 1![[thin space (1/6-em)]](https://www.rsc.org/images/entities/char_2009.gif) :
:![[thin space (1/6-em)]](https://www.rsc.org/images/entities/char_2009.gif) 20 for 10 minutes to complete the cell lysis. Finally, the lysates were centrifuged at 10
20 for 10 minutes to complete the cell lysis. Finally, the lysates were centrifuged at 10![[thin space (1/6-em)]](https://www.rsc.org/images/entities/char_2009.gif) 000 rpm for 8 min, and the supernatant was analysed directly. In order to avoid influence on the determination by other substances in cell, the cell lysates were used as a blank matrix after removal of the cations by electrolysis. Furthermore, in order to eliminate the effect of cations on detection, all of the solutions including the water were electrolyzed to remove the cations.
000 rpm for 8 min, and the supernatant was analysed directly. In order to avoid influence on the determination by other substances in cell, the cell lysates were used as a blank matrix after removal of the cations by electrolysis. Furthermore, in order to eliminate the effect of cations on detection, all of the solutions including the water were electrolyzed to remove the cations.
MTT assay for cell proliferation
HeLa cells (100 μL of cell suspension per well) in logarithmic phase were seeded into a 96-well plate at 6 × 10⁴ cells per well and incubated at 37 °C for 24 h. Then they were treated with emodin (0, 60, 80, 100, 120 and 140 μM), each for 24 h and 48 h. Due to the emodin being dissolved in DMSO, in order to eliminate the effect of different concentrations of DMSO on cell proliferation, a certain amount of DMSO was added to ensure each sample remained at the same concentration, when the emodin concentration was lower than 140 μM. After that, the supernatant medium was removed, and 100 μL of culture medium and 20 μL of 5 mg mL−1 MTT dye were added and cultured for another 4 h. The supernatant was discarded, and purple-colored precipitates of formazan were dissolved in 100 μL of DMSO by gently shaking for 5 min. Finally, the optical density (OD) value at 492 nm was measured by a microplate reader, and the relative survival rate of cells was calculated from the mean of 6 well OD values. The relative cell survival rate was calculated according to eqn (1), and the error is expressed as the standard deviation (SD).
 | (1) |
Quantification of apoptosis by flow cytometry
In this experiment, the apoptotic condition was detected by flow cytometry with the Annexin V-FITC apoptosis detection kit. Briefly, two groups of HeLa cells were incubated with 0 μM and 100 μM of emodin for 24 h and 48 h, respectively. Then the cells were digested with trypsin and centrifuged to remove the supernatant, and 195 μL of Annexin V-FITC binding buffer was added to re-suspend the cells. Then 5 μL of Annexin V-FITC staining solution and 10 μL of propyl iodide were added, followed by incubation at room temperature for 20 minutes, and analysis by flow cytometry.Results and discussion
Cell apoptosis induced by emodin
HeLa cells were incubated with different concentrations of emodin (0, 60, 80, 100, 120 and 140 μM) for 24 h and 48 h, and the relative viability of cells was determined by an MTT colorimetric assay (Fig. 2). The results show that the relative survival rate of the administered groups were significantly lower than those with an emodin concentration of 0 μM (control group), and that when the cell was treated with 100 μM emodin for 48 h, the survival rate was suppressed effectively.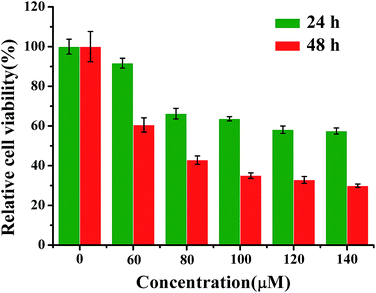 | ||
| Fig. 2 The relative cell activity was measured via the MTT method at different concentrations and different times after treatment with emodin (n = 6, mean value ± SD). | ||
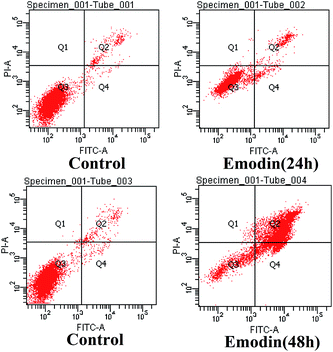
In order to further quantitatively determine the apoptotic rate of HeLa cells induced by emodin, 0 μM and 100 μM emodin was incubated with HeLa cells for 24 h and 48 h, respectively. After staining with Annexin V-FITC and PI reagent, the cells were analyzed by flow cytometry. From Fig. 3, we found that less than 5% of the cells were apoptotic in the control group, and that the apoptotic rates of the cells treated with emodin for 48 h reached 85.9% (Q2 + Q4). Based on these results, we selected 100 μM emodin to induce the apoptosis of HeLa cells with an incubation of 48 h, and used the model to verify the applicability of CE-C4D in the determination of ion concentration in this process.
Optimization of the CE separation
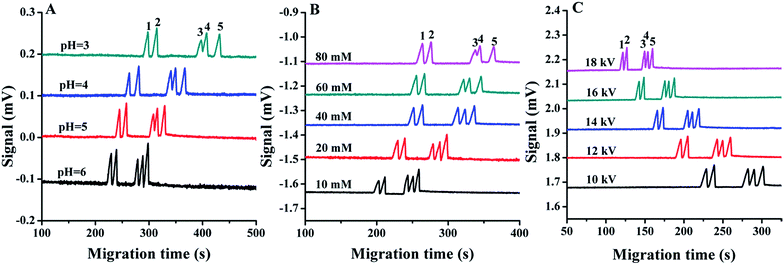
Hydrodynamic injection and electrokinetic injection are two common injection methods in CE. With EK injection, a higher signal-to-noise ratio is achieved by preconcentration of the analytes during sample introduction.33 In this work, the effects of gravity injection and electrokinetic injection on the separation were examined, and the results showed that the sensitivity is much higher for electrokinetic injection at 1 kV for 10 s, in contrast to gravity injection at 10 cm for 10 s, therefore electrokinetic injection was adopted. Due to the dependence of the injected amount of analytes on the ionic strength of the sample, internal standards were frequently used to correct the deviation. Mn2+ was selected as the internal standard because normally it does not exist in the cell and can be well resolved from other cations.The effect of pH on the separation was examined in the range 3.0–6.0 and acetic acid was used to adjust the pH. With the increase of the buffer pH value, the separation time became shorter, and the separation efficiency was improved (Fig. 4A). At pH 6.0, all of these cations were baseline separated. Since alkaline solution may introduce cations that would interfere with the ion measurement, a higher pH was not attempted and pH 6.0 was selected for the following experiment.
The concentration of the electrolyte is important to achieving a good resolution; in this experiment, the influence of the buffer electrolyte concentration was examined in the range 10–80 mM. As shown in Fig. 4B, the migration time of all cations was prolonged with an increase in buffer concentration, which is probably due to the thinner electric double layer with an increase in ionic strength, which decreases the electroosmotic flow, and improves the separation. The best resolution was obtained in 40 mM MES/His. Therefore, 40 mM MES/His containing 1 mM 18-crown-6 was selected as the running buffer.
To achieve fast analysis, the influence of running voltage on the separation behaviour was investigated in the range 10–18 kV. The migration speed of all ions is increased and the column efficiency is improved with the increase in separation voltage (Fig. 4C). However, as the highest voltage provided by the power supply module in this experiment is 20 kV, for the reliable running with other biological research facilities, a higher voltage was not adopted, and 18 kV was selected for other experiments. Under this condition, all the cations were baseline separated. The resolution between Ca2+ and Na+ was 1.52 under the final optimized separation conditions, and that between Na+ and Mg2+ was 1.69. The analysis takes about 4 min, which is fast enough for monitoring the process for 24 h or longer. If a shorter capillary is used, the analysis can be quicker.
Performance and application
A series of different concentrations of sodium and potassium were used as the standard mixture for multiple regression analyses, and all data obtained from the electropherograms are listed in Table 1. Both K+ and Na+ show a good linear relationship in the range 50–500 μM. The intra-day and inter-day relative standard deviations of the peak areas were in the range 1.57–3.74%, and those for the migration time were in the range of 0.48–0.56%. The detection limit (S/N = 3) of these cations in the blank sample matrix was about 1.2 μM, and the specific data are presented in Table 1, and the maximal value of peak-to-peak noise of the baseline is 0.002 mV, which is good enough for the measurement of potassium and sodium ions in cell samples.| Characteristics | K+ | Na+ | |
|---|---|---|---|
| Regression equation | y = 0.0351x − 0.0747 | y = 0.0207x + 0.9831 | |
| R2 | 0.996 | 0.993 | |
| Range (μM) | 50–500 | 50–500 | |
| LODs (μM) | 0.47 | 1.15 | |
| LOQs (μM) | 1.58 | 3.86 | |
| Intra-day RSD % (n = 6) | Migration time | 0.48 | 0.56 |
| Peak area | 1.57 | 2.15 | |
| Inter-day RSD % (n = 3) | Migration time | 0.51 | 0.56 |
| Peak area | 2.7 | 3.74 | |
The method was applied to the determination of the cations in cells during emodin induced apoptosis. As shown in Fig. 5, after 48 h of incubation with emodin, the potassium ion concentration decreased from 82.2 μM to 52.7 μM, and the sodium ion concentration increased from 62.4 μM to 127.2 μM when the cell density was 1 × 10⁵ cells per mL. At the same time, the concentrations of NH4+, Ca2+ and Mg2+ in the cells also changed. The results revealed the simultaneous change in concentration of multiple ions during cell apoptosis, which is consistent with previous reports.14,15,34
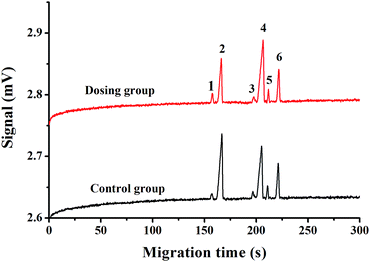 | ||
| Fig. 5 Electropherogram of cells in the control and dosing groups with a cell density of 105 cells per ml. Peak identification: (1) NH4+, (2) K+, (3) Ca2+, (4) Na+, (5) Mg2+, and (6) Mn2+ (internal standard, 200 μM). BGE: 40 mM MES/His containing 1 mM 18-crown-6 (pH 6.0), injection voltage: 1 kV for 10 s, separation voltage: 18 kV. Other conditions are the same as in Fig. 4. | ||
Accordingly, the changes of ions in apoptosis cells can also indicate the state of the cells, and the low cost CE-C4D device used here provides an easy way to monitor ions without the use of any labelling reagents and sophisticated instruments.
Conclusions
In this paper, an effective and simple method based on low-cost CE-C4D for the determination of the concentration was established and tested with a model of apoptosis induced by emodin in HeLa cells. The results confirmed a decrease in the concentration of potassium ions and an increase of sodium ions during cell apoptosis. The device is composed of stand-alone parts of a high voltage power supply, a signal generator, and the C4D module, and all of them are small – the biggest is the signal generator with a size of 19.0 × 17.5 × 7.0 cm, so it can be easily accommodated with a biological platform such as a microscope or a cell culture system. The advantage of a CE based system is the very small sample volume required and the potential for single cell analysis. It can avoid the use of expensive labelling reagents and expensive instruments. The separation is fast, normally within 4 min, so it may be used for on-line monitoring of the change of ions during the whole process, if an automatic sampler is implemented.Conflicts of interest
There are no conflicts to declare.Acknowledgements
The authors are grateful to the Natural Science Foundation of China (No. 21405067, 21527808, 21575054), the Fundamental Research Funds for the Central Universities (lzujbky-2017-199), and the ‘13th 5 year Plan’ Program of the Jilin Education Department (JJKH20170433KJ).References
- D. L. Vaux and S. J. Korsmeyer, Cell, 1999, 96, 245–254 CrossRef PubMed.
- J. F. R. Kerr, A. H. Wyllie and A. R. Currie, Br. J. Cancer, 1972, 26, 239–257 CrossRef PubMed.
- S. J. Riedl and Y. Shi, Nat. Rev. Mol. Cell Biol., 2004, 5, 897–907 CrossRef PubMed.
- M. D. Jacobson, M. Weil and M. C. Raff, Cell, 1997, 88, 347–354 CrossRef PubMed.
- H. Okada and T. W. Mak, Nat. Rev. Cancer, 2004, 4, 592–603 CrossRef PubMed.
- S. W. Fesik, Nat. Rev. Cancer, 2005, 5, 876–885 CrossRef PubMed.
- S. Qian, J. Cao, Y. Yan, M. Sun, H. Zhu, Y. Hu, Q. He and B. Yang, Mol. Cell. Biochem., 2010, 345, 13–21 CrossRef PubMed.
- X. Liu, M. Song, Z. Gao, X. Cai, W. Dixon, X. Chen, Y. Cao and H. Xiao, J. Agric. Food Chem., 2016, 64, 7750–7759 CrossRef PubMed.
- G. Wang, T. Zhang, W. Sun, H. Wang, F. Yin, Z. Wang, D. Zuo, M. Sun, Z. Zhou, B. Lin, J. Xu, Y. Hua, H. Li and Z. Cai, Free Radical Biol. Med., 2017, 106, 24–37 CrossRef PubMed.
- C. D. Bortner and J. A. Cidlowski, Pflugers Arch., 2004, 448, 313–318 CrossRef PubMed.
- C. D. Bortner, F. M. Hughes and J. A. Cidlowski, J. Biol. Chem., 1997, 272, 32436–33442 CrossRef PubMed.
- C. D. Bortner and J. A. Cidlowski, J. Biol. Chem., 2003, 278, 39176–39184 CrossRef PubMed.
- C. D. Bortner and J. A. Cidlowski, Arch. Biochem. Biophys., 2007, 462, 176–188 CrossRef PubMed.
- A. Kondratskyi, K. Kondratska, R. Skryma and N. Prevarskaya, Biochim. Biophys. Acta, 2015, 1848, 2532–2546 CrossRef PubMed.
- S. P. Yu, L. M. T. Canzoniero and D. W. Choi, Curr. Opin. Cell Biol., 2001, 13, 405–411 CrossRef PubMed.
- I. Z. Nagy, G. Lustyik, V. Z. Nagy, B. Zarandi and C. Bertoni-Freddari, J. Cell Biol., 1981, 90, 769–777 CrossRef PubMed.
- C. A. Vidair and W. C. Dewey, Radiat. Res., 1986, 105, 187–200 CrossRef PubMed.
- V. Yurinskaya, T. Goryachaya, I. Guzhova, A. Moshkov, Y. Rozanov, G. Sakuta, A. Shirokova, E. Shumilina, I. Vassilieva, F. Lang and A. Vereninov, Cell. Physiol. Biochem., 2005, 16, 155–162 CrossRef PubMed.
- R. B. Mikkelsen and C. R. Asher, J. Cell. Physiol., 1990, 144, 216–221 CrossRef PubMed.
- A. M. Castle, R. M. Macnab and R. G. Shulman, J. Biol. Chem., 1986, 261, 3288–3294 Search PubMed.
- C. D. Bortner, M. I. Sifre and J. A. Cidlowski, J. Biol. Chem., 2008, 283, 7219–7229 CrossRef PubMed.
- L. Li, P. Li, J. Fang, Q. Li, H. Xiao, H. Zhou and B. Tang, Anal. Chem., 2015, 87, 6057–6063 CrossRef PubMed.
- L. Li, Y. Fan, Q. Li, R. Sheng, H. Si, J. Fang, L. Tong and B. Tang, Anal. Chem., 2017, 89, 4559–4565 CrossRef PubMed.
- A. J. Zemann, E. Schnell, D. Volgger and G. K. Bonn, Anal. Chem., 1998, 70, 563–567 CrossRef PubMed.
- J. A. Fracassi da Silva and C. L. do Lago, Anal. Chem., 1998, 70, 4339–4343 CrossRef.
- P. Kubáň, P. Kubáň and V. Kubáň, Electrophoresis, 2002, 23, 3725–3734 CrossRef.
- P. Tůma, E. Samcová and F. Duška, J. Sep. Sci., 2008, 31, 2260–2264 CrossRef PubMed.
- T. D. Mai and P. C. Hauser, Talanta, 2011, 84, 1228–1233 CrossRef PubMed.
- R. R. Cunha, D. T. Gimenes, R. A. Munoz, C. L. do Lago and E. M. Richter, Electrophoresis, 2013, 34, 1423–1428 CrossRef PubMed.
- J. Sáiz, I. J. Koenka, T. D. Mai, P. C. Hauser and C. García-Ruiz, TrAC, Trends Anal. Chem., 2014, 62, 162–172 CrossRef.
- F. Opekar and P. Tůma, J. Chromatogr. A, 2016, 1446, 158–163 CrossRef PubMed.
- M. Zhang, B. N. Stamos, N. Amornthammarong and P. K. Dasgupta, Anal. Chem., 2014, 86, 11538–11546 CrossRef PubMed.
- Z. Krivácsy, A. Gelencsér, J. Hlavay, G. Kiss and Z. Sárvári, J. Chromatogr. A, 1999, 834, 21–44 CrossRef.
- Y. Jiao, S. Ma, Y. Wang, J. Li, L. Shan, J. Sun and J. Chen, Int. J. Biol. Sci., 2016, 12, 580–593 CrossRef PubMed.
| This journal is © The Royal Society of Chemistry 2018 |

