DOI:
10.1039/C8RA00584B
(Paper)
RSC Adv., 2018,
8, 10907-10913
Insight into the efficient catalytic conversion of biomass to EG and 1,2-PG over W–Ni bimetallic catalyst
Received
20th January 2018
, Accepted 26th February 2018
First published on 19th March 2018
Abstract
In this work, a mesoporous silica microsphere (MSM) was selected as a support to prepare a bimetallic supported catalyst (15% W–5% Ni/MSM) by a co-impregnation method that was simple and easy to conduct. We wished to improve the capability of catalytic conversion of biomass into ethylene glycol (EG) and 1,2-propylene glycol (1,2-PG). 15% W–5% Ni/MSM was examined on microcrystalline cellulose (cellulose) and corn stalks in a one-pot catalytic process, and total yields of EG and 1,2-PG reached up to 82.40 wt% and 62.60 wt%, respectively. This remarkable catalytic performance of W–Ni/MSM catalyst could be attributed to the synergistic effect between the active sites of Ni and W and the unique structure of MSM, which was suitable for mass transfer and metal loading. Based on physicochemical characterizations, the metal component was well-distributed on the surface of the MSM, and the metallic Ni, W and WO3 of the fresh catalyst were converted mainly into NiWO4 during the catalytic conversion of cellulose. To shed light on the reaction mechanism of the catalyzed hydrogenation of biomass, a possible process involving the formation of HxWO3 homogeneous catalysts, cellulose hydrolysis, C–C cleavage and hydrogenation conversion to 1,2-PG and EG was illustrated. Furthermore, the reusability of W–Ni/MSM catalyst was tested and we explored the cause of decreased diols yields. In summary, this work provides important guidance to rationally design effective catalysts for biomass conversion.
1 Introduction
Lignocellulose has been considered as a “clean energy” resource because it could solve the pollution problem and the global warming caused by the consumption of fossil fuels.1,2 Recently, the catalytic conversion of biomass into highly valued chemicals has appealed to researchers. These include ethylene glycol (EG) and 1,2-propylene glycol (1,2-PG), which are very important “platform molecules” with a very large market demand.3–5 Among the strategies of biomass transformation into polyols, one-pot chemical conversion has proved to be a better choice for high efficiency and environmental protection.6–8 Under hydrogen pressure in aqueous solution, cellulose can be converted into smaller molecules directly, which overcomes the effect of the crystalline structure with the linkage of β-1,4-glycosidic bonds and hydrogen bonds.9,10 Fukuoka and coworkers reported that the one-pot conversion of cellulose obtained a 31.0 wt% yield of hexitols on a Pt/Al2O3 catalyst.11 Luo et al. raised the yield of hexitols to 39.3 wt% on a Ru/AC catalyst in the same way.12 These results revealed that the hydrolytic hydrogenation of cellulose into sugar alcohol products over noble metal catalysts exhibited considerable catalytic ability. In addition, Zhang et al. found that the catalytic conversion of cellulose was excellent (65.0 wt% yield of EG) on a supported tungsten carbide catalyst in a one-pot process; this is the “frontline” of the biomass-based energy field because of the distinctive selectivity of EG.13 In this instance, it was found that the activity of the catalyst was improved remarkably by the addition of Ni species to tungsten catalysts, and this catalytic performance was better than that of noble metal catalysts.14–16 Moreover, various supports were exploited to enhance the capability of nickel-tungsten catalysts, including Al2O3, Al2O3–SiO2,17 MOR,18 and SBA-15.19 These results suggested that the synergistic action of the active metal and support had an important impact on the catalytic reaction of cellulose, and could become a promising research direction. However, the study on the reaction pathway of cellulose conversion into polyol was inadequate. As noted above, design of an efficient catalyst and research of the reaction mechanism on the hydrolytic hydrogenation of cellulose into polyols are crucial. When considering interactions between the active site and support, a mesoporous silica microsphere (MSM) is an ideal candidate to design supported W–Ni catalysts because of its uniform mesoporous structure, large specific surface area, and pore volume. In particular, the surface structure of a MSM can play a vital part in good chemical durability and high active area for metal deposition, which promotes the synergistic action of the active metal and MSM.20–23 The active sites of Ni and W could improve stability and capability through loading on the MSM support, which could accelerate the reaction rate of the catalytic conversion of biomass into polyols.
We wished to improve the catalytic performance of Ni–W catalyst and study the reaction mechanism for the direct conversion of biomass into EG and 1,2-PG. Then, microcrystalline cellulose and samples of pretreated corn stalk were subjected to catalyzed hydrogenation under optimal conditions, respectively. Moreover, the recycling test for catalytic activity was done based on the characterizations of a high-pressure reactor, high-performance liquid chromatography (HPLC), X-ray diffraction (XRD) spectroscopy, X-ray photoelectron spectroscopy (XPS), transmission electron microscopy (TEM), scanning electron microscopy (SEM) and the N2 adsorption–desorption.
2 Experimental
2.1 Materials
Microcrystalline cellulose, ammonia metatungstate (AMT) and nickel nitrate hexahydrate [Ni(NO3)2·6H2O] were purchased from Aladdin Chemistry Co. Ltd (China). MSMs were obtained from NewMater Nanotechnology Co. Ltd (China). Corn stalks were from the Helan Ranch in Yinchuan (Ningxia, China). All chemical reagents were of analytic grade. All experiments were carried out in triplicate and mean data are shown.
2.2 Catalyst synthesis
The Ni–W catalyst supported on MSMs was prepared by an impregnation method using an aqueous solution of AMT and Ni(NO3)2·6H2O with stirring for 10 h at room temperature (RT), and the Ni and W loadings were 5.0 wt% and 15.0 wt%, respectively. After impregnation, the samples were dried at 120 °C for 12 h followed by calcination in an air atmosphere at 500 °C for 3 h (ramp rate of 2 °C min−1), and then reduced in a hydrogen atmosphere at 700 °C for 1 h (ramp rate of 1 °C min−1). The catalyst was passivated in a flow of 1% O2/99% N2 for 10 h at RT. Finally, the bimetallic catalyst with catalytic hydrogenation function was obtained and denoted as “15% W–5% Ni/MSM”. A control sample was also obtained.
2.3 Pretreatment on corn stalks
Raw corn stalks were chopped into pieces of size ≈1 cm, milled using a fodder grinder, passed through a sieve (80 mesh), and stored for further treatment. The main composition of the untreated corn stalk was 42.02 wt% cellulose, 15.88 wt% hemicellulose, 12.17 wt% acid-insoluble lignin (AIL), 15.87 wt% acid-soluble lignin (ASL), 3.50 wt% ash, and 9.96 wt% other material. Then, the samples of raw corn stalks were pretreated with H2SO4 and NaOH solution on the reactor. Alkali pretreatment was operated with 2.0 wt% NaOH for 4 h at 80 °C. Acid pretreatment was operated with 5.0 wt% H2SO4 for 6 h at 80 °C. After pretreatment, the mixture was filtered. The solid was washed with deionized water until a neutral pH was reached, and then it was dried in air at 60 °C overnight. This method has been described in previous studies from our research team.24–26
2.4 Catalyst reaction and evaluation
All catalytic experiments were conducted in a stainless-steel autoclave with 100 mL capacity. Initially, 0.3 g of reactant was mixed with catalyst in 60 mL of deionized water and then hydrogen was introduced. The reaction mixture was well-mixed with a magnetic stirrer (900 rpm). After the reaction, the reactor was quenched to RT in an ice water bath. After filtration of solid residues, the aqueous solution was filtered further with a 0.22 μm syringe filter and analyzed by HPLC with a refraction index detector (Shimadzu, Japan) and an InertSustain™ C18 column. Leaching of W and the Ni content of the filtrate obtained from the first run reaction were determined by inductively coupled plasma atomic emission spectroscopy (ICP-AES). The conversion of cellulose was determined by measuring the weight difference of the solid before and after the reaction, assuming that the catalyst weight was unchanged before and after the reaction. The yield and the selectivity of EG and 1,2-PG products were calculated based on the following equation, respectively:| | |
EG yield (wt%) = [(E × V)/(M0 × Xi)] × 100
| (1) |
| | |
1,2-PG yield (wt%) = [(P × V)/(M0 × Xi)] × 100
| (2) |
| | |
Selectivity (EG/%) = (ni × 2/n0) × 100
| (3) |
| | |
Selectivity (1,2-PG/%) = (ni × 3/n0) × 100
| (4) |
where E (mg mL−1) and P (mg mL−1) are EG and 1,2-PG produced during the catalysis, respectively. V (mL) is the total volume of reaction liquid. M0 (mg) is the mass of raw material. Xi (wt%) is the cellulose weight fraction of the raw material. ni is the carbon moles of EG and 1,2-PG products, respectively. n0 is the total carbon moles of converted cellulose.
To evaluate the stability and reusability of the catalyst, the obtained solid was washed thrice using deionized water and dried overnight at 100 °C in a vacuum, followed by calcination at 450 °C in an air atmosphere for 3 h to remove the deposited carbon and to form the precursor. Then, the precursor was reduced in a hydrogen atmosphere.
2.5 Characterization
The XRD pattern of the samples were recorded on a Dmax2200PC (Rigaku, Japan) diffractometer equipped with a Cu Kα1 radiation source (λ = 0.1540 nm), operating at 40 kV and 40 mA. The chemical structure and morphology of the sample were characterized using SEM, TEM and energy-dispersive X-ray (EDX) spectroscopy with a JEM 2010 EX microscope (JEOL, Japan) at an accelerating voltage of 200 kV. The surface chemical compositions of samples were analyzed by XPS by an Escalab 250Xi spectrometer (Thermo Scientific, USA) with Al Kα radiation. The binding energy was referenced to the C 1s peak at 284.8 eV. N2 adsorption–desorption experiments were undertaken at 77 K with an ASAP2010 surface area analyzer (Micrometrics, USA). Specific surface areas were obtained using the Brunauer–Emmett–Teller (BET) method. Pore volumes were calculated from N2 adsorption–desorption isotherms. Pore diameters and size distributions were determined using the Barret–Joyner–Halenda (BJH) method.
3. Results and discussion
3.1 Characterization of catalysts
The XRD spectroscopy patterns of the MSM before and after loading of Ni and W are shown in Fig. 1. The MSM had a broad peak at ≈23°, which is assigned to silica species. The peak remained when tungsten and nickel were added to the support, suggesting that the MSM structure was maintained during catalyst preparation. After loading of Ni and W, the sample showed strong diffraction peaks relevant to the crystal structure of Wolfram (PDF#04-0806) and the characteristic reflections appeared at 2θ at 40.3°, 58.3° and 73.3°, corresponding to the diffractions from (110), (200), and (211) planes, respectively. Three weak peaks at 2θ at 44.36°, 51.59° and 76.0° are subsistent and visible even at low Ni loading. These three peaks correspond to nickel (PDF#04-0850). XRD spectroscopy revealed metallic nickel and tungsten to already being formed on the supported catalyst. The XRD spectroscopy results of the synthesized W–Ni bimetallic catalyst do not mean that both component metals were present in a zero-valence state. Fig. 2 displays the morphologies and microstructures of the MSM and 15% W–5% Ni/MSM catalyst. As shown in Fig. 2(a) and (d), the MSM structure had a smooth surface and regular spherical shape of size ≈300 nm. As compared with the TEM images of the MSM [Fig. 2(b) and (c)] and W–Ni/MSM [Fig. 2(e) and (f)], it is obvious that the species of Ni and W were well distributed on the surface of the MSM. As shown in Fig. 2(g)–(i), a detailed analysis was employed using elemental mapping with EDX spectroscopy, which revealed that Si, Ni and W were highly dispersed on the support. These results implied that the 15% W–5% Ni/MSM catalyst was synthesized, which was in good accordance with the XRD spectroscopy results.
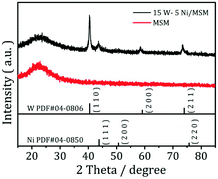 |
| | Fig. 1 XRD patterns of MSMs before and after loading of Ni and W. | |
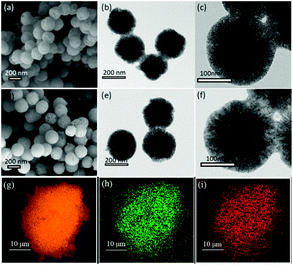 |
| | Fig. 2 Scanning electron microscope, transmission electron microscopy, and energy-dispersive X-ray spectroscopy of MSM and W–Ni/MSM catalyst. (a) SEM and (b, c) TEM of MSM, (d) SEM, and (e, f) TEM of W–Ni/MSM catalyst. EDX elemental mapping images of W–Ni/MSM catalyst, (g) Si, (h) Ni and (i) W. | |
3.2 Catalytic conversion of microcrystalline cellulose on 15% W–5% Ni/MSM
The catalytic conversion of microcrystalline cellulose (cellulose) was examined in a one-pot process. A non-catalytic experiment with cellulose was conducted first to determine the activity in the absence of a catalyst. Cellulose was barely converted into EG (2.63 wt%) and 1,2-PG (2.32 wt%), with conversion of cellulose >75% (Table 1). These data suggested that cellulose was converted mainly into a large fraction of unidentified unsaturated products and dissolved in a solvent lacking the catalytic conversion.13 Under identical conditions, the experiments were also carried out over 5% Ni/MSM, 15% W/MSM and 15% W–5% Ni/MSM catalysts to evaluate the effect of the metal component. Notably, full conversion of cellulose and a diols yield, including EG and 1,2-PG, up to 41.85 wt% were obtained on 15% W–5% Ni/MSM catalyst. Comparison with the diols yield on 5% Ni/MSM (11.00 wt%) and 15% W/MSM (27.97 wt%) suggested that the bimetallic catalyst had excellent catalytic activity with respect to monometallic catalysts. Furthermore, the effect of the amount of catalyst on cellulose conversion to EG and 1,2-PG was investigated (Fig. 3(a)). The diols yield increased rapidly from 41.85 wt% to 82.40 wt% with increasing weight of catalyst from 0.10 to 0.45 g. Remarkably, the EG yield increased from 27.94 wt% to 72.90 wt%. In particular, the selectivity of EG was up to 66.95% but the best selectivity of 1,2-PG was relatively lower (11.84 wt%), which could indicate that selective conversion of cellulose into EG was sensitive over 15% W–5% Ni/MSM catalyst. Also, a greater amount of catalyst means more active sites on the catalyst, which enhanced the contact between the catalyst and cellulose, which is beneficial to efficient catalytic conversion.27 The reason for the good catalytic performance of 15% W–5% Ni/MSM could be attributed to the mesoporous pores and spherical structure of the MSM, and the synergistic effect of active metal (W and Ni component) and support, which can increase the rate of mass-transfer on the catalyst surface and decrease carbon deposition.22,23 However, only a small increase in cellulose conversion was obtained when the mass of the catalyst was increased from 0.45 g to 0.60 g, and the combined yield of EG and 1,2-PG increased slightly (2.84 wt%). The reason for this result may be that a heavy load of catalysts provides more active sites on the catalyst than that required by the feedstock. Thus, the excess catalyst caused side reactions such as polymerization and rehydration.28,29 Considering the effective utilization of W–Ni catalyst, 0.45 g was chosen as an appropriate amount at the studied reaction conditions.
Table 1 Catalytic conversion of cellulose into EG and 1,2-PG over different catalystsa
| Catalyst |
EG |
1,2-PG |
Conv. |
| mg L−1 |
% |
mg L−1 |
% |
% |
| Conv.: conversion of cellulose, reaction conditions: microcrystalline cellulose 0.3 g, catalyst 0.1 g, deionized water 60 mL, 245 °C, 2 h, 6.0 MPa H2. |
| Black |
131.51 |
2.63 |
116.02 |
2.32 |
76.38 |
| Ni/MSM |
137.92 |
2.76 |
412.23 |
8.24 |
86.05 |
| W/MSM |
1003.10 |
20.06 |
395.34 |
7.91 |
96.93 |
| W–Ni/MSM |
1397.11 |
27.94 |
695.51 |
13.91 |
100.00 |
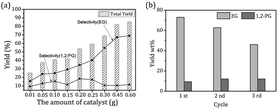 |
| | Fig. 3 (a) Catalytic result with different amounts and (b) the reusability of W–Ni/MSM catalyst for cellulose conversion. | |
3.3 Catalytic conversion of pretreated corn stalks on 15% W–5% Ni/MSM catalyst
Cellulose is bonded together with hemicelluloses and lignin to form a complex polymer by covalent bonding, various intermolecular bridges, and van der Waals forces.30 Therefore, for effective utilization of cellulose for conversion into highly valued products, lignocellulose must be pretreated to change the connection between constitutional units. Pretreatment with dilute acid and alkalis is common for efficiency and simplicity. Pretreatment with acid and alkalis can improve the conversion efficiency of lignocellulose to polysaccharide by breaking down lignin seals and disrupting the crystalline structure of cellulose. In general, an increase in cellulose content and/or a decrease in hemicellulose and lignin contents could improve the catalytic efficiency of cellulase for lignocellulosic materials.25,31,32 In our study, corn stalks were treated at various combinations of acidic and alkaline conditions, and the content of cellulose, hemi-cellulose, and lignin are shown in Table 2. Subsequently, the samples were subjected to 15% W–5% Ni/MSM catalyst under optimal conditions. Table 3 summarizes the EG and 1,2-PG yields from various corn-stalk samples. The pretreatment was beneficial to the catalytic conversion and the highest diols yield (62.60 wt%) was obtained from a corn-stock sample pretreated with acid followed by alkali. The EG yield was improved from 4.09 wt% for an untreated sample to 48.21 wt% and 53.87 wt% for acid- and alkali-treated samples, respectively. These results clearly showed that the pretreatment methods of corn stalks were useful for the selective conversion of corn stalks into EG. However, the diols yields from corn-stock samples were inferior to the result from microcrystalline cellulose. The yield of cellulose extraction from raw corn stock was limited, which might have been the main reason for differences between corn stalks and microcrystalline cellulose.33,34 To some extent, the increase in cellulose content of pretreated corn stalks and the high activity and selectivity of the 15% W–5% Ni/MSM catalyst were notable.
Table 2 Contents in a corn stalk before and after pretreatment with acid and alkali
| Pretreatment method |
Cellulose, % |
HCa, % |
AILb, % |
ASLc, % |
| Hemi-cellulose. Acid insoluble lignin. Acid soluble lignin. |
| Untreated |
42.02 |
15.88 |
12.17 |
15.87 |
| Pretreated with acid |
52.32 |
10.83 |
6.34 |
18.79 |
| Pretreated with alkali |
60.15 |
12.07 |
8.85 |
7.52 |
| Pretreated with alkali followed by acid |
75.12 |
9.80 |
6.06 |
5.48 |
| Pretreated with acid followed by alkali |
77.68 |
5.67 |
5.96 |
6.18 |
Table 3 Catalytic conversion of various corn stalks into EG and 1,2-PG over 15% W–5% Ni/MSMa
| Pretreatment method |
EG |
1,2-PG |
Total yield |
| mg L−1 |
% |
mg L−1 |
% |
% |
| Reaction conditions: reactant 0.3 g, catalyst 0.45 g, deionized water 60 mL, 245 °C, 2 h, 6.0 MPa H2. |
| Untreated |
205.02 |
4.09 |
524.71 |
10.53 |
14.62 |
| Pretreated with acid |
263.17 |
5.33 |
575.45 |
11.50 |
16.83 |
| Pretreated with alkali |
672.11 |
13.40 |
509.04 |
10.22 |
23.62 |
| Pretreated with alkali followed by acid |
2408.15 |
48.21 |
554.91 |
11.11 |
59.32 |
| Pretreated with acid followed by alkali |
2244.45 |
53.87 |
363.90 |
8.73 |
62.60 |
3.4 Reusability of the catalyst
One of the critical questions in correlating the conversion of cellulose results with supported catalysts is the stability of the catalyst under reaction conditions. In our study, the recycling performance of 15% W–5% Ni/MSM catalyst was examined. After completion of the reaction, W–Ni/MSM catalyst was recycled and applied to cellulose conversion, and a 30.30 wt% yield of polyol was obtained. To enhance the capability of recycled W–Ni/MSM catalyst, it was re-calcined and re-reduced. The re-generated W–Ni/MSM catalyst was also applied to the catalytic conversion of cellulose, and the corresponding result of the cycle test is shown in Fig. 3(b). We found that the polyol yield declined gradually with increasing cycle time. In particular, the EG yield decreased from 72.90 wt% in the first run to 62.72 wt% in the second run. A similar situation was found in the third cycle. These results suggested that the capability of the re-activated W–Ni/MSM catalyst declined during cellulose conversion.
3.5 Reaction mechanism
.To gain more detailed insights into the decreased activity of the catalyst during the recycling test, the crystalline phase, micromorphology and physicochemical property of 15% W–5% Ni/MSM catalyst were characterized by XRD spectroscopy, XPS, TEM, SEM and N2 adsorption–desorption. As compared with the XRD patterns of catalysts before and after the reaction, the analysis of recycled W–Ni/MSM catalyst revealed the phase transformation during the reaction of cellulose conversion. As exhibited in Fig. 4(a), the peak intensity of nickel (2θ = 44.36°, 51.59° and 76.0°) disappeared, and the peak intensity of Wolfram (2θ = 40.3°, 58.3° and 73.3°) weakened. New peaks at 24.9°, 31.54°, 36.5°, 44.7°, 54.6° and 65.5° were visible, and were assigned to NiWO4 (PDF#15-0755). The crystal phase of W–Ni/MSM was turned mainly into NiWO4 after the reaction was complete. XPS characterization was used further to identify the chemical state of the W and Ni on W–Ni/MSM. Fig. 5(a and b) show that W0 (Eb = 31.3 eV and 31.36 eV) and Ni0 (Eb = 852 eV and 853 eV) were the dominant species on the fresh W–Ni/MSM catalyst.35,36 However, there was a W 4f7/2 binging energy ≈35.6 eV, which was assigned to W6+ as WO3.35,37 The phase of WO3 was not observed by XRD spectroscopy, which might have been due to the low quantity of W below the detection limit of XRD spectroscopy. As compared with the spectrum of Ni 2p3/2 and W 4f7/2 before and after the reaction (Fig. 5(a–d)), Ni0 was replaced by Ni2+ (Eb = 855.5 eV), Ni3+ (Eb = 856.5 eV) and NiWO4 (Eb = 857.3 eV), and W0 was also replaced by NiWO4 (Eb = 35.6 eV).35,36 After the reaction was complete, the chemical component on W–Ni/MSM catalyst was changed. This result was in good accordance with the XRD spectroscopy data reported above, and could explain the deactivation of W–Ni/MSM catalyst after use, suggesting that NiWO4 has low activity for the hydrolytic hydrogenation of cellulose. Amazingly, new reflection peaks were detected in the re-activated W–Ni/MSM catalyst. As displayed in Fig. 4(b), the reflections appeared at 2θ around 32.6°, 35.9°, 43.0°, 47.1°, 60.58°, 70.9° and 75.5°, which were assigned to nickel tungsten (NiW) (PDF#47-1172). This result indicated that the new crystalline phase was formed on re-activated W–Ni/MSM catalyst, which was distinct from the fresh catalyst. Further details of the composition and chemical state were investigated by XPS, and the corresponding results are shown in Fig. 5(e and f). These data rendered Ni0 and W0, which was consistent with the XRD spectroscopy results. Hence, the different active phase of fresh and re-activated W–Ni/MSM catalyst may have been the main reason for the slight decrease in catalytic performance upon cellulose conversion. In addition, the average particle size of W–Ni/MSM catalysts was calculated by TEM. As shown in Fig. 6, the average nanoparticle size of used W–Ni/MSM catalyst was 4.6 nm, which was slightly larger than that of fresh W–Ni/MSM catalyst (4.2 nm), suggesting particle agglomeration during the reaction. Also, the average particle size of the first re-activated W–Ni/MSM catalyst was almost identical to the data for the fresh catalyst. In summary, relatively small metal crystallite sizes remained during the reaction. To ascertain the cause of the decreased yields during the recycling test, the metal concentration in the liquid phase was quantified using ICP-AES. For 15% W–5% Ni/MSM, the concentrations of Ni and W in the liquid phase after the first run were determined to be 0.77 and 7.58 mg L−1, respectively. After the second run, the concentrations of Ni and W in the liquid phase were 0.36 and 4.32 mg L−1, respectively. In summary, the leaching rate of W and Ni was <0.7%, much lower than that reported in the literature for this type of research. The morphology of the fresh and re-activated W–Ni/MSM catalyst is shown in Fig. 7. The MSM continued to have regular spherical morphology, but the surface became rougher with increasing cycle time, suggesting that the structure of the support was partially broken during the reaction. Also, the irregular cratering on the surface of the MSM could cause mass-transfer resistance and spatial restriction, which results in the formation of byproducts and carbon deposition.21,27 In addition, a N2 adsorption–desorption experiment was conducted to provide additional information on the re-activated W–Ni/MSM catalyst. The BET surface area and pore volumes decreased after re-calcination and re-reduction. The specific surface area decreased from 164.08 to 73.6 m2 g−1 after recycling (data not shown).
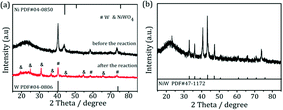 |
| | Fig. 4 XRD spectroscopy patterns of (a) W–Ni/MSM catalyst before and after the reaction and (b) the re-activated W–Ni/MSM catalyst. | |
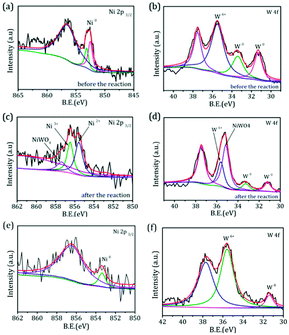 |
| | Fig. 5 XPS spectra of (a and c) Ni 2p and (b and d) W 4f of W–Ni/MSM catalyst before and after the reaction. XPS spectra of (e) Ni 2p and (f) W 4f of the re-activated W–Ni/MSM catalyst. | |
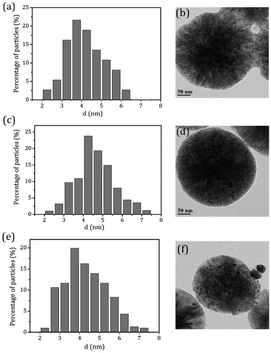 |
| | Fig. 6 TEM micrographs and metal particle size distributions on W–Ni/MSM catalyst (a and b) before and (c and d) after the reaction, and (e and f) the re-activated W–Ni/MSM catalyst. | |
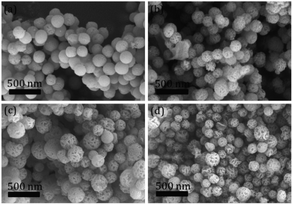 |
| | Fig. 7 SEM images of (a) fresh catalyst and (b–d) the recycled W–Ni/MSM catalyst after one, two and three runs. | |
3.6 Reaction pathway
It is known that soluble HxWO3 can convert into insoluble tungsten acid with decreasing solution temperature, and then the precipitate can become NiWO4 by contact with air.19,38 Based on the above discussion and experimental results, a reaction pathway for the catalyzed conversion of cellulose into polyol is illustrated in Fig. 8. In a water medium and hydrogen atmosphere, tungstic oxide on the solid catalyst dissolves in hot aqueous solution and forms the homogeneous catalyst (HxWO3). HxWO3 and hot water can provide H+, which attacks to hydrogen and β-1,4-glycosidic bonds of cellulose to form glucan and oligosaccharide. Subsequently, the synergism between W and Ni act selectively on C–C cleavages and hydrogenation leads to conversion to EG. In addition, cellulose hydrolysis by H+9 and selective conversion into EG and 1,2-PG13 are proposed.
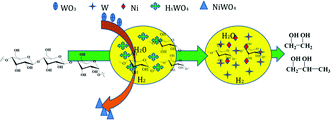 |
| | Fig. 8 The reaction pathway for the conversion of cellulose to EG and 1,2-PG on W–Ni/MSM catalyst. | |
4. Conclusions
W–Ni supported catalysts were prepared and tested for the hydrolytic hydrogenation of cellulose and pretreated corn stalks. 15% W–5% Ni/MSM catalyst showed excellent performance with an 82.2 wt% yield of polyol on conversion of cellulose, which was attributed to the synergistic effect of active sites and the support. Moreover, the transformation of active species on W–Ni/MSM catalyst was investigated, and a possible reaction pathway for the catalytic conversion of cellulose proposed. This pathway could be used to design promising catalysts for efficient conversion of biomass into renewable fuels.
Conflicts of interest
There are no conflicts to declare.
Acknowledgements
The authors thank the National Natural Science Foundation of China (21266023), National First-rate Discipline Construction Project of Ningxia (NXYLXK2017A04), and the Chunhui Project of Ministry of Education of China for financial support.
Notes and references
- D. A. Bulushev and J. R. H. Ross, Catal. Today, 2011, 171, 1–13 CrossRef CAS.
- J. J. Bozell, Science, 2011, 329, 522–523 CrossRef PubMed.
- Z. B. Zhang, Q. Lu, X. N. Ye, T. P. Wang, X. H. Wang and C. Q. Dong, BioEnergy Res., 2015, 8, 1263–1274 CrossRef CAS.
- Z. J. Tai, J. Y. Zhang, A. Q. Wang, J. F. Pang, M. Y. Zheng and T. Zhang, Chemsuschem, 2013, 6, 652–658 CrossRef CAS PubMed.
- M. Y. Zheng, J. F. Pang, R. Y. Sun, A. Q. Wang and T. Zhang, ACS Catal., 2017, 7, 1939–1954 CrossRef CAS.
- Q. Y. Liu, Y. H. Liao, T. J. Wang, C. L. Cai, Q. Zhang, N. Tsubaki and L. L. Ma, Ind. Eng. Chem. Res., 2014, 53, 12655–12664 CrossRef CAS.
- S. Ogo, T. Nishio, H. Sekine, A. Onda and Y. Sekine, Fuel Process. Technol., 2016, 141, 123–129 CrossRef CAS.
- S. Q. Xu, X. P. Yan, Q. Bu and H. A. Xia, Cellulose, 2017, 1–11 Search PubMed.
- Z. Z. Yang, R. L. Huang, W. Qi, L. P. Tang, R. X. Su and Z. M. He, Chem. Eng. J., 2015, 280, 90–98 CrossRef CAS.
- J. Y. Zhang, B. L. Hou, A. Q. Wang, Z. L. Li, H. Wang and T. Zhang, AIChE J., 2015, 60, 3804–3813 CrossRef.
- A. Fukuoka and P. L. Dhepe, Angew. Chem., 2006, 45, 5161–5163 CrossRef CAS PubMed.
- C. Luo, S. Wang and H. C. Liu, Angew. Chem., 2007, 119, 7636–7639 CrossRef PubMed.
- N. Ji, T. Zhang, M. Y. Zheng, A. Q. Wang, H. Wang, X. D. Wang and J. G. G. Chen, Angew. Chem., 2008, 47, 8510–8513 CrossRef CAS PubMed.
- J. F. Pang, A. Q. Wang, M. Y. Zheng, Y. H. Huang, X. W. Chen and T. Zhang, Green Chem., 2012, 14, 614–617 RSC.
- R. Y. Sun, M. Y. Zheng, J. F. Pang, X. Liu, J. H. Wang, X. L. Pan, A. Q. Wang, X. D. Wang and T. Zhang, ACS Catal., 2016, 6, 191–201 CrossRef CAS.
- M. Y. Zheng, A. Q. Wang, N. Ji, J. F. Pang, X. D. Wang and T. Zhang, Chemsuschem, 2010, 3, 63–66 CrossRef CAS PubMed.
- I. G. Baek, S. J. You and E. D. Park, Bioresour. Technol., 2012, 114, 684–690 CrossRef CAS PubMed.
- Z. Q. Xiao, R. Y. Sha, J. B. Ji and J. W. Mao, J. Fuel Chem. Technol., 2016, 44, 1225–1232 CAS.
- Y. L. Cao, J. W. Wang, M. Q. Kang and Y. L. Zhu, J. Mol. Catal. A: Chem., 2014, 381, 46–53 CrossRef CAS.
- P. Rameshkumar, S. Saranya, K. Sujatha and R. Ramaraj, RSC Adv., 2014, 5, 5038–5045 RSC.
- T. Jiang, X. Wang, L. Zhang, J. Zhou and Z. Q. Zhao, Appl. Surf. Sci., 2016, 378, 181–190 CrossRef CAS.
- D. P. Li, R. X. Yi, J. W. Tian, J. H. Li, B. Y. Yu and J. Qi, Chem. Commun., 2017, 53, 8902–8905 RSC.
- Á. Mayoral, V. Gascón, R. M. Blnco, C. Márquezálvarez and I. Díaz, APL Mater., 2014, 2, 6213–6219 Search PubMed.
- G. Y. Pan, Y. L. Ma, X. X. Ma, Y. G. Sun, J. M. Lv and J. L. Zhang, Chem. Eng. J., 2016, 299, 386–392 CrossRef CAS.
- L. Y. Cai, Y. L. Ma, X. X. Ma and J. M. Lv, Bioresour. Technol., 2016, 212, 42–46 CrossRef CAS PubMed.
- G. Y. Pan, Y. L. Ma, G. L. Lin, X. Q. Ding and Y. X. Ma, Polym. Bull., 2016, 10, 47–53 Search PubMed.
- Y. H. Liao, Q. Y. Liu, T. J. Wang, J. X. Long, Q. Zhang, L. L. Ma and Y. P. Li, Energy Fuels, 2014, 28, 5778–5784 CrossRef CAS.
- K. Y. Nandiwale, N. D. Galande, P. Thakur, S. D. Sawant, V. P. Zambre and V. V. Bokade, ACS Sustainable Chem. Eng., 2014, 2, 1928–1932 CrossRef CAS.
- B. Zhao, C. J. Chou and Y. W. Chen, Ind. Eng. Chem. Res., 2010, 49, 1669–1676 CrossRef CAS.
- Y. G. Sun, Y. L. Ma, L. Q. Wang, F. Z. Wang, Q. Q. Wu and G. Y. Pan, Carbohydr. Polym., 2015, 117, 486–493 CrossRef CAS PubMed.
- Y. Chen, M. A. Stevens, Y. M. Zhu, J. Holmes and H. Xu, Biotechnol. Biofuels, 2013, 6, 1–10 CrossRef PubMed.
- Q. Q. Wu, Y. L. Ma, X. Chang and Y. G. Sun, Carbohydr. Polym., 2015, 129, 79–86 CrossRef CAS PubMed.
- I. Egüés, C. Sanchez, I. Mondragon and J. Labidi, Bioresour. Technol., 2012, 103, 239–248 CrossRef PubMed.
- Q. Lu, Z. Cai, F. Lin, L. R. Tang, S. Q. Wang and B. Huang, ACS Sustainable Chem. Eng., 2016, 4, 2165–2172 CrossRef CAS.
- R. Juškėnas, I. Valsiūnas, V. Pakštas, A. Selskis, V. Jasulaitienė, V. Karpavičienė and V. Kapočius, Appl. Surf. Sci., 2006, 253, 1435–1442 CrossRef.
- S. H. Zhang, C. Shi, B. B. Chen, Y. L. Zhang and J. S. Qiu, Catal. Commun., 2015, 69, 123–128 CrossRef CAS.
- A. P. Shpak, A. M. Korduban, M. M. Medvedskij and V. O. Kandyba, J. Electron Spectrosc. Relat. Phenom., 2007, 156, 172–175 CrossRef.
- A. Wang and T. Zhang, Acc. Chem. Res., 2013, 46, 1377–1386 CrossRef CAS PubMed.
|
| This journal is © The Royal Society of Chemistry 2018 |
Click here to see how this site uses Cookies. View our privacy policy here.  Open Access Article
 *,
Xiao-Xia Ma,
Yong-Gang Sun and
Zhi Song


