 Open Access Article
Insights into the photocatalytic performance of Bi2O2CO3/BiVO4 heterostructures prepared by one-step hydrothermal method
Osmando F. Lopes *ab,
Kele T. G. Carvalhoc,
Waldir Avansi Jrd,
Debora M. B. Miloric and
Caue Ribeiro
 c
c
aDepartamento de Química, Universidade Federal de São Carlos – UFSCar, Rod. Washington Luiz, km 235, CEP 13565-905, São Carlos-SP, Brazil. E-mail: osmando_iq@hotmail.com; osmandoferreira@gmail.com
bInstituto de Química de São Carlos, Universidade de São Paulo, Av. Trabalhador São Carlense, 400, CEP 13566-590, São Carlos-SP, Brazil
cEmbrapa Instrumentação, Rua XV de Novembro, 1452, CEP 13560-970, São Carlos-SP, Brazil
dDepartamento de Física, Universidade Federal de São Carlos, Rod. Washington Luiz, km 235, CEP 13565-905, São Carlos-SP, Brazil
First published on 19th March 2018
Abstract
This paper describes the synthesis of Bi2O2CO3/BiVO4 heterostructures through a one-step method based on the difference in solubility between two semiconductors that possess a metal in common. The as-synthesized Bi2O2CO3/BiVO4 heterostructures were characterized by X-ray diffraction (XRD), thermogravimetric analysis (TGA), Raman spectroscopy, ultraviolet-visible diffuse reflectance spectroscopy (UV-vis DRS), scanning electron microscopy (SEM), transmission electron microscopy (TEM), N2 physisorption, X-ray photoelectron spectroscopy (XPS) and time resolved photoluminescence spectroscopy (TRPL). The role of the heterojunction formed was evaluated by methylene blue (MB) dye and amiloride photodegradation. The formation of the heterostructure was observed indirectly by the great increase in the thermal stability of the Bi2O2CO3 phase when compared to its pure phase. The amount of heterojunctions formed between the Bi2O2CO3 and BiVO4 was tuned by vanadium precursor concentration. The proposed strategy was efficient for obtaining Bi2O2CO3/BiVO4 heterostructures with enhanced photocatalytic performance when compared to their isolated phases, MB and amiloride photodegradation occurred mainly by the action of ˙OH radicals, i.e. by an indirect mechanism. Based on TRPL spectroscopy and VB-XPS results, an enhancement of photoactivity related to an increase in the spatial separation of photo-generated electron/hole pairs was observed due to the formation of a type-II heterostructure.
Introduction
The use of semiconductors in photocatalytic processes has many applications, due to the possibility of inducing reactions of great interest in a rapid and efficient way, such as: organic pollutants photodegradation and water-splitting.1–4 Among various semiconductors, bismuth-containing materials such as bismuth subcarbonate (Bi2O2CO3) have remarkable properties that make this a great candidate for photocatalytic applications.5,6 The origin of suitable properties of Bi2O2CO3 is the internal layered structure of Aurivillius structure, which could guide the lower growth rate along the (001) axis compared to that along other axes, and thus form 2D morphologies like nanosheets.6–8 However, Bi2O2CO3 exhibits two main drawbacks for photocatalytic applications: the rapid recombination of electron/hole pairs and the impossibility of activation under visible irradiation.7Several strategies have been developed to minimize or overcome these undesirable effects.9 In particular, the association of semiconductors with metals or other semiconductors to form heterostructures is a promising approach.4,10 Previous studies have shown that heterostructure formation can extend spectral response range and efficiently separate charge carriers, provoking a synergistic effect between the semiconductors.9,11–14 In this sense, the formation of a heterostructure between Bi2O2CO3 and BiVO4 is an interesting approach to enhance photocatalytic properties due to their suitable electronic characteristics for a type-II heterostructure and also BiVO4 is active under visible irradiation.8 Different strategies have been studied to obtain heterostructures such as one-step methods (simultaneous crystallization)15–18 and the use of one and/or two preformed particles (heterojunctions formation by attachment).9,19–24 The growth of BiVO4 on Bi2O2CO3 surface (preformed) under hydrothermal conditions driven by their difference in solubility is a more interesting and efficient approach for the formation of this kind of heterostructure. This is because the formation of the heterojunction is unavoidable, since mandatorily BiVO4 will grow using the bismuth present on the surface of Bi2O2CO3.
Therefore, we study this method to obtain Bi2O2CO3/BiVO4 heterostructure using preformed Bi2O2CO3 particles based on hydrothermal treatment. The effect of the molar ratio between Bi2O2CO3 and the vanadium precursor on the amount of BiVO4 grown on Bi2O2CO3 surface was evaluated. The role of heterojunction formation on photocatalytic performance was probed by methylene blue dye and amiloride photodegradation under visible and UV irradiation and by time resolved photoluminescence spectroscopy. The formation of a type-II heterostructure between Bi2O2CO3 and BiVO4 and its charge transfer mechanism for the increase in charge carrier lifetime was also proposed.
Experimental
Synthesis of Bi2O2CO3/BiVO4 heterostructures
To obtain the Bi2O2CO3/BiVO4 heterostructures, 0.2 g of Bi2O2CO3 (obtained by a typical synthesis25 between Bi(NO3)3·5H2O and Na2CO3) and suitable amounts of NH4VO3 (Vetec, 99%) were added to 35 mL of distilled water and the solution was hydrothermally treated at 150 °C for 12 h. The precipitate was washed with distilled water and centrifuged to remove impurities and was dried in an oven at 50 °C. Three different molar ratios of Bi![[thin space (1/6-em)]](https://www.rsc.org/images/entities/char_2009.gif) :
:![[thin space (1/6-em)]](https://www.rsc.org/images/entities/char_2009.gif) V were studied: 1
V were studied: 1![[thin space (1/6-em)]](https://www.rsc.org/images/entities/char_2009.gif) :
:![[thin space (1/6-em)]](https://www.rsc.org/images/entities/char_2009.gif) 1, 1
1, 1![[thin space (1/6-em)]](https://www.rsc.org/images/entities/char_2009.gif) :
:![[thin space (1/6-em)]](https://www.rsc.org/images/entities/char_2009.gif) 0.7 and 1
0.7 and 1![[thin space (1/6-em)]](https://www.rsc.org/images/entities/char_2009.gif) :
:![[thin space (1/6-em)]](https://www.rsc.org/images/entities/char_2009.gif) 0.3, which resulted in follow molar ratios of Bi2O2CO3
0.3, which resulted in follow molar ratios of Bi2O2CO3![[thin space (1/6-em)]](https://www.rsc.org/images/entities/char_2009.gif) :
:![[thin space (1/6-em)]](https://www.rsc.org/images/entities/char_2009.gif) BiVO4 after the synthesis: 0
BiVO4 after the synthesis: 0![[thin space (1/6-em)]](https://www.rsc.org/images/entities/char_2009.gif) :
:![[thin space (1/6-em)]](https://www.rsc.org/images/entities/char_2009.gif) 1, 0.3
1, 0.3![[thin space (1/6-em)]](https://www.rsc.org/images/entities/char_2009.gif) :
:![[thin space (1/6-em)]](https://www.rsc.org/images/entities/char_2009.gif) 0.7 and 0.7
0.7 and 0.7![[thin space (1/6-em)]](https://www.rsc.org/images/entities/char_2009.gif) :
:![[thin space (1/6-em)]](https://www.rsc.org/images/entities/char_2009.gif) 0.3, respectively. The samples were named as BiVO4, Het-1:0.7, and Het-1:0.3, respectively. For comparative purposes, pure Bi2O2CO3 was also hydrothermally treated at 150 °C for 12 h.
0.3, respectively. The samples were named as BiVO4, Het-1:0.7, and Het-1:0.3, respectively. For comparative purposes, pure Bi2O2CO3 was also hydrothermally treated at 150 °C for 12 h.
Characterization
X-ray diffraction (XRD) was conducted in a Shimadzu XRD6000 diffractometer operating with a nickel-filtered Cu Kα radiation generated at 30 kV and a filament current of 30 mA. The 2θ range from 10 to 60° was continuously scanned at speed of 1° min−1 with a step width of 0.02°. Raman spectroscopy analyses were performed with a FT-Raman spectrometer (Bruker RAM II with a Ge detector), equipped with a Nd:YAG laser with a wavelength centered at 1064 nm generating a power of 100 mW at a resolution of 2 cm−1. Thermogravimetric analysis (TGA) of the as-synthesized samples was performed in a TA Q500 thermogravimetric analyzer (TA Instruments) under the following conditions: weight 10.00 ± 0.50 mg; synthetic air flow of 60 mL min−1; heating rate 10 °C min−1; and temperature range of 30–550 °C. UV-vis diffuse reflectance spectra (DRS) were recorded with a UV-2600 Shimadzu spectrophotometer coupled with an integrating sphere (ISR-2600Plus) from 250 to 800 nm to determine the band gap of the materials. The measurements were performed in the total reflection mode with BaSO4 as a reference.The morphology of the as-synthesized samples was verified by images obtained in a field emission gun scanning electron microscope (FE-SEM Jeol JSM 6701F) working at 5 kV. Semi-quantitative atomic compositions were evaluated by energy-dispersive X-ray spectroscopy (EDS) using a Thermo Noran device coupled to a SEM (Jeol JEM 2010). High resolution transmission electron microscopy (HRTEM FEI – TECNAI) operating at 200 kV was employed to verify the formation of the heterostructures. The samples were prepared by wetting carbon-coated copper grids with a drop of colloidal alcoholic suspensions and drying in air.
Specific surface area (SSA) of the as-synthesized samples was estimated applying the BET model to N2 adsorption data conducted at −196 °C with a Micrometrics ASAP 2000 equipment. Before the analysis, the samples were pre-treated (degassed) by heating at 80 °C under vacuum until reaching a degassing pressure lower than 20 μmHg. Chemical surface analysis was performed with a K-alpha XPS equipment (Thermo Fisher 1 Scientific, UK) using Al Kα X-rays, vacuum >10−8 mbar and charge compensation during measurements. The survey and high-resolution spectra were recorded using a pass energy of 1.0 and 0.1 eV, respectively. The binding energy was referenced to the C 1s peak at 284.8 eV. The data analysis was performed using the CASA XPS software.
Photocatalytic measurements
The photoactivity of the as-synthesized samples was evaluated for the degradation of methylene blue (MB) dye under visible and ultraviolet (UV) irradiation, also the degradation of amiloride was evaluated. In typical procedure, 10 mg of a photocatalyst was placed in contact with 20 mL of aqueous solution of MB or amiloride (5 mg L−1). All the experiments were carried out in a photoreactor equipped with six UVC (Philips TUV, 15 W, maximum intensity at 254 nm, and light intensity at 20 cm of 4.0 mW cm−2) or six fluorescent (Osram, 15 W, and maximum intensity at 440 nm) lamps, a magnetic stirrer, and a heat exchanger that maintained the temperature at 18 °C. The photodegradation of the MB dye or amiloride was monitored at regular intervals by their maximum absorbance at 654 or 286 nm, respectively, using a Shimadzu-UV-1601 PC spectrophotometer. Before the kinetic experiments, the suspensions were kept in the dark for 12 h to reach adsorption/desorption equilibrium.The hydroxyl radical (˙OH) generated in the photocatalytic process under visible irradiation was indirectly detected by using a fluorescent probe, terephthalic acid (TA).26–29 TA readily reacts with ˙OH to form 2-hydroxyterephthalic acid (HTA), a highly fluorescent product with emission at approximately 425 nm. The amount of HTA is directly proportional to the quantity of ˙OH radicals produced by the irradiated photocatalyst. In a typical procedure, 10 mg of the photocatalyst was added to 20 mL of TA solution (5 × 10⁻⁴ mol L−1) prepared from a dilute NaOH solution (2 × 10⁻³ mol L−1), and the dispersions were maintained under visible irradiation for 2 h. After this period, an aliquot was analyzed in a Shimadzu RF-5301PC spectrofluorophotometer, and the fluorescence emission spectra were obtained with an excitation wavelength of 315 nm.
The lifetime of the charge carriers of the as-synthesized samples were determined by time resolved photoluminescence using time-correlated single photon counting (TCSPC). A pulsed diode laser head of 405 nm (LDH P-C-405, PicoQuant) with an approximate 50 ps pulse width and 40 MHz repetition rate was used as the excitation source. The PL emission was spectrally resolved using collection optics and an emission monochromator. The TCSPC module (PicoHarp 300, PicoQuant) was used for ultrafast detection. The deconvolution of the PL decay was performed using a fitting software (FluoFit, PicoQuant) to deduce the time constant associated with exponential decay.
Results and discussion
X-ray diffraction (XRD) patterns of the as-synthesized samples were collected to verify the presence of BiVO4 and Bi2O2CO3 phases (Fig. 1). The pure Bi2O2CO3 sample that was hydrothermally treated showed a typical XRD pattern assigned to tetragonal crystalline phase (JCPDS, no. – 041-1488) without any contaminant or spurious phase indicating crystallographic stability under the hydrothermal treatment. When Bi2O2CO3 was hydrothermally treated in the presence of V precursor with molar ratio of Bi![[thin space (1/6-em)]](https://www.rsc.org/images/entities/char_2009.gif) :
:![[thin space (1/6-em)]](https://www.rsc.org/images/entities/char_2009.gif) V 1
V 1![[thin space (1/6-em)]](https://www.rsc.org/images/entities/char_2009.gif) :
:![[thin space (1/6-em)]](https://www.rsc.org/images/entities/char_2009.gif) 0.3 (Het-1:0.3 sample), an intense diffraction peak at 2θ ≈ 28.8 related to monoclinic BiVO4 crystalline phase (JCPDS, no. – 083-1699) was observed. The decrease of Bi2O2CO3 content in the heterostructure is difficult to visualize by XRD patterns since the most intense diffraction peak, i.e. (103) plane, is overlapped by the diffraction peak of BiVO4 referent to the (004) plane. However, the disappearance of Bi2O2CO3 phase can be easily visualized by the decreasing intensity of the peak referent to the (110) plane. Further, it was observed that increasing the proportion of the V precursor (Het-1:0.7 sample) increased significantly the amount of BiVO4 formed. With an increase in the molar ratio between Bi
0.3 (Het-1:0.3 sample), an intense diffraction peak at 2θ ≈ 28.8 related to monoclinic BiVO4 crystalline phase (JCPDS, no. – 083-1699) was observed. The decrease of Bi2O2CO3 content in the heterostructure is difficult to visualize by XRD patterns since the most intense diffraction peak, i.e. (103) plane, is overlapped by the diffraction peak of BiVO4 referent to the (004) plane. However, the disappearance of Bi2O2CO3 phase can be easily visualized by the decreasing intensity of the peak referent to the (110) plane. Further, it was observed that increasing the proportion of the V precursor (Het-1:0.7 sample) increased significantly the amount of BiVO4 formed. With an increase in the molar ratio between Bi![[thin space (1/6-em)]](https://www.rsc.org/images/entities/char_2009.gif) :
:![[thin space (1/6-em)]](https://www.rsc.org/images/entities/char_2009.gif) V, i.e. 1
V, i.e. 1![[thin space (1/6-em)]](https://www.rsc.org/images/entities/char_2009.gif) :
:![[thin space (1/6-em)]](https://www.rsc.org/images/entities/char_2009.gif) 1, it was observed that Bi2O2CO3 converted fully into BiVO4, without any spurious phase. In this sense, the formation of BiVO4 on Bi2O2CO3 surface or the full transformation can occur according to the reactions below:30
1, it was observed that Bi2O2CO3 converted fully into BiVO4, without any spurious phase. In this sense, the formation of BiVO4 on Bi2O2CO3 surface or the full transformation can occur according to the reactions below:30| Bi2O2CO3 → 2BiO+ + CO32− |
| NH4VO3 → NH4+ + VO3− |
| BiO+ + VO3− → BiVO4↓ |
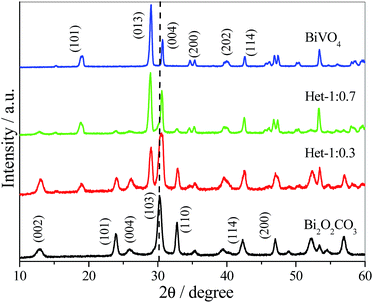 | ||
Fig. 1 XRD patterns of Bi2O2CO3, BiVO4 and Bi2O2CO3/BiVO4 samples in different molar ratios of Bi![[thin space (1/6-em)]](https://www.rsc.org/images/entities/char_2009.gif) : :![[thin space (1/6-em)]](https://www.rsc.org/images/entities/char_2009.gif) V. V. | ||
These results are in agreement with previous studies,5,31 where the principle that compounds with high solubility can be converted into compounds with low solubility was utilized to obtain heterostructures of Bi2S3/Bi2O2CO3 and Bi2S3/BiVO4.5,31
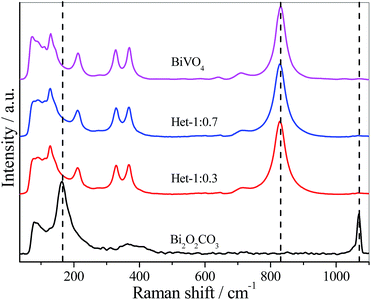
Fig. 2 shows the Raman scattering spectra of the as-synthesized samples. The Bi2O2CO3 sample showed a typical Raman spectrum, with characteristic bands at 1068, 367, 166 and 80 cm−1. The band at 1068 cm−1 was assigned to symmetric stretching of CO32−, while the three bands below 400 cm−1 were related to vibrational modes of Bi![[double bond, length as m-dash]](https://www.rsc.org/images/entities/char_e001.gif) O bond lattice.8 For the Het-1:0.7 and Het-1:0.3 samples, all the bands related to Bi2O2CO3 disappeared, however the typical Raman spectrum of monoclinic BiVO4 phase with characteristic bands at 826, 362, 330, 200, and 120 cm−1 can be observed.32 This effect is most likely due to the coating of the Bi2O2CO3 surface by BiVO4, resulting in a higher Raman scattering intensity related to BiVO4 rather than Bi2O2CO3.
O bond lattice.8 For the Het-1:0.7 and Het-1:0.3 samples, all the bands related to Bi2O2CO3 disappeared, however the typical Raman spectrum of monoclinic BiVO4 phase with characteristic bands at 826, 362, 330, 200, and 120 cm−1 can be observed.32 This effect is most likely due to the coating of the Bi2O2CO3 surface by BiVO4, resulting in a higher Raman scattering intensity related to BiVO4 rather than Bi2O2CO3.
Thermogravimetric analysis (TGA) of Bi2O2CO3, BiVO4 and Het-1:0.7 samples were performed to evaluate the thermal decomposition of Bi2O2CO3 (i.e., the formation of Bi2O3 by the loss of carbonate group) and the concentration of BiVO4 in the heterostructured sample. As shown, in Fig. 3a the Bi2O2CO3 sample lost ∼9.0% of its initial mass, due to the total decomposition of the carbonate group. On the other hand, the BiVO4 sample exhibited an insignificant weight loss (lower than 0.2 wt%), which confirms that the Bi2O2CO3 phase reacted completely to form BiVO4 when the Bi![[thin space (1/6-em)]](https://www.rsc.org/images/entities/char_2009.gif) :
:![[thin space (1/6-em)]](https://www.rsc.org/images/entities/char_2009.gif) V molar ratio of 1
V molar ratio of 1![[thin space (1/6-em)]](https://www.rsc.org/images/entities/char_2009.gif) :
:![[thin space (1/6-em)]](https://www.rsc.org/images/entities/char_2009.gif) 1 was used. From these results, it is possible to observe that Bi2O2CO3 reacts completely to form BiVO4 in this condition. The Het-1:0.7 sample showed a weight loss of ∼4.3%, meaning that the Bi2O2CO3 content in this heterostructure is approximately 45 wt%, which is in close agreement with the theoretical amount, i.e. 40 wt% of Bi2O2CO3. The analysis of the derivative thermogravimetry (DTG) curves in Fig. 3b showed that the decomposition temperature of Bi2O2CO3 occurs at 356 °C, while in the Het-1:0.7 sample this event occur at 460 °C. The increase in decomposition temperature of the carbonate group (>100 °C) for the Het-1:0.7 sample is due to the formation of a heterojunction with strong interaction between the phases. This result suggests that the heterojunction was not formed by the complete dissolution of the Bi2O2CO3 phase followed by the subsequent crystallization of both phases in a segregated form, but rather the formation of BiVO4 occurred directly on the surface of Bi2O2CO3, which acts as a Bi provider.
1 was used. From these results, it is possible to observe that Bi2O2CO3 reacts completely to form BiVO4 in this condition. The Het-1:0.7 sample showed a weight loss of ∼4.3%, meaning that the Bi2O2CO3 content in this heterostructure is approximately 45 wt%, which is in close agreement with the theoretical amount, i.e. 40 wt% of Bi2O2CO3. The analysis of the derivative thermogravimetry (DTG) curves in Fig. 3b showed that the decomposition temperature of Bi2O2CO3 occurs at 356 °C, while in the Het-1:0.7 sample this event occur at 460 °C. The increase in decomposition temperature of the carbonate group (>100 °C) for the Het-1:0.7 sample is due to the formation of a heterojunction with strong interaction between the phases. This result suggests that the heterojunction was not formed by the complete dissolution of the Bi2O2CO3 phase followed by the subsequent crystallization of both phases in a segregated form, but rather the formation of BiVO4 occurred directly on the surface of Bi2O2CO3, which acts as a Bi provider.
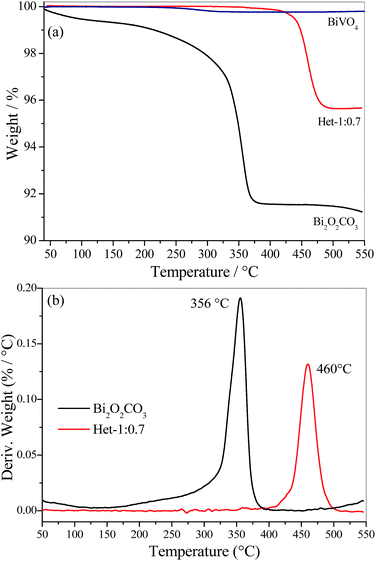 | ||
| Fig. 3 (a) Thermogravimetric analysis (TGA) and (b) their respective derivative (DTG) for Bi2O2CO3, BiVO4 and Het-1:0.7 samples. | ||
The morphology of the as-synthesized samples was examined using scanning electron microscopy (SEM), and representative images are shown in Fig. 4. The Bi2O2CO3 sample exhibited a typical morphology of this phase, i.e. micrometric sheets with nanometric thickness.6,8 Pure BiVO4 showed dense micrometric particles with different shapes and sizes. The heterostructured Bi2O2CO3/BiVO4 samples exhibited characteristic morphology referent to both phases in the same region. However, it can be observed that in some regions, apparently the Bi2O2CO3 phase was completely converted into BiVO4, resulting in a heterogeneous morphology.
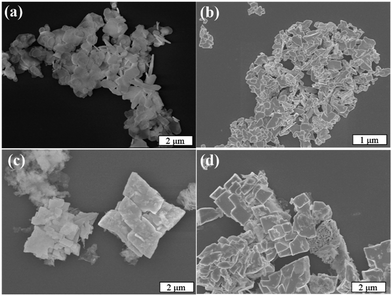 | ||
| Fig. 4 (a) Representative FE-SEM images of (a) Bi2O2CO3, (b) BiVO4 (c) Het-1:0.3 and (d) Het-1:0.7 samples. | ||
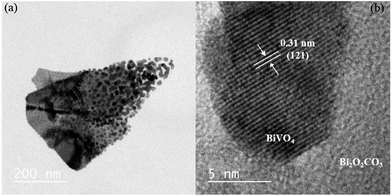
As shown in Fig. 5a, the Het-1:0.3 sample presented morphology very similar to pure Bi2O2CO3, except for the nanoparticles on its surface. The HRTEM image of this sample (Fig. 5b) confirms that the particles on the Bi2O2CO3 surface are BiVO4 in the monoclinic phase, Fig. 5b. The presence of BiVO4 over Bi2O2CO3 was identified by its interlayer distance of 0.31 nm referent to the (121) plane. This result indicates the formation of heterojunctions between the Bi2O2CO3 and BiVO4 phases.
The absorbance spectra of the as-synthesized samples (Fig. 6a) showing that the intermediary samples present intermediate spectral features to the isolated phases. This indicates that the BiVO4 formation acted by shifting the absorption spectra to the visible range, as initially proposed. However, it is clear that Het-1:0.7 sample is close to the expected BiVO4 absorbance despite the attested presence of Bi2O2CO3. The band gap values of the as-synthesized samples were determined by applying the Tauc equation to UV-vis DRS data (Fig. 6b). The Bi2O2CO3 and BiVO4 samples exhibited band gap values of 3.40 and 2.40 eV, respectively, which are in agreement with those described in the literature for these phases.5,6,32 The Het-1:0.3 sample exhibited two band gap values of 2.35 and 2.75 eV, which are related to both phases that compose it. The Het-1:0.7 sample showed only a band gap value of 2.40 eV related to BiVO4 phase, indicating that BiVO4 covering the surface of Bi2O2CO3, as observed by Raman analysis (Fig. 2).
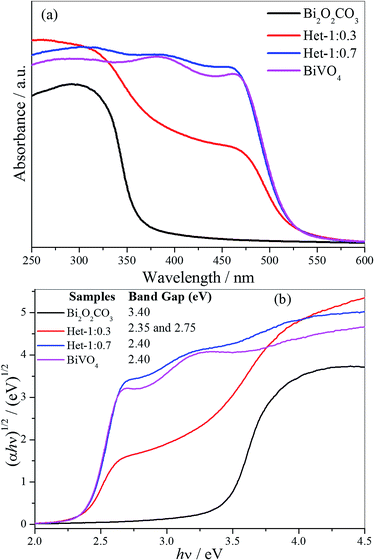 | ||
| Fig. 6 (a) UV-vis absorption spectra and (b) Tauc equation applied to DRS UV-vis data to obtain the band gap values of the Bi2O2CO3, BiVO4, Het-1:0.7 and Het-1:0.3 samples. | ||
The photocatalytic properties of the as-synthesized samples were evaluated by MB dye photodegradation under visible and UV irradiation (Fig. 7a and b). The experiments were conducted using two different radiation sources (visible and UV) because the Bi2O2CO3 phase is only active under UV irradiation. The self-photodegradation percentages of the MB dye (Fig. 7), i.e. direct photolysis, were approximately 6 and 14% under vis and UV irradiation, respectively. Further, before the photocatalytic tests, the as-synthesized samples were kept in contact with the MB dye solution for 120 min to reach adsorption/desorption equilibrium, and it was observed that all the samples presented insignificant MB adsorption, thus, the observed MB discoloration can be related to its oxidation. The MB photodegradation curves in Fig. 7a and b show that all samples were photoactive, since their curves are below the pure MB curve. The activity of the photocatalysts followed the same order under both radiation sources: Het-1:0.3 > Het-1:0.7 > BiVO4 > Bi2O2CO3, as observed in Table 1. In fact, from these results, it is clear that the heterostructured samples showed higher photoactivity than the pure Bi2O2CO3 and BiVO4 phases. This finding evidences interface creation between the Bi2O2CO3 and BiVO4 phases, resulting in the type-II heterostructure formation, and leading to an increase of charge carrier lifetime. It is worth pointing out that the heterostructure formation extended spectral response range since the heterostructure with the higher amount of Bi2O2CO3 showed higher photocatalytic performance under visible irradiation.
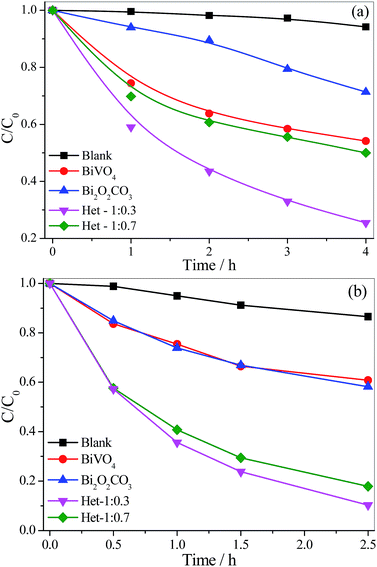 | ||
| Fig. 7 MB dye (5 mg L−1) photodegradation curves catalyzed by the isolated phases and the Bi2O2CO3/BiVO4 heterostructures under (a) visible and (b) UV irradiation. | ||
| Samples | kvis × 102/h−1 | kUV × 102/h−1 | SSA/m2 g−1 |
|---|---|---|---|
| MB | 1.0 | 6.0 | — |
| Bi2O2CO3 | 12.0 | 21.0 | 12.0 |
| Het-1:0.3 | 33.0 | 89.0 | 7.70 |
| Het-1:0.7 | 16.0 | 67.0 | 2.90 |
| BiVO4 | 14.0 | 19.0 | 2.70 |
Due to the nature of catalytic process, i.e. the process takes place on the catalyst's surface, the specific surface area (SSA) of the as-synthesized samples was determined (Table 1). The formation of BiVO4 on Bi2O2CO3 surface decreased the SSA compared to that of the Bi2O2CO3 precursor, because of morphological transformation. As previously seen in the SEM images (Fig. 4), the size of the particles increased after the synthesis of BiVO4. Therefore, this is an indication that any enhancement of the photocatalytic performance of the heterostructures cannot be related to their SSA.
In order to analyze the contribution of the sensitization mechanism in the degradation of organic pollutants catalyzed by as-synthesized samples, the photoactivity of samples (Fig. 8) was evaluated using a colorless organic pollutant, amiloride. Amiloride is a drug extensively used for the treatment of hypertension, belongs to a class of pharmaceutical compounds that are often found in wastewater and can adversely affect water quality. As shown in Fig. 8, the amiloride did not degrade significantly by direct photolysis even after 4.5 hours under visible irradiation. All samples were photoactive on degradation of amiloride, since their curves are below the pure amiloride curve. The activity of the photocatalysts followed the same order observed for MB degradation: Het-1:0.3 > Het-1:0.7 > Bi2O2CO3 > BiVO4. After 4.5 hours under visible irradiation, the amiloride degradation catalyzed by the heterostructured samples was up to 35%, whereas for Bi2O2CO3 and BiVO4 it was only 26 and 20%, respectively. In fact, from these results, it is clear that the heterostructured samples showed higher photoactivity than the pure Bi2O2CO3 and BiVO4 phases. We can confirm that the degradation of organic pollutants not occurred only by photo-sensitization mechanism.
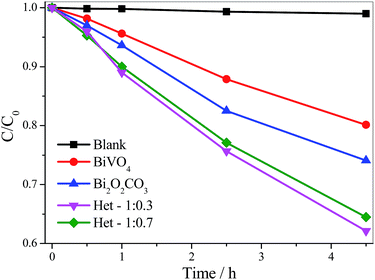 | ||
| Fig. 8 Amiloride (5 mg L−1) photodegradation curves catalyzed by the isolated phases and the Bi2O2CO3/BiVO4 heterostructures under visible irradiation. | ||
Despite the interesting and promising photocatalytic performance of the Bi2O2CO3/BiVO4 heterostructures, it is necessary that the mechanism involved in the photocatalytic process is elucidated. For this purpose, the ˙OH radicals were detected using the method proposed by Ishibashi et al.27,33 and also studied in great detail by our group.20,28 In this mechanism, the ˙OH radical is trapped by TA producing the fluorescent 2-hydroxyterephthalic acid, as illustrated in Fig. 9. The photoactivity of the as-synthesized samples on ˙OH radical formation followed the order: Het-1:0.3 > BiVO4 > Bi2O2CO3. Therefore, the observed trend in the photoactivity of the samples for MB dye degradation was the same as that observed for ˙OH radical formation, which indicates that an indirect mechanism (i.e., by ˙OH radical attack) plays an important role on the photoactivity of the as-synthesized heterostructure. The reduction potential of OH− in solution to ˙OH is approximately of 2.4 V,34 however, some studies showed that when the OH groups are adsorbed on the catalyst surface the reduction potential is decreased for 1.5 V.34–36 In this sense, the formation of ˙OH radical by the as-synthesized samples can occur in two steps, i.e. the adsorption of OH group on catalyst surface and subsequently OH group oxidation by holes formed in the valence band of photocatalyst.
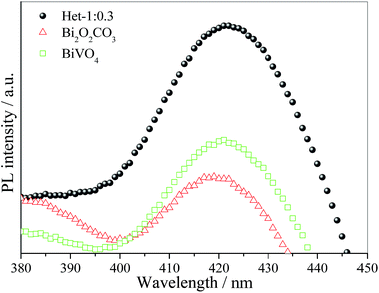 | ||
| Fig. 9 PL spectra of 2-hydroxyterephthalic acid formation using pure Bi2O2CO3, Het-1:0.3 and BiVO4 photocatalysts after 2 h under visible irradiation. | ||
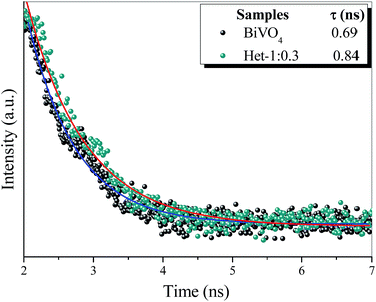
To confirm heterojunction formation and consequent increase in charge carrier lifetime the time resolved photoluminescence (TRPL) measurements of the BiVO4 and Het-1:0.3 samples were performed to find the constant lifetime of the electron/hole pairs (t). Fig. 10 exhibits the decay of PL intensity monitored at 545 nm and excited by a laser source centered at 405 nm for both samples. The PL decays of all the samples were fitted with a first order exponential function to calculate the lifetime of the electron/hole pair. The PL lifetime of the band–band emission (i.e., the electron/hole pair recombination) for Het-1:0.3 sample was 0.84 ns, while the BiVO4 sample was approximately 0.69 ns, which presents an increase of approximately 18%. These results confirm that the lifetime of the electron/hole pair of heterostructure (Het-1:0.3 sample) is significantly higher than that of the pure BiVO4 phase, proving that the heterojunction between Bi2O2CO3 and BiVO4 formed a suitable type-II heterostructure.
XPS analysis was performed to investigate the surface composition and chemical state of the elements of the BiVO4, Bi2O2CO3 and Het-1:0.7 samples, Fig. 11. From the survey spectra (Fig. 11a), the BiVO4 sample showed the presence of Bi, V, O and C (this was used as an internal reference, 284.8 eV). The Bi2O2CO3 and Het-1:0.7 samples showed only the presence of Bi, O and C. The high-resolution spectra of Bi 4f (Fig. 11b) exhibit two strong symmetrical characteristic spin–orbit splitting of Bi 4f peaks at about 158.9 and 164.4 eV, which are assigned to Bi 4f7/2 and Bi 4f5/2, respectively.6,8,15 A shift in Bi 4f peaks was observed from BiVO4 to Bi2O2CO3 phase, indicating that Bi atoms are in different chemical environments, however with the same chemical state (Bi3+). The high-resolution spectra of C 1s for the as-synthesized samples (Fig. 11c) showed two peaks located at 284.8 and 288.8 eV, which are ascribed to the carbon reference from the XPS instrument and to the carbonate ion (O–C![[double bond, length as m-dash]](https://www.rsc.org/images/entities/char_e001.gif) O) related to the Bi2O2CO3 phase.8 In this sense, although the XRD data (Fig. 1) showed a typical diffraction pattern of the pure BiVO4 phase, the C 1s XPS results reveal the presence of a small amount of CO32− group on the material's surface. The BiVO4 and Het-1:0.3 samples exhibited two peaks of V 2p (Fig. 11d), which are related to the BiVO4 phase, while the Bi2O2CO3 sample did not present any peaks related to the V atom. Fig. 11e shows that the high-resolution O 1s spectra of the Bi2O2CO3, Het-1:0.3 and BiVO4 samples exhibited three peaks (with different intensities) at 529.6, 530.8, and 531.8 eV, respectively. The shoulder peak at 529.6 eV is ascribed to the oxygen attached to the Bi–O bond, and the other two peaks at ca. 530.8 and 531.8 eV can be assigned to lattice oxygen and chemisorbed OH and C–O species in Bi2O2CO3, respectively.6 The different intensities for the two peak related to O species are expected for the Het-1:0.3 samples due to the coexistence of both crystalline phases.
O) related to the Bi2O2CO3 phase.8 In this sense, although the XRD data (Fig. 1) showed a typical diffraction pattern of the pure BiVO4 phase, the C 1s XPS results reveal the presence of a small amount of CO32− group on the material's surface. The BiVO4 and Het-1:0.3 samples exhibited two peaks of V 2p (Fig. 11d), which are related to the BiVO4 phase, while the Bi2O2CO3 sample did not present any peaks related to the V atom. Fig. 11e shows that the high-resolution O 1s spectra of the Bi2O2CO3, Het-1:0.3 and BiVO4 samples exhibited three peaks (with different intensities) at 529.6, 530.8, and 531.8 eV, respectively. The shoulder peak at 529.6 eV is ascribed to the oxygen attached to the Bi–O bond, and the other two peaks at ca. 530.8 and 531.8 eV can be assigned to lattice oxygen and chemisorbed OH and C–O species in Bi2O2CO3, respectively.6 The different intensities for the two peak related to O species are expected for the Het-1:0.3 samples due to the coexistence of both crystalline phases.
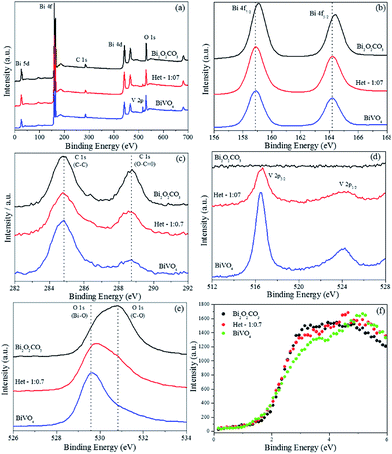 | ||
| Fig. 11 X-ray photoelectron spectra of the BiVO4, Bi2O2CO3 and Het-1:0.7 samples. (a) Survey spectra, (b) high-resolution spectra of Bi 4f, (c) C 1s, (d) V 2p, (e) O 1s and (f) valence band region. | ||
To determine the valence band (VB) edges of the as-synthesized photocatalysts, the total densities of the VB states of the samples were measured by XPS valence band region (VB-XPS).37 The conduction band (CB) bottom potentials of the three samples can be obtained using the equation ECB = EVB − Eg. As shown in Fig. 11f, the VB top of Bi2O2CO3, BiVO4 and Het-1:0.3 were determined to be 1.8, 1.4, 1.5 eV, respectively. This result indicates that an interfacial structure was formed, and the local environment and electron density of the elements changed to some extent. Therefore, the comparison of the band structures of isolated Bi2O2CO3 and BiVO4 samples is shown in Fig. 12a (before contact). On the other hand, it is well know that when the two semiconductors are in contact Fig. 12b, their Fermi levels must be equal. Therefore, the CB and VB positions of Bi2O2CO3 and BiVO4 change to reach the equilibration of their Fermi levels (Ef).38–41 Therefore, heterojunction formation allows the diffusion of electrons from the CB of BiVO4 to the CB of Bi2O2CO3, while the holes transfer from the VB of Bi2O2CO3 to the VB of BiVO4, resulting in an accumulation of electrons in the CB of Bi2O2CO3 and holes in the VB of BiVO4. As a matter of fact, the Bi2O2CO3/BiVO4 heterostructures could effectively separate the photogenerated electron/hole pairs and remarkably reduce the recombination of photogenerated charge carrier, as observed by the TRPL and photocatalytic results. Therefore, the Bi2O2CO3/BiVO4 heterostructures exhibit the best photocatalytic activity for the degradation of MB dye under visible and UV irradiation.
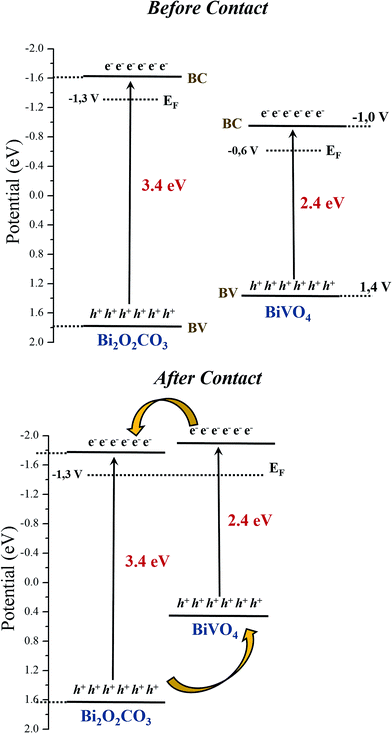 | ||
| Fig. 12 Estimated band positions from XPS and DRS results for Bi2O2CO3, BiVO4 samples, (a) before and (b) after contact.38–41 | ||
Conclusions
In summary, the method proposed was efficient to obtain Bi2O2CO3/BiVO4 heterostructures with significant enhancement of photocatalytic performance. The formation of the heterostructure was observed indirectly by the great increase in thermal stability of Bi2O2CO3 phase when compared to its pure phase. The heterojunctions formed between Bi2O2CO3 and BiVO4 were indicated by HRTEM image. The Bi2O2CO3/BiVO4 heterostructures showed higher photoactivities than their isolated phases (i.e., Bi2O2CO3 and BiVO4) for MB degradation under both visible and UV irradiation. The photodegradation of MB dye is caused by the action of ˙OH radicals, i.e. by an indirect mechanism. The TRPL spectroscopy and XPS results revealed that the formation of the heterostructure led to an effective spatial separation of charge carriers, with consequent increase in lifetime of heterostructure, which confirmed that Bi2O2CO3/BiVO4 is a type-II heterostructure.Conflicts of interest
There are no conflicts of interest to declare.Acknowledgements
The authors are grateful to the Ministry of Science, Technology, and Innovation (through SisNANO Program – National System of Laboratories in Nanotechnology), the FAPESP (grants no. 13/13888-0, 15/12304-0 and 16/09746-3), CNPq (grants no. 310863/2014-7), CAPES and FINEP for financial support. We are also grateful to the Energy and Materials Research Laboratory – Brazilian Nanotechnology National Laboratory (LNNano) for the technical support during the X-ray photoelectron spectroscopy analysis (grants no. XPS-18304).Notes and references
- O. F. Lopes, V. R. de Mendonça, F. B. F. Silva, E. C. Paris and C. Ribeiro, Óxidos de nióbio: uma visão sobre a síntese do Nb2O5 e sua aplicação em fotocatálise heterogênea, Quim. Nova, 2015, 38(1), 106–117 CAS.
- H. A. J. L. Mourão, V. R. de Mendonça, A. R. Malagutti and C. Ribeiro, Nanoestruturas em fotocatálise: uma revisão sobre estratégias de síntese de fotocatalisadores em escala nanométrica, Quim. Nova, 2009, 32, 2181–2190 CrossRef.
- Y. Park, K. J. McDonald and K.-S. Choi, Progress in bismuth vanadate photoanodes for use in solar water oxidation, Chem. Soc. Rev., 2013, 42, 2321–2337 RSC.
- J. Tian, Z. Zhao, A. Kumar, R. I. Boughton and H. Liu, Recent progress in design, synthesis, and applications of one-dimensional TiO2 nanostructured surface heterostructures: a review, Chem. Soc. Rev., 2014, 43, 6920–6937 RSC.
- N. Liang, J. Zai, M. Xu, Q. Zhu, X. Wei and X. Qian, Novel Bi2S3/Bi2O2CO3 heterojunction photocatalysts with enhanced visible light responsive activity and wastewater treatment, J. Mater. Chem. A, 2014, 2, 4208–4216 CAS.
- P. Madhusudan, J. Zhang, B. Cheng and G. Liu, Photocatalytic degradation of organic dyes with hierarchical Bi2O2CO3 microstructures under visible-light, CrystEngComm, 2013, 15, 231 RSC.
- R. Hu, X. Xiao, S. Tu, X. Zuo and J. Nan, Synthesis of flower-like heterostructured β-Bi2O3/Bi2O2CO3 microspheres using Bi2O2CO3 self-sacrifice precursor and its visible-light-induced photocatalytic degradation of o-phenylphenol, Appl. Catal., B, 2015, 163, 510–519 CrossRef CAS.
- P. Madhusudan, J. Ran, J. Zhang, J. Yu and G. Liu, Novel urea assisted hydrothermal synthesis of hierarchical BiVO4/Bi2O2CO3 nanocomposites with enhanced visible-light photocatalytic activity, Appl. Catal., B, 2011, 110, 286–295 CrossRef CAS.
- Z.-F. Huang, L. Pan, J.-J. Zou, X. Zhang and L. Wang, Nanostructured bismuth vanadate-based materials for solar-energy-driven water oxidation: a review on recent progress, Nanoscale, 2014, 6, 14044–14063 RSC.
- J. S. Jang, H. G. Kim and J. S. Lee, Heterojunction semiconductors: a strategy to develop efficient photocatalytic materials for visible light water splitting, Catal. Today, 2012, 185, 270–277 CrossRef CAS.
- Y. He, Y. Wang, L. Zhang, B. Teng and M. Fan, High-efficiency conversion of CO2 to fuel over ZnO/g-C3N4 photocatalyst, Appl. Catal., B, 2015, 168, 1–8 Search PubMed.
- J. Lei, Y. Chen, F. Shen, L. Wang, Y. Liu and J. Zhang, Surface modification of TiO2 with g-C3N4 for enhanced {UV} and visible photocatalytic activity, J. Alloys Compd., 2015, 631, 328–334 CrossRef CAS.
- S. Zhu, S. Liang, Q. Gu, L. Xie, J. Wang, Z. Ding and P. Liu, Effect of Au supported TiO2 with dominant exposed {0 0 1} facets on the visible-light photocatalytic activity, Appl. Catal., B, 2012, 119–120, 146–155 CrossRef CAS.
- X. Zheng, D. Li, X. Li, J. Chen, C. Cao, J. Fang, J. Wang, Y. He and Y. Zheng, Construction of ZnO/TiO2 photonic crystal heterostructures for enhanced photocatalytic properties, Appl. Catal., B, 2015, 168–169, 408–415 CrossRef CAS.
- O. F. Lopes, K. T. G. Carvalho, A. E. Nogueira, W. Avansi and C. Ribeiro, Controlled synthesis of BiVO4 photocatalysts: evidence of the role of heterojunctions in their catalytic performance driven by visible-light, Appl. Catal., B, 2016, 188, 87–97 CrossRef CAS.
- L. Chen, Q. Zhang, R. Huang, S.-F. Yin, S.-L. Luo and C.-T. Au, Porous peanut-like Bi2O3–BiVO4 composites with heterojunctions: one-step synthesis and their photocatalytic properties, Dalton Trans., 2012, 41, 9513–9518 RSC.
- Y. Cheng, H. Wang, Y. Zhu, F. Liao, Z. Li and J. Li, One-step hydrothermal synthesis of BiVO4–Bi2O3 p–n heterojunction composites and their enhanced photocatalysis properties, J. Mater. Sci.: Mater. Electron., 2015, 26, 1268–1274 CrossRef CAS.
- Z.-F. Huang, J. Song, L. Pan, X. Jia, Z. Li, J.-J. Zou, X. Zhang and L. Wang, W18O49 nanowire alignments with a BiOCl shell as an efficient photocatalyst, Nanoscale, 2014, 6, 8865 RSC.
- V. R. de Mendonça, C. J. Dalmaschio, E. R. Leite, M. Niederberger and C. Ribeiro, Heterostructure formation from hydrothermal annealing of preformed nanocrystals, J. Mater. Chem. A, 2015, 3, 2216–2225 Search PubMed.
- V. R. De Mendonça, O. F. Lopes, R. P. Fregonesi, T. R. Giraldi and C. Ribeiro, TiO2–SnO2 heterostructures applied to dye photodegradation: the relationship between variables of synthesis and photocatalytic performance, Appl. Surf. Sci., 2014, 298, 182–191 CrossRef.
- A. E. Nogueira, O. F. Lopes, A. B. S. Neto and C. Ribeiro, Enhanced Cr(VI) photoreduction in aqueous solution using Nb2O5/CuO heterostructures under UV and visible irradiation, Chem. Eng. J., 2017, 312, 220–227 CrossRef CAS.
- O. F. Lopes, K. T. G. Carvalho, W. Avansi and C. Ribeiro, Growth of BiVO4 Nanoparticles on a Bi2O3 Surface: Effect of Heterojunction Formation on Visible Irradiation-Driven Catalytic Performance, J. Phys. Chem. C, 2017, 121, 13747–13756 CAS.
- K. T. G. Carvalho, A. E. Nogueira, O. F. Lopes, G. Byzynski and C. Ribeiro, Synthesis of g-C3N4/Nb2O5 heterostructures and their application on removal of organic pollutants under visible and ultraviolet irradiation, Ceram. Int., 2017, 43(4), 3521–3530 CrossRef CAS.
- Z. Zhou, Y. Li, K. Lv, X. Wu, Q. Li and J. Luo, Fabrication of walnut-like BiVO4@Bi2S3 heterojunction for efficient visible photocatalytic reduction of Cr(VI), Mater. Sci. Semicond. Process., 2017, 75, 334–341 CrossRef.
- H. Cheng, B. Huang, J. Lu, Z. Wang, B. Xu, X. Qin, X. Zhang and Y. Dai, Synergistic effect of crystal and electronic structures on the visible-light-driven photocatalytic performances of Bi(2)O(3) polymorphs, Phys. Chem. Chem. Phys., 2010, 12, 15468–15475 RSC.
- K. Ishibashi and A. Fujishima, Detection of active oxidative species in TiO2 photocatalysis using the fluorescence technique, Electrochem. Commun., 2000, 2, 207–210 CrossRef CAS.
- K. Ishibashi and A. Fujishima, Quantum yields of active oxidative species formed on TiO2 photocatalyst, J. Photochem. Photobiol., A, 2000, 134, 139–142 CrossRef CAS.
- O. F. Lopes, E. C. Paris and C. Ribeiro, Synthesis of Nb2O5 nanoparticles through the oxidant peroxide method applied to organic pollutant photodegradation: A mechanistic study, Appl. Catal., B, 2014, 144, 800–808 CrossRef CAS.
- H. A. J. L. Mourão, O. F. Lopes, A. R. Malagutti, E. C. Paris and C. Ribeiro, Hydrothermal synthesis and photocatalytic properties of anatase TiO2 nanocrystals obtained from peroxytitanium complex precursor, Mater. Sci. Semicond. Process., 2014, 25, 320–329 CrossRef.
- Y. Zheng, F. Duan, M. Chen and Y. Xie, Synthetic Bi2O2CO3 nanostructures: Novel photocatalyst with controlled special surface exposed, J. Mol. Catal. A: Chem., 2010, 317, 34–40 CrossRef CAS.
- M. De-Kun, M. Guan, S. Liu, Y. Zhang, C. Zhang, Y. He and S. Huang, Controlled synthesis of olive-shaped Bi2S3/BiVO4 microspheres through a limited chemical conversion route and enhanced visible-light-responding photocatalytic activity, Dalton Trans., 2012, 41, 5581–5586 RSC.
- O. F. Lopes, K. T. G. Carvalho, G. K. Macedo, V. R. de Mendonça, W. Avansi and C. Ribeiro, Synthesis of BiVO4 via oxidant peroxo-method: insights into the photocatalytic performance and degradation mechanism of pollutants, New J. Chem., 2015, 39, 6231–6237 RSC.
- K. Ishibashi, A. Fujishima, T. Watanabe and K. Hashimoto, Detection of active oxidative species in TiO2 photocatalysis using the fluorescence technique, Electrochem. Commun., 2000, 2, 207–210 CrossRef CAS.
- Y. Nosaka and A. Nosaka, Understanding Hydroxyl Radical (˙OH) Generation Processes in Photocatalysis, ACS Energy Lett., 2016, 1, 356–359 CrossRef CAS.
- D. Lawless, N. Serpone and D. Meisel, Role of hydroxyl radicals and trapped holes in photocatalysis. A pulse radiolysis study, J. Phys. Chem., 1991, 95, 5166–5170 CrossRef CAS.
- S. Tojo, T. Tachikawa, M. Fujitsuka and T. Majima, Oxidation processes of aromatic sulfides by hydroxyl radicals in colloidal solution of TiO2 during pulse radiolysis, Chem. Phys. Lett., 2004, 384, 312–316 CrossRef CAS.
- X. Xiao, C. Xing, G. He, X. Zuo, J. Nan and L. Wang, Solvothermal synthesis of novel hierarchical Bi4O5I2 nanoflakes with highly visible light photocatalytic performance for the degradation of 4-tert-butylphenol, Appl. Catal., B, 2014, 148–149, 154–163 CrossRef CAS.
- J. K. Cooper, S. Gul, F. M. Toma, L. Chen, P.-A. Glans, J. Guo, J. W. Ager, J. Yano and I. D. Sharp, Electronic Structure of Monoclinic BiVO4, Chem. Mater., 2014, 26(18), 5365–5373 CrossRef CAS.
- N. Liang, M. Wang, L. Jin, S. Huang, W. Chen, M. Xu, Q. He, J. Zai, N. Fang and X. Qian, Highly efficient Ag2O/Bi2O2CO3 p–n heterojunction photocatalysts with improved visible-light responsive activity, ACS Appl. Mater. Interfaces, 2014, 6, 11698–11705 CAS.
- C. Liu and B. Chai, Facile ion-exchange synthesis of BiOI/Bi2O2CO3 heterostructure for efficient photocatalytic activity under visible light irradiation, J. Mater. Sci.: Mater. Electron., 2015, 26, 2296–2304 CrossRef CAS.
- G. Zhu, Y. Liu, M. Hojamberdiev, J. Han, J. Rodríguez, S. A. Bilmes and P. Liu, Thermodecomposition synthesis of porous β-Bi2O3/Bi2O2CO3 heterostructured photocatalysts with improved visible light photocatalytic activity, New J. Chem., 2015, 39, 9557–9568 RSC.
| This journal is © The Royal Society of Chemistry 2018 |

