 Open Access Article
Fabricating high thermal conductivity rGO/polyimide nanocomposite films via a freeze-drying approach†
Shiyang Wei,
Qiaoxi Yu,
Zhenguo Fan,
Siwei Liu *,
Zhenguo Chi
 ,
Xudong Chen
 ,
Yi Zhang
 * and
Jiarui Xu
PCFM Lab, GD HPPC Lab, Guangdong Engineering Technology Research Centre for High-performance Organic and Polymer Photoelectric Functional Films, State Key Laboratory of Optoelectronic Materials and Technologies, Materials Science Institute, School of Chemistry, Sun Yat-sen University, Guangzhou 510275, China. E-mail: liusiw@mail.sysu.edu.cn; ceszy@mail.sysu.edu.cn; Fax: +86 20 84112222; Tel: +86 20 84112222
First published on 15th June 2018
Abstract
The preparation of polymeric composite materials with low filler content as well as high thermal conductivity has been an important subject for the field of polymer material research. During our recent investigation on polyimide (PI), it was found that poly(amic acid) (PAA) solution (in dimethylacetamide, DMAc) could crystallize at low temperature. When adding reduced graphene oxide (rGO) as the thermal conductive fillers in the PAA solution, it was also found that the crystallization process of PAA would impel the rGO to rearrange in order and form an aligned thermal conductive network. To retain the rGO network structure, the freeze-drying technique was used to remove the solvent. Subsequently, through a thermal imidization process the final rGO/PI films containing a 3D rGO network could be obtained. The PI composite films retain good flexibility, excellent thermal stability, and exhibit excellent thermal conductivity. When the content of rGO added is 8 wt%, the thermal conductivity of the rGO/PI film can reach a high value of 2.78 W m−1 K−1, which is about 15.4 times that of neat PI and 5.5 times that of the rGO/PI composite film prepared by the conventional two-step routine with the same content of rGO.
Introduction
Polyimides (PIs) are representative high-performance materials due to their excellent thermal stability, good mechanical and dielectric properties, flexibility and light weight. Therefore, PIs are used in various fields, such as microelectronics, electronic packing, and aerospace applications.1,2 Along with the rapid development of the microelectronics industry, the structure of various electronic components is becoming more and more complex, and their size is getting smaller. These devices produce a lot of heat while working. If the generated heat is not dissipated in time, it will seriously affect the stability and working life of the electronic devices.3–5 However, the thermal conductivity of neat PI (about 0.19 W m−1 K−1) is poor,6,7 and thus limits its wider application in the field of electronics. Therefore, there is an urgent need to develop high thermal conductivity PI films.To improve materials' thermal conductivity, a conventional method8,9 is to add fillers into the polymer matrix to form interconnected thermal conductive filler networks. Commonly used fillers are BN,10,11 AlN,12,13 Si3N4,14,15 Al2O3,16–18 carbon filler,19–22 and so on. Because these fillers have excellent thermal conductivity, the formed filler networks in the polymer matrix could remarkably improve the thermal conductivity of the composite materials. Due to the influence of contact resistance and interfacial phonon scattering,23,24 the method of increasing the heat conduction is usually to increase the amount of filler to reduce the defects and/or increase the tightness between the fillers, to ensure the interconnected network has a good ability of thermal transfer. However, when the filler content is too high, the mechanical properties of the composites will decrease remarkably,25 as well as the large amount of fillers will also cause waste of raw materials. Therefore, how to prepare the composite materials with both low filler content and high thermal conductivity has been a challenging subject to the polymer researchers.
The thermal conductivity composite materials require that the fillers have excellent thermal conductivity. Theoretically, the thermal conductivity of graphene can reach 5000 W m−1 K−1.26 So, graphene is suitable filler for achieving high thermal conductivity. Sue's group27 reported that the thermal conductivity of an epoxy nanocomposite modified by graphene nanosheets at 5 wt% could increase up to 0.56 W m−1 K−1, approximately 2.5 times of the neat epoxy. At an ultralow graphene loading (1.04 wt%), the reduced graphene oxide/thermoplastic polyurethane (rGO/TPU) composites exhibit a high thermal conductivity of 0.8 W m−1 K−1.28 As a two-dimensional material, graphene has over 100-fold anisotropy of heat flow between the in-plane and out-of-plane directions. High in-plane thermal conductivity is because of the covalent sp2 bonding between carbon atoms, whereas out-of-plane heat flow is limited by weak van der Waals coupling.29 Because of the anisotropy of graphene's thermal conductivity, it is necessary to consider whether the orientation of graphene flakes is consistent with the direction of heat dissipation while practical application in the preparation of graphene composites, so as to maximize the use of graphene thermal conductivity network.
At present, the fabrication of composite materials with aligned filler network inside is mostly prepared by a tedious multiple step strategy, e.g., first forming an aligned skeleton filler network, and then fabricating composite material by infiltration. Liu30 reported that they fabricated closely packed and aligned bulk multilayer graphene (MLG) first, then infiltrated epoxy monomers into the gaps between the MLG layers, finally achieved aligned MLG/epoxy composite with ultrahigh thermal conductivity (33.54 W m−1 K−1) after curing. Cui's group31 reported that the composite at an ultralow graphene loading (0.92 vol%) exhibits a high thermal conductivity (2.13 W m−1 K−1) by using a controlled three-step strategy. The hybrid film PI/functionalized boron nitride/glycidyl methacrylate-grafted graphene shows high thermal conductivity at 2.11 W m−1 K−1.32 The thermal conductivity of PI/3DSG (three-dimensional structure composed of SiC nanowire@graphene sheets) with 11 wt% filler contents could be up to 2.13 W m−1 K−1.33 Although the multiple-steps method could be an effective way to prepare high thermal conductivity composites, there are some limitations in the preparation of composite films. Because the thickness of the final composite film is usually quite thin, especially for PI films used in the microelectronics industry, from dozens to 100 μm, the multiple-step method is required to prepare the corresponding thickness of the filler network first. However, for graphene, the preparation of ultra-thin aligned network is very difficult. In the meantime, because the graphene network density is small, and its strength is low, the formed filler network is very easy to be destroyed and thus difficult to preserve its structure during the subsequent operations.
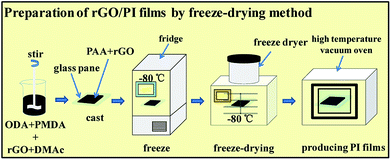
Herein, we present a facile and scalable route to fabricate PI composite films with excellent thermal conductivity having three dimension (3D) graphene networks inside the PI matrix. First, we dispersed rGO and poly(amic acid) (PAA) in DMAc (dimethylacetamide), then froze the dispersions at −80 °C for 12 h, and finally removed DMAc by freeze-drying technique to get a rGO/PAA film. Subsequently, the achieved film was treated by a thermal imidization process to yield the final rGO/PI film. The advantage of this method over conventional multi-step method is that the pre-preparation of the aligned rGO network would not be needed. Unlike the conventional workflow, the freeze-drying technique was used to remove the solvent rather than by heating PAA solution in a vacuum oven. The thermal conductivity of the rGO/PI films fabricated by this method is much better than that prepared by conventional methods. The thermal conductivity of the rGO/PI film can reach 2.78 W m−1 K−1 when the filler content is 8 wt%, which is about 15.4 times of neat PI (0.18 W m−1 K−1) and 5.5 times of rGO/PI composite film (0.51 W m−1 K−1) prepared by conventional two-step routine with the same content of rGO. And this method is simple and practical, and suitable for large-scale production, opening a new way for fabricating composite PI films with excellent thermal conductivity property.
Experimental
Materials
Graphite flakes (Catalog#200 U) were provided by Qingdao Middle East Graphite Co., Ltd.,Qingdao. H2SO4 (98%), KMnO4, NaNO3, H2O2, HCl (36.5%) and N-N-dimethylacetamide (DMAc) was purchased from Guangzhou Chemical Reagent Co. Ltd., Guangzhou. Pyromellitic dianhydride (PMDA) and 4,4′-diaminodiphenyl ether (ODA) was purchased from Aladdin reagent network. All chemicals were of analytical reagent grade and used without further purification.Synthesis
Characterization and instruments
The micro morphologies of PI composite films were observed by using scanning electron microscopy (FE-SEM, Japan, s4800). The samples were fractured in liquid N2, and then stuck on the conducting resin for spraying and testing. Atomic force microscope (AFM) was used to confirm the thickness and size of rGO. The concentration of 0.1 mg mL−1 rGO ethanol droplets was dropped onto the clean mica and dried in vacuum oven. Polarized-light optical microscope (POM) image was used to collect the growth process of PAA crystal by using a Leica and optical images were taken by Leica DM. Fourier transform infrared (FTIR) spectra were recorded on a Hyperiontm A670-B FTIR (Bruker Optik GMBH, Germany) between 400–4000 cm−1 using the KBr pellet method. The chemical composition of the GO and rGO was determined by X-ray photoelectron spectroscopy (XPS). Thermogravimetric analysis was conducted in a TGA system (NETZSCH, STA-449, Germany). The temperature range was set from 50 to 900 °C at a heating rate of 10 °C min−1 in nitrogen. Laser flash apparatus (LFA, NETZSCH 467, Germany) was used to characterize thermal diffusivity (α) of PI films at room temperature. The films were cut into 12.7 mm wafers. Different scanning calorimeter (DSC, TA Instrument model 2940) was used to measure the specific heat (c) of the films. The density (ρ) of the PI films was measured with the water displacement method (Alfa Mirage Co. Ltd, Electronic Densimeter SD-200L). The thermal conductivity (λ) was calculated using the equation: λ = cρα. Tg and CTE were measured via a thermal mechanical analyser (TMA, Q400, USA.), at a heating rate of 10 °C min−1.Results and discussion
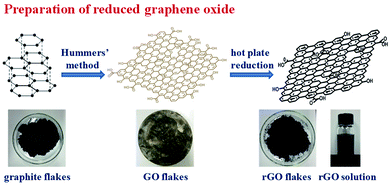
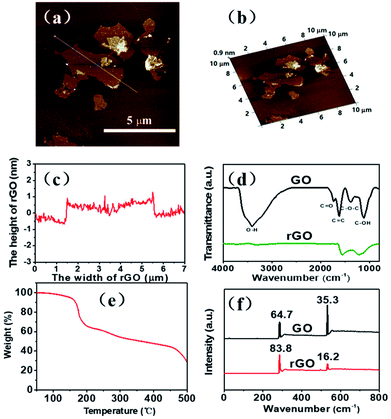
In preparing GO, it is oxidized by strong oxidant, which could carry many oxygen functional groups onto its surface and accompany with the severe damage of the crystal structure. Therefore, its conductivity and thermal conductivity is decreased significantly.36,37 To restore its thermal conductivity, a reduction method is usually used to remove some of the oxygen functional groups on its surface and to repair some of the surface damage structures.38–40 Among them, the thermal reduction method has a good repair effect, and it can preserve some functional groups on the surface of rGO, thus it is helpful for the rGO to be better dispersed in PI films through polarity interactions between these groups with PI. The synthesis of GO was accomplished by a modified literature procedure presented by Hummers, and subsequently rGO was prepared through thermal reduction, as illustrated in Scheme 1.In our experiment, tapping-mode AFM observation shows that the rGO thickness is about 1 nm as well as the sheet size is about 4 μm (Fig. 1a–c). The FT-IR results (Fig. 1d) show that the GO flake contain –OH, –COOH, –O–, and other functional groups. After thermal reduction, the obtained rGO sheets still have a small number of oxygen-containing function groups, which could help rGO to disperse well in the DMAc solvent through polarity interaction (Scheme 1). In the thermal gravimetric analysis (Fig. 1e) (TGA) in nitrogen atmosphere, the GO sample has a weightlessness platform at about 180 °C, probably corresponding to the decomposition of oxygen-containing functional groups in the thermal reduction process. After 450 °C, the weight of GO is basically no longer changed, therefore, we determined that the heat reduction temperature is 450 °C. After the reduction procedure, the ratio of C![[thin space (1/6-em)]](https://www.rsc.org/images/entities/char_2009.gif) :
:![[thin space (1/6-em)]](https://www.rsc.org/images/entities/char_2009.gif) O increased significantly determined by XPS, from 1.8
O increased significantly determined by XPS, from 1.8![[thin space (1/6-em)]](https://www.rsc.org/images/entities/char_2009.gif) :
:![[thin space (1/6-em)]](https://www.rsc.org/images/entities/char_2009.gif) 1 to 5.2
1 to 5.2![[thin space (1/6-em)]](https://www.rsc.org/images/entities/char_2009.gif) :
:![[thin space (1/6-em)]](https://www.rsc.org/images/entities/char_2009.gif) 1 (Fig. 1f), further verifying the content of oxygen-containing functional groups decreased during the thermal reduction.
1 (Fig. 1f), further verifying the content of oxygen-containing functional groups decreased during the thermal reduction.
When solvent crystallizes, the lattice can aggregate into an orderly structure.41 When a high concentration GO suspension is crystallized at a low temperature, long-range ordered microstructures of GO could be observed.42 By using freeze-drying technique, Lian group31 presented a controlled three-step procedure to fabricate vertically aligned and interconnected GO/epoxy: formation of GO liquid crystals, oriented freeze casting, and annealing reduction under argon. The crystallization phenomenon of GO/PAA suspension at low temperature can be observed by a polarizing microscope. Taking advantage of this phenomenon, the freeze-drying technique was used to treat the rGO/PAA suspension, hoping to induce rGO orderly rearrangement in the process of freezing crystallization, so as to build more efficient rGO heat conduction network. The schematic diagram of the preparation process is shown in Scheme 2.
The polarizing microscope photo of DMAc crystallization at −80 °C is shown in Fig. 2. When the temperature is about −30 °C, DMAc begins to crystallize. The crystals continue to grow while the temperature drops to −80 °C. With the prolongation of time, the crystalline size of DMAc grows gradually. Compared with the crystal morphology observed after 10 h (Fig. 2f), after 6 h (Fig. 2e) it basically did not change. It can be concluded that the crystal of DMAc is accompanied after 6 h of freezing. The low temperature crystallization behaviors of other traditional solvents (DMF and NMP) used in the preparation of polyimide were also studied and the results are shown in Fig. S1.†
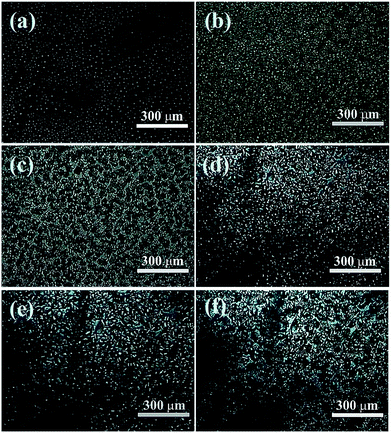 | ||
| Fig. 2 POM images of DMAc with different freezing time: (a) beginning, (b) 1 h, (c) 2 h, (d) 3 h, (e) 6 h, (f) 10 h. | ||
Under the similar condition, the crystalline properties of PAA in solvents of DMAc, DMF and NMP were investigated under polarized microscope, respectively. The results (Fig. S2†) showed that PAA can crystallize only in DMAc, which may due to the interaction of PAA macro chain with the DMAc solvent molecules. The growth processes of PAA crystals with different solid content are further studied and the results are shown in Fig. S3–S6† (with solid content of 4 wt%, 8 wt%,12 wt% and 15 wt%, respectively). As can be seen, the crystallization rate and crystalline morphology of PAA in DMAc with different solid content are quite different. As the increase of solid content, the crystallization rate of PAA decreases dramatically. For the 4 wt% solid content system, the crystallization process finished at about 60 s, and that of other system was about 120 s for 8 wt%, 10 min for 12 wt%, and 40 min for 15 wt%, respectively. When the solid content is lower than 8%, the PAA molecular chains tend to grow in the form of wafers and such kind of wafers distribute isolated and randomly, as shown in Fig. 3a and b. When the solid content is further increased, it is interesting to find that the crystallization of PAA turns into a form of spherulite (Fig. 3c and d). For the 12 wt% system (Fig. S5†), when the temperature is about −55 °C, the formation of the nucleation could be initially observed. When temperature lower down to −80 °C, the PAA crystals grow radially along the nucleus and the gap between the crystals become smaller and smaller, and finally merged together with clear crystal boundary. From Fig. 3g and h, one can also notice that for the 15 wt% solid content system, the crystalline structure of PAA become more compact than that of 12 wt% system. In addition, due to the different arrangement of PAA crystals with different solid contents, mutual shielding between crystals causes different images with different light and shade at different polarizing angles. The more regular the wafer arranged, the more regular the bright and dark distribution (Fig. S7–S10†).
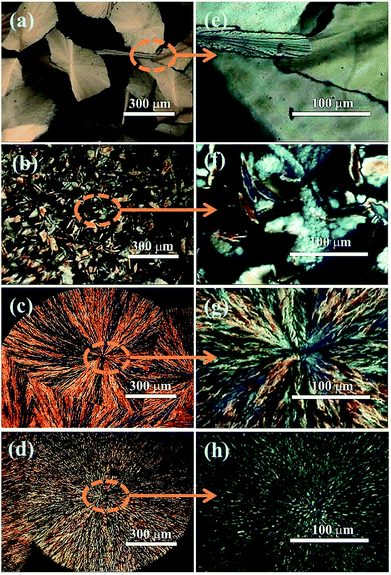 | ||
| Fig. 3 POM images of PAA with different solid content at low magnification: (a) 4%, (b) 8%, (c) 12%, (d) 15%. Corresponding POM images of PAA at high magnification: (e) 4%, (f) 8%, (g) 12%, (h) 15%. | ||
From the previous experimental results, it is known that only when the PAA solid content is higher than 12%, the crystal will appear local orderly alignment, which is suitable to prepare ordered filler networks by freeze-drying technique. When the solid content of PAA reaches 15%, the crystallization might be too tight to be suitable for large size fillers, such as rGO. Combined with the above consideration, the rGO/PAA/DMAc system with PAA solid content of 12 wt% was chosen to prepare the nanocomposite films. After cryopreservation, the suspension can generate regular aligned crystals with suitable size, providing enough space to change the orientation of rGO under the driving force produced by PAA crystallization.
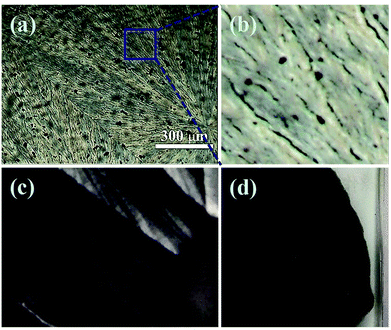
A various of rGO/PAA dispersions with PAA solid content of 12 wt% in DMAc were prepared with a rGO content of 2 wt%, 4 wt%, 6 wt% and 8 wt% respectively. The POM images of 2 wt% rGO/PAA/DMAc sample (Fig. 4a and b) showed that part of rGO is arranged on the surface of PAA colloid in a flat way, while part of rGO was intermingled in PAA solution in the perpendicular direction. It might be that during the growth of PAA crystals, the rGO between PAA crystals was driven by the driving force of crystal growth, and the orientation was changed. As the PAA crystals grew up, the distances between PAA crystals were getting smaller. Until the PAA crystals meet together, the rGO between the crystals was perpendicular retained in the gaps of the PAA crystals by the extrusion of the PAA crystals. As shown in Fig. 4c, an orderly strip can be seen clearly on its surface. Due to the crisscrossed arrangement of rGO, rGO formed a 3D network structure in PAA. In order to retain the rGO network structure, the freeze-drying technique was used to remove the DMAc solvent, leaving the PAA film containing 3D rGO networks (Fig. 4d). rGO/PI films with the pre-formed 3D rGO network could be obtained through the following thermal imidization. The existence of 3D rGO network in the PI would endow higher thermal conductivity to the PI films.
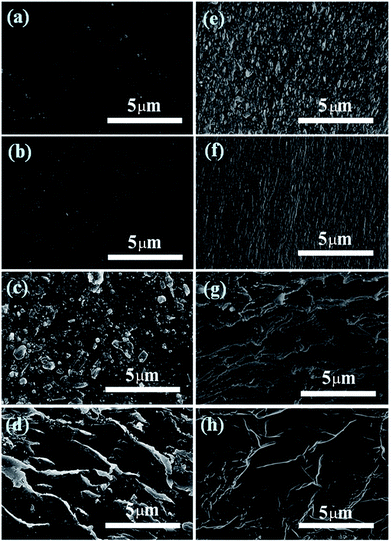
The morphologies of the top surfaces and the fracture surface of the final neat PI and rGO/PI films by SEM are shown in Fig. 5. Both the top and fracture surfaces of neat PI prepared by conventional method and freeze-drying method are relatively flat and smooth (Fig. 5a, b, e and f). A randomly distributed rGO flakes could be seen in the surface of rGO/PI (8 wt%) made by conventional method, and the horizontal direction of the rGO sheet is parallel with the horizontal direction of the PI film (Fig. 5c). From the fracture surface of the rGO/PI fabricated by conventional method (Fig. 5g), we can see that most of the rGO are distributed in a near-tiled manner in the rGO/PI. However, this arrangement of rGO causes the heat transfer passing through the radial direction of rGO, the heat conduction efficiency of which is low, thus the thermal conduction help for the PI films is limited. In the rGO/PI composite films prepared by freeze-drying method, rGO are perpendicular in the top surface of the films and crisscrossed in the fracture surface. It is proved that rGO exists in the way of 3D network structure in rGO/PI. According to the arrangement mode, part of the heat transfer can be passed through the axial direction of the rGO, so that the heat conduction potential of the rGO can be greatly released. Because of this, it could improve the thermal conductivity of rGO/PI thin films significantly.
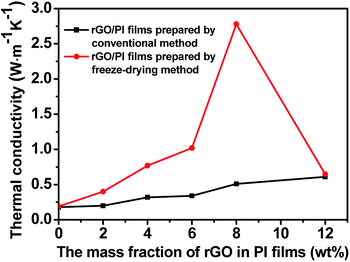
By measuring the thermal diffusivity, density and heat capacity of neat PI and the rGO/PI films (Table S1 and S2†), their thermal conductivity can be calculated, as shown in Fig. 6. The thermal conductivity of neat PI prepared by freeze-drying method is 0.18 W m−1 K−1, which is nearly the same as that of the neat PI prepared by conventional method. When the mass fraction of rGO is 2 wt%, the thermal conductivity of the rGO/PI prepared by conventional method almost has no change compared to that of the neat PI. However, the thermal conductivity of rGO/PI film prepared by freeze-drying method can reach 0.49 W m−1 K−1, which is 2.6 times as much as that prepared by conventional methods. Probably this is because of the alignment orientation of rGO induced by freeze-drying method. The axial direction of partial rGO could be consistent with the direction of heat conduction of rGO/PI, thus greatly improving their thermal conductivity. With the increase of rGO mass fraction, the thermal conductivity of rGO/PI films is further improved. For the film containing 8 wt% of rGO, the thermal conductivity could achieve a very high value of 2.78 W m−1 K−1, which is 15.4 times of the corresponding neat PI film and 5.5 times of rGO/PI composite film prepared by conventional method with the same rGO content. However, increasing the amount of rGO will result in a sharp decrease in thermal conductivity. Probably the filler would be more easily aggregated at higher rGO content. Therefore, the rGO would be impossible to rearrange to form ordered network during freeze-drying procedure. For the rGO/PI films systems with appropriate rGO contents by freeze-drying method, as can been seen in Fig. 5h and a complete 3D structure heat conduction network of rGO can be built up, which is beneficial to significantly improving the thermal conductivity of the rGO/PI films.
The increase in the thermal conductivity of the rGO/PI along with increasing the content of rGO could be attributed to several factors as follows: (1) the high thermal conductivity of rGO. (2) The heat conduction networks of the 3D rGO structure in PI composite films. The thermal conductivity of such a network is much larger than that of neat PI, so it could improve the thermal conductivity of the rGO/PI nanocomposite film efficiently. (3) The orientation of rGO. Proper orientation of rGO is beneficial to heat transfer, which improves the thermal conductivity of the composite films.
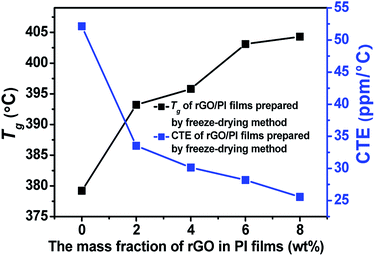
The Tg and CTE of these rGO/PI films were also investigated as shown in Table 1 and Fig. 7. After adding 2% of rGO, the Tg of the PI composite films showed obvious increase. The Tg value of rGO/PI films prepared by conventional method increase by 11.1 °C, while the films fabricated by the freeze-drying technique increase by 14 °C, and further increases with the filler volume. Because the rGO surfaces have some functional groups, and these groups could have covalent bonds and/or hydrogen bonds between PI chains, which would inhibit the segments' movement of PI, and thus increase the Tg of the final composite PI films. Meanwhile, the coefficient of thermal expansion (CTE) of the composite films decreases with the addition of rGO. For the films containing 8 wt% of rGO, the CTE of the film fabricated by freeze-drying method is 25.6 ppm °C−1, which is decreased by 60% as compared to the neat PI film. The decrease trend of CTE is due to the good dispersion of rGO in PI matrix and the strong interaction between rGO and matrix. In addition, the rGO has strong rigidity and inhibits the heat movement of PI chains.
| Sample | Content (%) | Tg (°C) | CTE (ppm °C−1) |
|---|---|---|---|
| rGO/PI films prepared by conventional method | 0 | 377.4 | 49.0 |
| 2 | 388.5 | 29.2 | |
| 4 | 392.7 | 28.8 | |
| 6 | 401.0 | 27.4 | |
| 8 | 401.8 | 22.7 | |
| rGO/PI films prepared by freeze-drying method | 0 | 379.2 | 52.1 |
| 2 | 393.2 | 33.5 | |
| 4 | 395.8 | 30.1 | |
| 6 | 403.1 | 28.2 | |
| 8 | 404.3 | 25.6 |
Conclusions
For the first time, we have found that crystallization occurred for the PAA solution (in DMAc) at low temperature. The crystallization characteristic of PAA is closely related to its solid content in DMAc. Taking the advantage of the crystallization phenomenon, the rGO/PAA films with 3D filler network through the heterogenous rejection of PAA crystallization can be obtained. For the film containing 8 wt% of rGO, the thermal conductivity of the rGO/PI film can reach 2.78 W m−1 K−1, which is more than 15 times of the corresponding neat PI film. Meanwhile the thin films prepared by the freeze-drying method can maintain the comprehensive properties of PI film such as flexibility, excellent thermal stability (Tg is 404.3 °C) and dimensional stability (CTE is 25.6 ppm °C−1). The method is considered to be relatively simple and suitable for scale production.Conflicts of interest
There are no conflicts to declare.Acknowledgements
The financial supports by the National 973 Program of China (No. 2014CB643605), the National Natural Science Foundation of China (No. 51373204, 51173214, and 51233008), the National 863 Program of China (No. 2015AA033408), the Science and Technology Project of Guangdong Province (No. 2015B090915003 and 2015B090913003), the Leading Scientific, Technical and Innovation Talents of Guangdong Special Support Program (No. 2016TX03C295), the China Postdoctoral Science Foundation (No. 2017M612801) and the Fundamental Research Funds for the Central Universities (No. 161gzd08) are gratefully acknowledged.Notes and references
- J. J. Ge, C. Y. Li, G. Xue, I. K. Mann, D. Zhang, S. Y. Wang, F. W. Harris, S. Z. D. Cheng, S. C. Hong, X. W. Zhuang and Y. R. Shen, J. Am. Chem. Soc., 2001, 123, 5768–5776 CrossRef PubMed.
- H. Lim, W. J. Cho, C. S. Ha, S. Ando, Y. K. Kim, C. H. Park and K. Lee, Adv. Mater., 2002, 14, 1275–1279 CrossRef.
- L. Derue, O. Dautel, A. Tournebize, M. Drees, H. Pan, S. Berthumeyrie, B. Pavageau, E. Cloutet, S. Chambon, L. Hirsch, A. Rivaton, P. Hudhomme, A. Facchetti and G. Wantz, Adv. Mater., 2014, 26, 5831–5838 CrossRef PubMed.
- A. L. Moore and L. Shi, Mater. Today, 2014, 17, 163–174 CrossRef.
- R. Prasher, Phys. Rev. B, 2008, 77, 075424 CrossRef.
- W. Yan, Y. Zhang, H. W. Sun, S. W. Liu, Z. G. Chi, X. C. Chen and J. R. Xu, J. Mater. Chem. A, 2014, 2, 20958–20965 RSC.
- L. B. Xu, G. F. Chen, W. Wang, L. Li and X. Z. Fang, Composites, Part A, 2016, 84, 472–481 CrossRef.
- J. Zeng, R. Fu, Y. Shen, H. He and X. F. Song, J. Appl. Polym. Sci., 2009, 113, 2117–2125 CrossRef.
- Y. S. Xu, D. D. L. Chung and C. Mroz, Composites, Part A, 2001, 32, 1749–1757 CrossRef.
- Z. Yang, L. H. Zhou, W. Luo, J. Y. Wan, J. Q. Dai, X. G. Han, K. Fu, D. Henderson, B. Yang and L. B. Hu, Nanoscale, 2016, 8, 19326–19333 RSC.
- J. Yang, L. S. Tang, R. Y. Bao, L. Bai, Z. Y. Liu, W. Yang, B. H. Xie and M. B. Yang, J. Mater. Chem. A, 2016, 4, 18841–18851 RSC.
- K. Kim and J. Kim, Composites, Part B, 2016, 93, 67–74 CrossRef.
- K. Kim, M. Yoo, K. Ahn and J. Kim, Ceram. Int., 2015, 41, 179–187 CrossRef.
- L. Y. Yin, X. G. Zhou, J. S. Yu, H. L. Wang and C. C. Ran, Composites, Part A, 2016, 90, 626–632 CrossRef.
- N. Ramdani, M. Derradji, T. T. Feng, Z. Tong, J. Wang, E. O. Mokhnache and W. B. Liu, Mater. Lett., 2015, 155, 34–37 CrossRef.
- J. W. Xia, G. P. Zhang, L. B. Deng, H. P. Yang, R. Sun and C. P. Wong, RSC Adv., 2015, 5, 19315–19320 RSC.
- R. J. Xu, M. Y. Chen, F. Zhang, X. R. Huang, X. G. Luo, C. H. Lei, S. G. Lu and X. Q. Zhang, Compos. Sci. Technol., 2016, 133, 111–118 CrossRef.
- R. H. Sun, H. Yao, H. B. Zhang, Y. Li, Y. W. Mai and Z. Z. Yu, Compos. Sci. Technol., 2016, 137, 16–23 CrossRef.
- K. Ghosh, N. Ranjan, K. Verma and C. S. Tan, RSC Adv., 2016, 6, 53054–53061 RSC.
- Y. Cao, M. J. Liang, Z. D. Liu, Y. M. Wu, X. L. Xiong, C. Y. Li, X. M. Wang, N. Jiang, J. H. Yu and C. T. Lin, RSC Adv., 2016, 6, 68357–68362 RSC.
- B. Zhou, W. Luo, J. Q. Yang, X. B. Duan, Y. W. Wen, H. M. Zhou, R. Chen and B. Shan, Composites, Part A, 2016, 90, 410–416 CrossRef.
- S. Q. Yuan, J. M. Bai, C. K. Chua, J. Wei and K. Zhou, Composites, Part A, 2016, 90, 699–710 CrossRef.
- R. Prasher, Appl. Phys. Lett., 2007, 90, 143110 CrossRef.
- M. Shtein, R. Nadiv, M. Buzaglo, K. Kahil and O. Regev, Chem. Mater., 2015, 27, 2100–2106 CrossRef.
- W. Y. Zhou, C. F. Wang, T. Ai, K. Wu, F. J. Zhao and H. Z. Gu, Composites, Part A, 2009, 40, 830–836 CrossRef.
- K. M. F. Shahil and A. A. Balandin, Nano Lett., 2012, 12, 861–867 CrossRef PubMed.
- H. Q. Yao, S. A. Hawkins and H. J. Sue, Compos. Sci. Technol., 2017, 146, 161–168 CrossRef.
- A. Li, C. Zhang and Y. F. Zhang, Composites, Part A, 2017, 101, 108–114 CrossRef.
- E. Pop, V. Varshney and A. K. Roy, MRS Bull., 2012, 37, 1273 CrossRef.
- Q. Li, Y. F. Guo, W. W. Li, S. Q. Qiu, C. Zhu, X. F. Wei, M. L. Chen, C. J. Liu, S. T. Liao, Y. P. Gong, A. K. Mishra and L. W. Liu, Chem. Mater., 2014, 26, 4459–4465 CrossRef.
- G. Lian, C. C. Tuan, L. Y. Li, S. L. Jiao, Q. L. Wang, K. S. Moon, D. L. Cui and C. P. Wong, Chem. Mater., 2016, 28, 6096–6104 CrossRef.
- M. H. Tsai, I. H. Tseng, J. C. Chiang and J. J. Li, ACS Appl. Mater. Interfaces, 2014, 6, 8639–8645 CrossRef PubMed.
- W. Dai, J. Yu, Y. Wang, Y. Song, F. E. Alam, K. Nishimura, C. Lin and N. Jiang, J. Mater. Chem. A, 2015, 3, 4884–4891 RSC.
- W. S. Hummers Jr and R. E. Offeman, J. Am. Chem. Soc., 1958, 80, 1339 CrossRef.
- J. Y. Wang, S. Y. Yang, Y. L. Huang, H. W. Tien, W. K. Chin and C. C. M. Ma, J. Mater. Chem., 2011, 21, 13569–13575 RSC.
- K. Erickson, R. Erni, Z. Lee, N. Alem, W. Gannett and A. Zettl, Adv. Mater., 2010, 22, 4467–4472 CrossRef PubMed.
- D. Li, M. B. Muller, S. Gilje, R. B. Kaner and G. G. Wallace, Nat. Nanotechnol., 2008, 3, 101–105 CrossRef PubMed.
- M. J. McAllister, J. L. Li, D. H. Adamson, H. C. Schniepp, A. A. Abdala, J. Liu, M. H. Alonso, D. L. Milius, R. Car, R. K. Prud’homme and I. A. Aksay, Chem. Mater., 2007, 19, 4396–4404 CrossRef.
- S. Gilje, S. Han, M. S. Wang, K. L. Wang and R. B. Kaner, Nano Lett., 2007, 7, 3394–3398 CrossRef PubMed.
- V. C. Tung, M. J. Allen, Y. Yang and R. B. Kaner, Nat. Nanotechnol., 2009, 4, 25–29 CrossRef PubMed.
- L. Schmidt-Mende, A. Fechtenkötter, K. Mülen, E. Moons, R. H. Friend and J. D. MacKenzie, Science, 2001, 293, 1119–1122 CrossRef PubMed.
- B. Yao, J. Chen, L. Huang, Q. Q. Zhou and G. Q. Shi, Adv. Mater., 2016, 28, 1623–1629 CrossRef PubMed.
Footnote |
| † Electronic supplementary information (ESI) available. See DOI: 10.1039/c8ra00827b |
| This journal is © The Royal Society of Chemistry 2018 |

