DOI:
10.1039/C8RA00842F
(Paper)
RSC Adv., 2018,
8, 10246-10254
Design, synthesis and characterization of a novel bluish-green long-lasting phosphorescence phosphor BaLu2Si3O10:Eu2+, Nd3+
Received
27th January 2018
, Accepted 23rd February 2018
First published on 13th March 2018
Abstract
Through drawing upon a solid-state reaction, a newly proposed long-lasting phosphor BaLu2Si3O10:Eu2+, Nd3+ is presented and prepared in this work. The thermoluminescence properties of the phosphor are substantially extended, and the long-lasting phosphorescence behavior is markedly intensified by virtue of the consolidation of Nd3+ ions which serve as trap centers. In line with density functional theory calculations, the conduction band is mostly composed of Lu 5d states while the Ba 5d states only have a tiny contribution. We analyzed the relationship between the phosphor’s electronic structure and its optical properties. The photoluminescence emission spectrum shows a blue emitting band with a wide asymmetric property and an extremum of 426 nm, arising from the 5d–4f transitions of the Eu2+ ions which occupy the Ba and Lu sites. It is asserted that the long-lasting phosphorescence of the Eu2+ ions which take up both Ba and Lu sites stems from the special form of conduction band and the occupying environment of the emission center. Yet, they have different contributions and induce an interesting phenomenon in which the blue emitting phosphor shows a bluish-green phosphorescence. The long-lasting phosphorescence can last in excess of 6 h at the recognized intensity level (0.32 mcd m−2) after excitation for 10 min. This work provides a new way of thinking for the development of multicolored LLP materials. This work analyzes and sheds light on the specific courses and provides a likely mechanism for the process.
1. Introduction
Long-lasting phosphorescence (LLP) is an optical phenomenon of great significance. Luminescence can be observed after ceasing the excitation after a couple of minutes and probably persists over a longer period of time of several hours.1,2 Under excitation, energy can be stored and absorbed by LLP materials (inclusive of artificial light and sunlight). Subsequently, the stored and absorbed energy can be released as persistent visible light under thermal stimulation, commonly at room temperature.3,4 LLP materials have aroused considerable attention and have been applied in extensive important fields by virtue of its prominent characteristics which include being recyclable, energy saving, and eco-friendly.5 Initially, LLP materials were adopted for night-time displays, traffic signs, in or on buildings, in public places, for emergency signs, and security signs.6 Additionally, the foregoing materials have been adopted in structural damage sensors, radiation detectors, and optical storage media.7 Thus far, LLP materials have been adopted in a growing number of fields to address relevant challenges, such as in in vivo bio-imaging, medical diagnostics and solar energy utilization, etc.8
Moreover, large numbers of LLP materials have been developed and reported. LLP materials colored red, green and blue are primarily highlighted and discussed with a predominant amount of the research reported adopting these materials for a particular purpose. Theoretically, any color material can be attained through blending these three predominant colors and changing their proportions.9–12 Yet, implementing the mentioned approach is difficult. Although two of the tricolor LLP materials, blue (CaAl2O4:Eu2+, Nd3+, >24 h) and green (SrAl2O4:Eu2+, Dy3+, >24 h), are very bright and can be adopted for use in the market, red LLP materials are overall inadequate when adopted for a particular purpose.13,14 Making the various components consistent with each other during the phosphorescent decay can be hard and ensuring that the color of the phosphorescence is uniform can be difficult. Furthermore, a single source of excitation can be inefficient in exciting the majority of LLP materials.15,16
In this regard, newly proposed LLP materials consisting of multiple colors will be critically and urgently explored and developed. Currently, there is a growing interest in silicate-based luminescent materials due to their excellent chemical stability, thermal stability, weather resistance, and low temperature synthesis.17,18 In 2010, M. Wierzbicka-Wieczorek et al. initially developed and reported the trisilicates BaRe2Si3O10 (Re = Sc, Yb, Er, and Gd).19 The topological structure of the BaRe2Si3O10 trisilicates consists of trisilicate Si3O10 groups in the shape of a horseshoe and ReO6 octahedra distorted by zigzag chains of edge-sharing. Subsequently, the foregoing trisilicate compounds, e.g. BaSc2Si3O10 and BaY2Si3O10 are adopted to synthesize numerous versatile lanthanon doped phosphors. Additionally, the application of these phosphors in white LEDs has been investigated, as well as their photoluminescent properties.20–24 In 2014, the bivalent Eu2+ doped BaM2Si3O10:Eu2+ (M = Sc, Lu) phosphor was prepared and proposed by Jakoah Brgoch et al.25 In 2016, Kai Li et al. reported the preparation and photoluminescent properties of the tervalent Ce3+ and Tb3+ co-doped BaLu2Si3O10 phosphor.26 The BaLu2Si3O10 phosphor has prominent luminescence properties, which has aroused massive research interest. Until now, as indicated by a literature review, no papers have studied the LLP properties of this phosphor. Traps are significant for photo-energy storage of persistent and thermo-stimulated phosphors. Suitable trap depths and trap densities are beneficial for improving LLP properties. Co-doping Re3+ ions counts as one of the most frequently adopted approaches to generate new traps or update the internal properties of traps arising from nonequivalent substitution. As Dorenbos’ theory indicates that Nd3+ ions count as adequate traps, Nd3+ ions are deemed trap centers and can be incorporated into BaLu2Si3O10:Eu2+ hosts.27 Based on the above reasons, we have synthesized a LLP BaLu2Si3O10:Eu2+, Nd3+phosphor. In this work, the electronic structure, photoluminescence, and phosphorescence properties of this phosphor are investigated systematically and shed light on.
2. Experimental
2.1 Synthesis
Following a frequently adopted method using high-temperatures in the solid state, this work fabricated the desired samples Ba1−2xLu2Si3O10:xEu2+, xNd3+ (x = 0, 0.004, 0.006, 0.008, 0.01 0.02 and 0.03, respectively presented as S1 to S6) whereby the raw materials were Eu2O3 (99.99%), Nd2O3 (99.99%), SiO2 (99.99%), and BaCO3 (99.99%). The relative raw materials were mixed in stoichiometric amounts and intensively ground uniformly in an agate mortar for 40 min, while incorporating an adequate amount of ethanol. The mixture was placed in alumina crucibles and sintered for 5 h at 1400 °C (N2![[thin space (1/6-em)]](https://www.rsc.org/images/entities/char_2009.gif) :
:![[thin space (1/6-em)]](https://www.rsc.org/images/entities/char_2009.gif) H2 = 95
H2 = 95![[thin space (1/6-em)]](https://www.rsc.org/images/entities/char_2009.gif) :
:![[thin space (1/6-em)]](https://www.rsc.org/images/entities/char_2009.gif) 5) in a reducing atmosphere in a tube furnace powered by electricity. After calcining, the temperature of the samples was reduced within the furnace to room temperature and ground a second time for further application.
5) in a reducing atmosphere in a tube furnace powered by electricity. After calcining, the temperature of the samples was reduced within the furnace to room temperature and ground a second time for further application.
2.2 Characterization
These samples were characterized by powder X-ray diffraction (XRD) using a Rigaku diffractometer featuring Ni-filtered Cu Kα radiation at scanning steps of 0.02° with the 2θ value ranging from 10° to 80°. This enabled the overall phase structures of the samples to be examined. Through employing a F30 S-TWIN electron microscope (Tecnai™G2, FEI Company) high-resolution transmission electron microscopy (HRTEM) images, transmission electron microscopy (TEM) images, and an energy dispersive X-ray spectroscopy (EDX) spectrum were attained. Using a UV-Vis spectrophotometer (PE Lambda 950) and a sample of BaSO4an ultraviolet-visible (UV-vis) diffuse reflectance spectra (DRS) was attained and used as a reference. A Xe-900 xenon arc lamp (450 W), with a FLS-920T fluorescence spectrophotometer as the source of excitation, was used to measure the luminescence decay curves, the LLP spectra, the photoluminescence excitation (PLE), and the photoluminescence emission (PL). 1 nm was established as the scanning step. 10 min after irradiating the samples with ultraviolet light a PR305 long afterglow instrument was used to measure the decay curve of the LLP. TL curves were provided using a FJ-427A TL meter (Beijing Nuclear Instrument Factory) with a heating rate of 1 K s−1 and a temperature range of 20 to 400 °C. In this work, UV light was used to irradiate 0.0020 g samples which had been pressed into pellets for 5 min prior to measuring. The photographs of BaLu2Si3O10:Eu2+ and BaLu2Si3O10:Eu2+, Nd3+ under/after UV irradiation were taken in a dark room by a common digital camera with certain parameter settings (exposure time, ISO value, and aperture value). With the exception of the TL curves, these measurements were conducted at room temperature. Through using the CASTEP code and abiding by density functional theory, this work calculated the electronic structure adopted by BaLu2Si3O10. Among the theories of density function, this work selected the local-density approximations (LDA).
3. Results and discussion
3.1 XRD patterns and Rietveld refinement
XRD was used to ascertain the phase purity adopted by the prepared samples. Given that the structure of BaLu2Si3O10 has never previously been proposed in literature, this work references the crystallographic data and initial model structure with the purpose of refining them for BaYb2Si3O10 (ICSD 17781). The representative XRD patterns for the relative samples are presented in Fig. 1a (S1–S6). All of the diffraction peaks are used as a standard reference for the BaYb2Si3O10 (ICSD 17781) compound.26 No impure phases were detected in the attained samples, which indicates that a single phase is taken up by all of the attained samples, and the Eu2+ and Nd3+ ions are successfully incorporated into the BaLu2Si3O10 host. The XRD pattern of the BaLu2Si3O10 host is presented in Fig. 1b on the basis of the Rietveld structural refinement which was attained using the Materials Studio program. The background, the experimental pattern and the calculated pattern are denoted by a yellow solid line, black crosses, and a red solid line, respectively. The Bragg reflection positions taken up by the acquired pattern are indicated by short vertical pink lines. At the bottom, the blue line shows how the calculated and experimental results are different from each other. Rietveld refinement effectively examines how atoms are positioned in a primitive cell. The residual factors are Rwp = 13.78%, Rp = 9.75% and χ2 = 3.127, which demonstrate that the refined results are reliable. The refinement results confirm that the compound is in the monoclinic space group P21/m (no. 11) with cell parameters a = 5.3541(1) Å, b = 12.1224(3) Å, and c = 6.7829(2) Å. The final refinement results indicate that this phosphor has two diverse cations, namely 8-coordinated Ba2+ (r = 1.42 Å) and 6-coordinated Lu3+ (r = 0.861 Å), presented in Fig. 1b. Distorted SiO4 tetrahedra which form corner-sharing zig-zag trimers are contained in the crystal structure. Two Si4+ cations are given which are crystallographically independent. Through adopting two highly distorted edge-sharing LuO6 octahedra, this work connects the foregoing SiO4 trimers.27 Generally, the radii difference between the two cations primarily determines whether the doped ions can substitute for the host cation.25 The percentage difference in ionic radii between the substituted and the doped ions should be less than 30%.28 The equation below can calculate the difference between the possible substituted ions (Ba2+, Lu3+) and the doped rare ions (Eu2+, Nd3+) in radius percentage.29| | |
Dr = 100 × [Rm(CN) − Rd(CN)]/Rm(CN)
| (1) |
where Dr is the radius percentage difference; CN is the coordination number; Rm(CN) is the radius of the host cation; and Rd(CN) is the radius of the doped ion. The radii and calculated values of Dr between Eu2+/Nd3+ and Ba2+/Lu3+ are shown in Table 1. In light of calculated results from empirical equations, it can be deduced that Nd3+ ions could enter into both Ba and Lu sites while Eu2+ ions only seem to enter into the Ba sites.
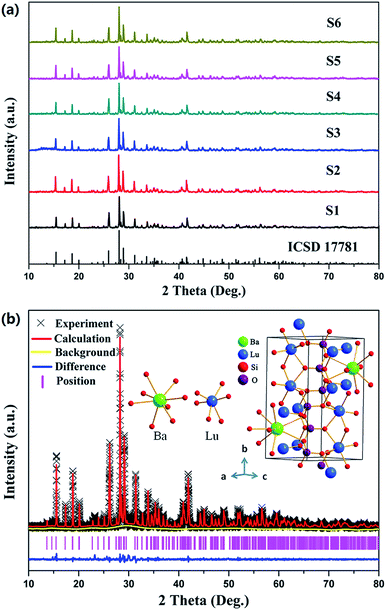 |
| | Fig. 1 (a) XRD patterns for Ba1−2xLu2Si3O10:xEu2+, xNd3+ (x = 0, 0.004, 0.006, 0.008, 0.01 0.02 and 0.03). (b) XRD refinement and the crystal structure of the BaLu2Si3O10 host. | |
Table 1 The radius and Dr values between Eu2+/Nd3+ and Ba2+/Lu3+
| |
CN = 8 |
CN = 6 |
| Ba2+, R = 1.420 Å |
Lu3+, R = 0.861 Å |
| Eu2+ |
R = 1.250 Å, Dr = 12% |
R = 1.170 Å, Dr = 35% |
| Nd3+ |
R = 1.109 Å, Dr = 22% |
R = 0.983 Å, Dr = 14% |
3.2 Scanning electron microscopy and transmission electron microscopy analyses
The morphology of the two selected BaLu2Si3O10 host and BaLu2Si3O10:Eu2+, Nd3+ samples was detected using SEM technology. As shown in Fig. 2a and c, the morphologies of these two samples are similar to each other. As shown, the blocky particles are irregularly shaped and approximately 2–10 μm in size, making their form and structure suitable for the fabrication of phosphors. The elemental composition of the BaLu2Si3O10 host was investigated by EDX spectroscopy and the spectrum is shown in Fig. 2b. It confirms the presence of Ba, Lu, Si, and O in the BaLu2Si3O10 sample. The elements of C and Cu come from the carbon membrane. The distance between the crystal planes reaches 0.325 nm, which is consistent with the (002) planes of BaLu2Si3O10 in Fig. 2b (inset).30 In addition, the elemental composition of BaLu2Si3O10:Eu2+, Nd3+ was also investigated by EDX spectroscopy with the spectrum shown in Fig. 2d. As shown in Fig. 2d (inset), the elements of Eu and Nd are also detected.
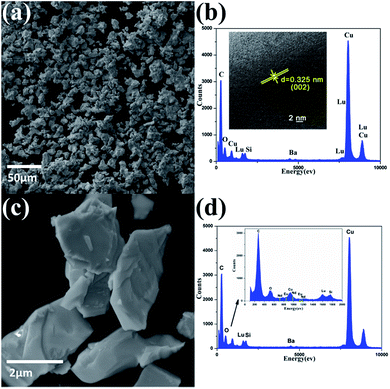 |
| | Fig. 2 (a) SEM images of the BaLu2Si3O10 host. (b) EDX spectrum of the BaLu2Si3O10 host. (Inset) HRTEM images of the BaLu2Si3O10 host. (c) SEM images of BaLu2Si3O10:Eu2+, Nd3+. (d) EDX spectrum of BaLu2Si3O10:Eu2+, Nd3+. (Inset) Regional area with high resolution. | |
3.3 Band structure
Fig. 3a–d show the computations of BaLu2Si3O10 abiding by the density functional theory and on the basis of the crystal structure refinement. This paper selects the LDA as the theoretical basis of the density function. The relevant compound takes on an indirect bandgap which reaches approximately 4.843 eV, with the conduction band (CB) peaking at the G point and the valence band (VB) peaking at the D point of the Brillouin zone, which suggests that this is an appropriately wide bandgap for Eu2+ to serve as a center to emit light and for Nd3+ to serve as a trap center. The electronic structure taken on by the valence band primarily stems from O 2p states, whereas the conduction band is mostly encompassed by Lu 5d states. It is worth mentioning that Ba 5d states also have a tiny contribution to the conduction band. This special band structure characteristic has great effects on the phenomena of photoluminescence and phosphorescence.
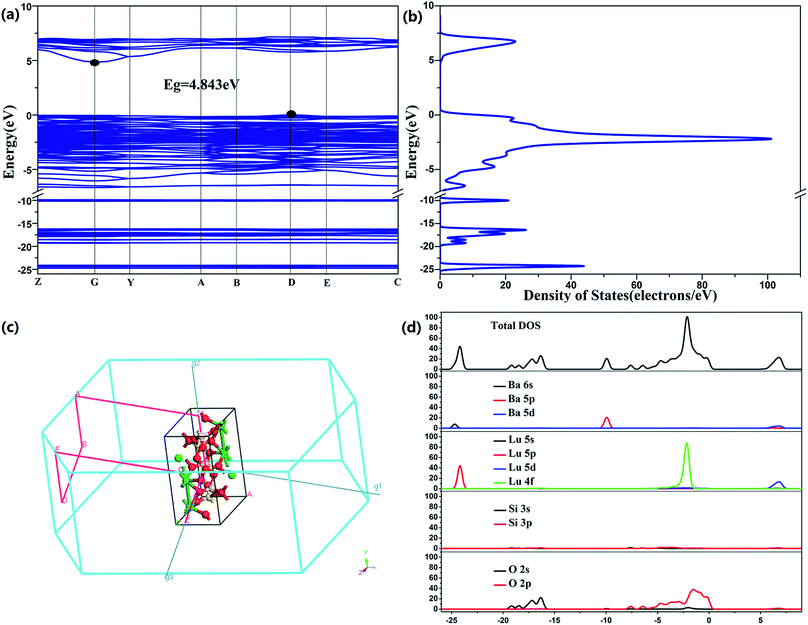 |
| | Fig. 3 (a) Band structure of BaLu2Si3O10. (b) Density of states. (c) Brillouin zone. (d) Total and partial density of states. | |
3.4 UV-visible diffuse reflectance spectrum
Fig. 4 shows the DRS of the undoped BaLu2Si3O10 host and concentration gradient samples of BaLu2Si3O10:Eu2+. For the host, the absorption in the ultraviolet region ranging from 200 to 400 nm arises from the valence-to-conduction band. For the samples of BaLu2Si3O10:Eu2+, the feature absorbance peaks of 290 nm and 325 nm are consistent with the excitation peaks as shown in Fig. 5a, which are attributed to the Eu2+ ions. The observed white color of the sample is a consequence of the spectral range being in the visible region. Kubelka–Munk-transformed DRS of the BaLu2Si3O10 host, in line with the formula of [F(R) × hν]n = A(hν − Eg), is presented in the inset of Fig. 4 where F(R) is the Kubelka–Munk function with F(R) = (1 − R)2/2R; R is the observed reflectance in the DRS; n = 1/2 for an indirect allowed transition, or 2 for a direct allowed transition, in this case n equals 1/2 according to the above calculated results of the band structure for BaLu2Si3O10; A is the proportional constant; ν is the photon energy; and Eg is the value of the host bandgap.29 By adopting the methods proposed by Cao et al.31 the optical bandgap energy of BaLu2Si3O10 is determined to be 5.5420 eV by extrapolation to F(R) = 0. It is expected that the value of the optical bandgap surpasses that of the previously calculated bandgap of approximately 4.843 eV as the local-density approximation depends less on the bandgap size and spin–orbit coupling of Lu3+ which has not been considered.32
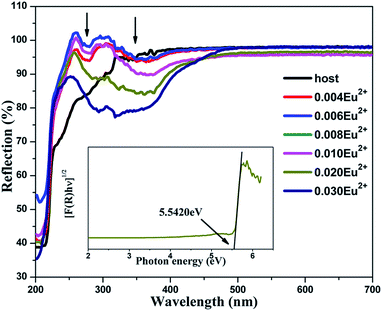 |
| | Fig. 4 DRS of the undoped BaLu2Si3O10 host and concentration gradient samples of BaLu2Si3O10:Eu2+. (Inset) A curve of [F(R) × hν]1/2 vs. hν for BaLu2Si3O10. | |
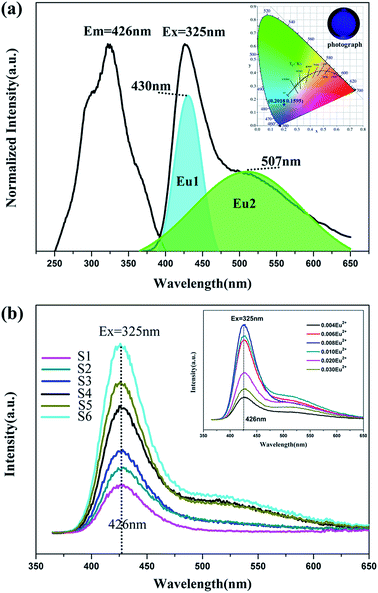 |
| | Fig. 5 (a) Excitation and emission spectra of BaLu2Si3O10:0.008Eu2+. (Inset) CIE chromaticity diagram and photographs of the BaLu2Si3O10:0.008Eu2+, 0.008Nd3+ phosphor excited at 325 nm. (b) Emission spectra of concentration gradient samples of BaLu2Si3O10:Eu2+, Nd3+. (Inset) Emission spectra of concentration gradient samples of BaLu2Si3O10:Eu2+. | |
3.5 Photoluminescence and phosphorescence properties
The emission and excitation spectra for the BaLu2Si3O10:Eu2+ phosphor at room temperature is presented in Fig. 5a. The excitation spectrum that was monitored at 426 nm shows a broad excitation band ranging from 250 nm to 400 nm which arises from the 4f7–4f65d1 transition of Eu2+ ions. Two primary peaks at 290 nm and 325 nm which are contained in the broad band show that Eu2+ ions are present and that their role is as an emission center. In the case of a 325 nm optimal excitation, the material merely shows one wide asymmetric band with a long shoulder peaking at 426 nm. Such an emission peak arises from the Eu2+ ions undergoing equally allowed electronic 4f65d1-4f7 transitions, which is considerably affected by the lattice of the host.30 In light of calculated results from the empirical equation, it can be deduced that Eu2+ ions only seem to access the Ba sites. However, on the basis of the analysis performed on the emission and excitation spectra, the incorporated Eu2+ ions could take up both Lu and Ba sites in the BaLu2Si3O10 host. Accordingly, the emission centers fall into two types. In this regard, this work adopts Gaussian deconvolution which takes into account the emission spectrum of the BaLu2Si3O10:Eu2+ phosphor being widely asymmetric, and the spectrum is compatible with two peaks at 507 nm and 430 nm. As the higher emission intensity shown by Eu1 in contrast to Eu2 elucidates, the Eu2+ ions preferably take up Ba sites instead of Lu sites. Fig. 5a presents (0.2018, 0.1595) as the CIE chromaticity coordinate for BaLu2Si3O10:Eu2+ and blue as the color, which is acquired from the spectrum for emitting light whereby the calculation of the chromaticity coordinate follows the CIE1931 (Commission International de I’Eclairage France) system. As shown in Fig. 5b as the concentration of Nd3+ ions increases the emission spectra of BaLu2Si3O10:Eu2+, Nd3+ merely show one band being asymmetrically wide, which is similar to that of the single doped sample. As shown in Fig. 5b (inset), all doped samples have a broad asymmetric emission peak at 426 nm with a long shoulder. It also means Eu2+ ions fill both Ba and Lu sites. As the doping concentration increases the brightness increases and then decreases and shows BaLu2Si3O10:0.008Eu2+ to be the best doped sample. Additionally, this work fails to observe the representative emissions of the Nd3+ ions. As the foregoing results indicate, trivalent lanthanide ions Nd3+ are not deemed emission centers in BaLu2Si3O10:Eu2+, Nd3+ but are centers for trapping in numerous LLP phosphors.30
Fig. 6a shows the phosphorescence spectra of BaLu2Si3O10:0.008Eu2+, 0.008Nd3+ at different times after removing the excitation source. Interestingly, the profiles do not change with the phosphorescence decay time, but are greatly different from the emission profiles. This interesting phenomenon indicates that the LLP originates from both emissions (EuLu and EuBa) but they have very different contributions during the LLP process. In Fig. 6b, the phosphorescence spectrum of BaLu2Si3O10:0.008Eu2+, 0.008Nd3+ which was measured 30 min after the source of excitation was switched off is processed by Gaussian deconvolution and is consistent with two peaks at 430 nm and 507 nm, which is similar to the PL spectrum. The phosphorescence CIE chromaticity coordinate is (0.2062, 0.2614) and the color is bluish-green, as shown in the inset of Fig. 6b. The PL color is blue but the phosphorescence color is bluish-green, indicating that the phosphorescence is derived from the 5d–4f transition of Eu2+ ions in the Ba and Lu sites. EuLu has a greater contribution during the LLP process, so the color of phosphorescence tends to be green, rather than blue.
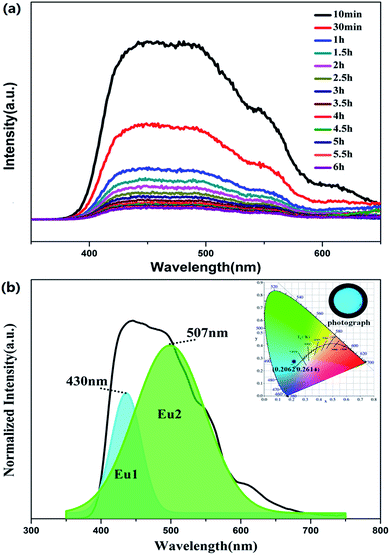 |
| | Fig. 6 (a) Phosphorescence spectrum of BaLu2Si3O10:0.008Eu2+, 0.008Nd3+. (b) Phosphorescence spectra of BaLu2Si3O10:0.008Eu2+, 0.008Nd3+ 30 min after the removal of the excitation source. (Inset) CIE chromaticity diagram and photograph of the phosphorescence spectrum for the BaLu2Si3O10:0.008Eu2+, 0.008Nd3+ phosphor, excited at 325 nm. | |
3.6 Luminescence decay curves
To demonstrate that the phosphorescence stems from the EuLu emission in the current BaLu2Si3O10 host, luminescence decay curves were measured at an excitation of 325 nm and monitored at 426 and 507 nm. The results are shown in Fig. 7. The luminescence decay curves were able to be adjusted by a double-exponential mode and the average luminescence decay time τ could be ascertained from the formula below.33| | |
τ = (A1τ12 + A2τ22)/(A1τ1 + A2τ2)
| (2) |
where A1 and A2 are constant and τ1 and τ2 are the two exponential components of the fitting luminescence decay curve. Table 2 lists the fitting parameters specifically. In line with the equation above and the fitting parameters, the average luminescence decay times monitored at 426 and 507 nm were calculated to be 671 and 2114 ns for the BaLu2Si3O10:Eu2+ phosphor, and 638 and 1239 ns for the BaLu2Si3O10:Eu2+, Nd3+ phosphor, respectively. We found that both the luminescence decay times monitored at 426 and 507 nm are characteristic of the 5d–4f allowed transition of Eu2+, indicating that the green phosphorescence at 507 nm indeed originates from the Eu2+ emission, rather than from some defect levels.34 The Eu2+ luminescence decay time decreases with the introduction of Nd3+ ions. The reason is that with the introduction of Nd3+ ions there is an inequivalence of substitution which leads to lattice distortion and causes lots of defects. Those defects could play a role as energy traps, where the energy from Eu2+ ions can transfer. This new approach for energy transfer causes a decrease in the luminescence decay time. Furthermore, the dual-exponential curve fitting arising from the spectral overlap of the two emission bands and can support the statement that Eu2+ occupies both the Ba and Lu sites in BaLu2Si3O10.30
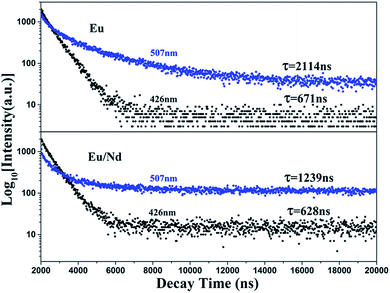 |
| | Fig. 7 Luminescence decay curves of BaLu2Si3O10:Eu2+ and BaLu2Si3O10:Eu2+, Nd3+ excited at 325 nm and monitored at 426 nm and 507 nm. | |
Table 2 The fitting parameters of the luminescence decay curves of BaLu2Si3O10:Eu2+ and BaLu2Si3O10:Eu2+, Nd3+ excited at 325 nm and monitored at 426 nm and 507 nm.
| Sample |
λem (nm) |
τ1 (ns) |
τ2 (ns) |
A1 |
A2 |
| Eu2+ |
426 |
722.81 |
235.58 |
1438.98 |
524.39 |
| 507 |
2618.30 |
470.54 |
545.66 |
930.57 |
| Eu2+, Nd3+ |
426 |
671.06 |
160.98 |
1584.67 |
448.23 |
| 507 |
1606.05 |
288.46 |
313.56 |
673.59 |
3.7 LLP decay curves
As presented in Fig. 8a, this work measured the LLP decay curves for all of the as-synthesized samples (S1–S6) in order to delve into the decay performance of the BaLu2Si3O10:Eu2+, Nd3+ emission. The decay process of the LLP is encompassed by a slow decay process and a fast decay process. Those fast decay processes occur initially and dominate the intensity at the very beginning, and the slow decay processes occur later which lead to the long term behavior.35–38 This work, through adopting curve-fitting technology, analyzes the decay curves of the samples (S1–S6), and these curves are found to adequately match the following double-exponential equation.| |
I = A1![[thin space (1/6-em)]](https://www.rsc.org/images/entities/char_2009.gif) exp(−t/τ1) + A2 exp(−t/τ1) + A2![[thin space (1/6-em)]](https://www.rsc.org/images/entities/char_2009.gif) exp(−t/τ2) + A0 exp(−t/τ2) + A0
| (3) |
where I is the phosphorescence intensity, A0, A1 and A2 are constants, t is time, and τ1 and τ2 are the decay times of the exponential components. Since the performance of LLP is chiefly determined by τ2,39 the τ2 values for all of the samples are listed in Table 3. The value of τ2 increases in the beginning and then decreases later with the increase in Eu2+ and Nd3+ ion content. They reach a maximum when the amount of the Eu2+ and Nd3+ ions reaches 0.008 mol. LLP decay curves of BaLu2Si3O10:Eu2+ are shown in the inset of Fig. 8a. The values peak when there is 0.008 mol of Eu2+ ions. The initial LLP intensity of BaLu2Si3O10:0.008Eu2+, 0.008Nd3+ is in the vicinity of 0.013 cd m−2 and its LLP can continue in excess of 6 h over an intensity level which is able to be recognized (0.32 mcd m−2). The phosphorescence of BaLu2Si3O10:0.008Eu2+ is only visible for 199 s by the naked eye, which indicates that the introduction of Nd3+ ions greatly optimizes the phosphorescence of BaLu2Si3O10:0.008Eu2+. The LLP decay curve of BaLu2Si3O10:0.008Eu2+, 0.008Nd3+ is also plotted as a function of reciprocal persistent luminescence intensity (I−1) versus time (t), as presented in Fig. 8b. The detailed reasons are discussed later in the section on TL curves.
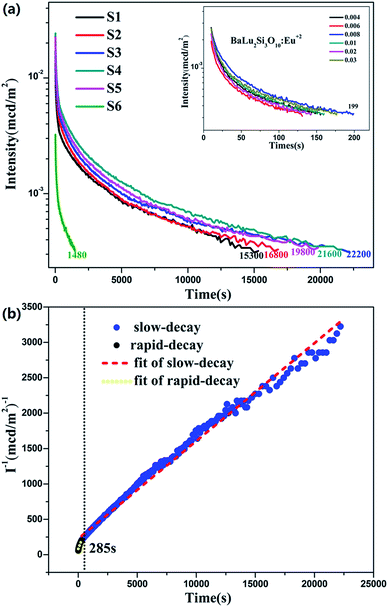 |
| | Fig. 8 (a) LLP decay curves of BaLu2Si3O10:Eu2+, Nd3+. Inset: LLP decay curves of BaLu2Si3O10:Eu2+ (b) function of reciprocal LLP intensity (I−1) versus time (t) of BaLu2Si3O10:0.008Eu2+, 0.008Nd3+ excited for 10 min. | |
Table 3 Decay times for two exponential components of Ba1−2xLu2Si3O10:xEu2+, xNd3+ (x = 0, 0.004, 0.006, 0.008, 0.01 0.02 and 0.03)
| Sample |
A0 |
A1 |
τ1 (s) |
A2 |
τ2 (s) |
| S1 |
7.2266 × 10⁻⁴ |
0.0110 |
55.5423 |
0.0054 |
1224.0458 |
| S2 |
6.7820 × 10⁻⁴ |
0.0086 |
62.6299 |
0.0046 |
1242.8820 |
| S3 |
8.3097 × 10⁻⁴ |
0.0170 |
60.0109 |
0.0065 |
1326.3692 |
| S4 |
6.6350 × 10⁻⁴ |
0.0093 |
50.3919 |
0.0037 |
1323.1464 |
| S5 |
8.0447 × 10⁻⁴ |
0.0150 |
55.4197 |
0.0061 |
1191.9548 |
| S6 |
3.9931 × 10⁻⁴ |
0.0022 |
26.1850 |
0.0012 |
236.5758 |
3.8 Thermoluminescence curves
Trapping centers play a momentous role in the photo-energy storage of persistent and thermo-stimulated phosphors.40 After removal of the excitation source, the captured charge carriers are able to escape due to thermal disturbance and are transferred to centers for luminescence, which triggers the phosphorescence. Accordingly, shallow depth traps are negatively and adversely affected by stabilizing the charge carriers, which considerably shortens the duration period of persistent luminescence. In contrast, the charge carriers that are captured by deep depth traps are extremely hard to release at room temperature, which leads to the defective performance of the LLP.40–42 For this reason, as the appropriate trap depth is formed, a solid foundation is laid for attaining a perfect LLP performance. Meanwhile, the trap density is also a significant factor for LLP. To characterize the traps in our samples TL measurements were conducted on BaLu2Si3O10:0.008 Eu2+ and BaLu2Si3O10:0.008 Eu2+, 0.008 Nd3+, their TL curves are shown in Fig. 9, we only observe three very weak peaks in BaLu2Si3O10:Eu2+ and it is possible that the TL bands arise from intrinsic defects in the host as the Eu2+ ions are equally replaced by Ba2+ ions in BaLu2Si3O10. Additionally, as the weak TL signal indicates, the concentration of carriers that is captured by the intrinsic defects is extremely low. When Nd3+ ions are co-doped, the intensity of the peaks are evidently enhanced, and the primary peak position moves to 330 K, meaning that the doping of the Nd3+ ions considerably elevates the defect levels. To further evaluate the trap states, the trap depths (Et) and the trap densities (n0) can be acquired from eqn (4) and (5).43| | |
Et = [2.52 + 10.2 × (μg − 0.42)] × (KBTm2/ω) − 2KBTm
| (4) |
| | |
n0 = ωIm/{β × [2.52 + 10.2 × (μg − 0.42)]}
| (5) |
Where Im is the intensity of the TL peak, δ is the high-temperature half-width, τ is the low-temperature half-width, the asymmetry parameter μg = δ/(τ + δ), β is the heating rate, KB is the Boltzmann constant (1.38 × 10⁻²³ J K−1), Tm is the temperature of the TL peak, and ω is known as the shape parameter and is defined as ω = τ + δ. As shown in Table 4, for the BaLu2Si3O10:0.008Eu2+ sample, although the trap depth is appropriate for releasing the trapped carriers, the low trap density directly results in a brief LLP of 199 s. For BaLu2Si3O10:0.008Eu2+, 0.008Nd3+, by co-doping with Nd3+ ions, more traps are generated with a suitable energy depth which greatly improves the duration of the LLP and the LLP brightness in the very beginning. This result suggests that co-doping indeed has a great effect upon the LLP performance of the phosphor.
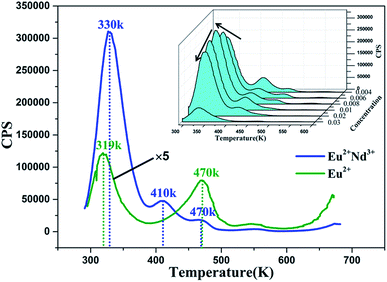 |
| | Fig. 9 TL curves of BaLu2Si3O10:0.008Eu2+, 0.008Nd3+ excited for 25 min. Inset: concentration gradient TL curves of BaLu2Si3O10:Eu2+, Nd3+ excited for 5 min. | |
Table 4 TL parameters of BaLu2Si3O10:0.008Eu2+ and BaLu2Si3O10:0.008Eu2+, 0.008Nd3+
| Sample |
Glow-peak parameters |
TL parameters |
| Tm (K) |
T |
δ |
ω |
μg |
Et (eV) |
n0 |
| Eu2+ |
319 |
19 |
23 |
42 |
0.55 |
0.75 |
2.65 × 10⁵ |
| Eu2+, Nd3+ |
330 |
21 |
27 |
48 |
0.56 |
0.71 |
3.75 × 10⁶ |
3.9 LLP mechanism
Under normal conditions, for the majority of LLP materials, the color of the phosphorescence is identical to the color of the PL arising from the identical emission centers. Yet the blue emitting phosphors show a phosphorescence which is characterized as bluish-green in this paper. In line with the previous analysis, Eu2+ ions which occupy Ba and Lu sites serve as emission centers and Nd3+ ions which take up Ba sites serve as trapping centers in the co-doped samples. As these experiments overall indicate, this material provides highly-efficient trapping conditions. A probable LLP mechanism for forming the efficient bluish-green LLP in Eu2+ and Nd3+ co-doped BaLu2Si3O10 is shown in Fig. 10. Under UV excitation, the 4f7 ground-state electrons of the Eu2+ ions are promoted to the 4f65d1 excited state (excitation process 1). Partial electrons which are promptly excited are reincorporated with the Eu2+ ions excited on the Ba and Lu sites to produce luminescence (PL process 2). As most Eu2+ ions occupy the Ba sites and tiny Eu2+ ions occupy the Lu sites, the phosphor emits blue light. Simultaneously other excited electrons are able to move via the conduction band and are captured later by the traps (electron trapping process 3). When the electrons captured by shallow traps are thermally released at room temperature, they move back to the conduction band directly and a few of the captured electrons in deep traps escape through a quantum tunneling process. In view of the conduction band primarily being formed by Lu 5d states rather than Ba states, the released electrons prefer to transfer to the excited Eu2+ ions on the Lu sites which are in the same form of resonance and recombine with them, which gives rise to the green phosphorescence (LLP process 4). In short, it is the special form of the conduction band and the occupation situation of the emission centers that result in the interesting optical phenomenon.
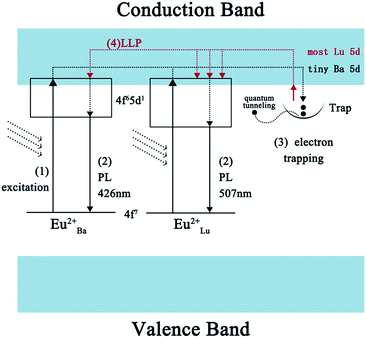 |
| | Fig. 10 A possible schematic diagram of the afterglow mechanism. | |
4. Conclusions
In a nutshell, a newly proposed bluish-green emitting long-lasting phosphor with prominent LLP properties is successfully achieved via a high temperature solid state method. Eu2+ ions show a broad asymmetric emission band with a peak at 426 nm as it occupies both the Ba and Lu sites in BaLu2Si3O10. The blue emitting phosphors show a kind of green phosphorescence phenomenon, which is induced mostly by the emission of Eu2+ ions occupying the Lu sites. Co-doping with Nd3+ ions can effectively improve the LLP performance. The LLP can last more than 6 h above the recognizable intensity level (0.32 mcd m−2). This work also provides direct experimental evidence that the conduction band is of critical significance for the course of LLP. And the analysis regarding this experimental work backs up the LLP mechanism. This new LLP material exhibits a 6 h LLP and has considerable potential for extensive applications.
Conflicts of interest
There are no conflicts to declare.
Acknowledgements
This work is supported by the National Natural Science Funds of China (Grant No. 51672115 and Grant No. 51372105). Thanks for the support of Chengguan district Lanzhou city science and technology development projects (project number: 2017-2-2).
Notes and references
- Z. Pan, Y. Y. Lu and F. Liu, Nat. Mater., 2012, 11, 58–63 CrossRef CAS PubMed.
- C. N. Xu, T. Watanabe, M. Akiyama and X. G. Zheng, Appl. Phys. Lett., 1999, 74, 2414–2416 CrossRef CAS.
- D. Q. Chen, Y. Chen, H. W. Lu and Z. G. Ji, Inorg. Chem., 2014, 53, 8638–8645 CrossRef CAS PubMed.
- D. Q. Chen, J. Eur. Ceram. Soc., 2014, 34, 4069–4075 CrossRef CAS.
- T. Maldiney, C. Richard, D. Scherman and D. Gourier, Chem. Mater., 2014, 26, 1365–1373 CrossRef.
- J. Wang, Q. Su and S. B. Wang, J. Phys. Chem. Solids, 2005, 66, 1171–1176 CrossRef CAS.
- S. Lian, Y. Qi, C. Rong, L. Yu, A. Zhu, D. Yin and S. Liu, J. Phys. Chem. C, 2010, 114, 7196–7204 CAS.
- B. Wang, H. Lin, Y. L. Yu, D. Q. Chen, R. Zhang, J. Xu and Y. S. Wang, J. Am. Ceram. Soc., 2014, 97, 2539–2545 CrossRef CAS.
- T. Matsuzawa, Y. Aoki, N. Takeuchi and Y. Murayama, J. Electrochem. Soc., 1996, 143, 2670–2673 CrossRef CAS.
- H. J. Guo, W. B. Chen, W. Zeng and Y. H. Wang, J. Mater. Chem. C, 2015, 22, 5844–5850 RSC.
- Z. Hong, P. Zhang, X. Fan and M. Wang, J. Lumin., 2007, 124, 127–132 CrossRef CAS.
- V. K. Van den Eeckhout, P. F. Smet and D. Poelman, J. Lumin., 2009, 129, 1140–1143 CrossRef.
- T. Matsuzawa, Y. Aoki, N. Takeuchi and Y. Murayama, J. Electrochem. Soc., 1996, 143, 2670–2673 CrossRef CAS.
- H. Yamamoto and T. Matsuzawa, J. Lumin., 1997, 72–74, 287–289 CrossRef CAS.
- I. P. Sahu, D. P. Bisen, N. Brahme, L. Wanjari and R. K. Tamrakar, Res. Chem. Intermed., 2015, 41, 8797–8814 CrossRef CAS.
- P. J. Wang, X. H. Xu, D. C. Zhou, X. Yu and J. B. Qiu, Inorg. Chem., 2015, 54, 1690–1697 CrossRef CAS PubMed.
- T. L. Barry, J. Electrochem. Soc., 1968, 115, 1181–1183 CrossRef CAS.
- Y. Lin, Z. Zhang, Z. Tang, X. Wang and Z. Zheng, J. Eur. Ceram. Soc., 2001, 21, 683–685 CrossRef CAS.
- M. Wierzbicka-Wieczorek, U. Kolitsch and E. Tillmanns, Eur. J. Mineral., 2010, 22, 245 CrossRef CAS.
- Q. Wang, G. Zhu, S. Y. Xin, X. Ding, J. Xu, Y. S. Wang and Y. H. Wang, Phys. Chem. Chem. Phys., 2015, 17, 27292–27299 RSC.
- J. Q. Wang, W. R. Zhao, J. M. Zhong and L. C. Lan, J. Mater. Sci.: Mater. Electron., 2014, 25, 2162–2168 CrossRef CAS.
- J. Zhou and Z. G. Xia, J. Mater. Chem. C, 2015, 3, 7552–7560 RSC.
- W. R. Liu, C. C. Lin, Y. C. Chiu, Y. T. Yeh, S. M. Jang, R. S. Liu and B. M. Cheng, Opt. Express, 2009, 17, 18103–18109 CrossRef CAS PubMed.
- J. Zhou and Z. G. Xia, Opt. Mater., 2016, 52, 116–122 CrossRef.
- J. Brgoch, K. Hasz, K. A. Denault, C. K. H. Borg, A. A. Mikhailovsky and R. Seshadri, Faraday Discuss., 2014, 176, 333–347 RSC.
- K. Li, S. S. Liang, H. Z. Lian, M. M. Shang, B. G. Xing and J. Lin, J. Mater. Chem. C, 2016, 4, 3443–3453 RSC.
- P. Dorenbos, J. Phys.: Condens. Matter, 2003, 15, 8417 CrossRef CAS.
- M. Y. Peng, Z. W. Pei, G. Y. Hong and Q. Su, J. Mater. Chem., 2003, 13, 1202–1205 RSC.
- R. D. Shannon, Acta Crystallogr., 1976, 32, 751–767 CrossRef.
- G. Li, Y. H. Wang, H. J. Guo, J. Liu, D. W. Liu and P. Feng, J. Lumin., 2017, 192, 98–104 CrossRef CAS.
- G. Cao, L. K. Rabenberg, C. M. Nunn and T. E. Mallouk, Chem. Mater., 1991, 3, 149–156 CrossRef CAS.
- Y. Q. Li, Y. H. Wang, X. H. Xu, G. Yu and F. Zhang, J. Electrochem. Soc., 2010, 157, 39–43 CrossRef.
- N. Ruelle, M. P. Thi and C. Fouassier, Jpn. J. Appl. Phys., 1992, 31, 2786–2790 CrossRef CAS.
- C. Y. Liu, Z. G. Xia, Z. P. Lian, J. Zhou and Q. F. Yan, J. Mater. Chem. C, 2013, 1, 7139–7147 RSC.
- J. Zhang, X. Ma, Q. Qin, L. Shi, J. Sun, M. Zhou, B. Liu and Y. Wang, Mater. Chem. Phys., 2012, 136, 320–324 CrossRef CAS.
- J. Wang, S. Wang and Q. Su, J. Mater. Chem., 2004, 14, 2569–2574 RSC.
- R. Pang, C. Li, L. Shi and Q. Su, J. Phys. Chem. Solids, 2009, 70, 303–306 CrossRef CAS.
- B. Lei, H. Zhang, W. Mai, S. Yue, Y. Liu and S. Man, Solid State Sci., 2011, 13, 525–528 CrossRef CAS.
- T. Wang, Y. H. Hu, L. Chen, X. J. Wang and G. F. Ju, Radiat. Meas., 2015, 73, 7–13 CrossRef CAS.
- J. Glodo and A. Wojtowicz, J. Alloys Compd., 2000, 300, 289–294 CrossRef.
- T. Aitasalo, P. Deren, J. Hölsä, H. Junger, J. C. Krupa, M. Lastusaari, J. Legendziewicz, J. Niittykoski and W. Strek, J. Solid State Chem., 2003, 171, 114–122 CrossRef CAS.
- T. Kinoshita, M. Yamazaki, H. Kawazoe and H. Hosono, J. Appl. Phys., 1999, 86, 3729–3733 CrossRef CAS.
- R. Chen, J. Appl. Phys., 1969, 40, 570–585 CrossRef CAS.
|
| This journal is © The Royal Society of Chemistry 2018 |
Click here to see how this site uses Cookies. View our privacy policy here.  Open Access Article
 *ab
*ab
![[thin space (1/6-em)]](https://www.rsc.org/images/entities/char_2009.gif) :
:![[thin space (1/6-em)]](https://www.rsc.org/images/entities/char_2009.gif) H2 = 95
H2 = 95![[thin space (1/6-em)]](https://www.rsc.org/images/entities/char_2009.gif) :
:![[thin space (1/6-em)]](https://www.rsc.org/images/entities/char_2009.gif) 5) in a reducing atmosphere in a tube furnace powered by electricity. After calcining, the temperature of the samples was reduced within the furnace to room temperature and ground a second time for further application.
5) in a reducing atmosphere in a tube furnace powered by electricity. After calcining, the temperature of the samples was reduced within the furnace to room temperature and ground a second time for further application.


![[thin space (1/6-em)]](https://www.rsc.org/images/entities/char_2009.gif) exp(−t/τ1) + A2
exp(−t/τ1) + A2![[thin space (1/6-em)]](https://www.rsc.org/images/entities/char_2009.gif) exp(−t/τ2) + A0
exp(−t/τ2) + A0


