 Open Access Article
Generalized nano-thermodynamic model for capturing size-dependent surface segregation in multi-metal alloy nanoparticles†
Srikanth Divi and
Abhijit Chatterjee
 *
*
Department of Chemical Engineering, Indian Institute of Technology Bombay, Mumbai, India – 400076. E-mail: abhijit@che.iitb.ac.in
First published on 14th March 2018
Abstract
Multi-metal alloy nanoparticles (NPs) offer new avenues for exploration and design of nanoscale-properties, e.g., catalytic, electronic and optical properties, by virtue of their tunable composition. A method that can aid such exploration by accurately predicting the size-, shape- and composition-dependent elemental distribution associated with nanomaterials is crucially missing. A nano-thermodynamic model based on distribution coefficients Δ is introduced to fill this gap. Δ is employed to predict surface segregation in NPs as a function of the NP size and composition. Interestingly, we find Δ to be independent of size for NPs beyond 2 nm. This key finding motivates the construction of thermodynamic tables for distribution coefficients using segregation observed with one or more NP sizes. The tables can enable accurate prediction of phase diagrams for nanomaterials across a wide-range of sizes. Key concepts of this new theory are demonstrated with Au–Pt–Pd, Ag–Au–Pd and Ni–Pt–Pd, which are found to exhibit complex size-dependent segregation behavior for 2–6 nm NPs and relatively weaker size-dependence beyond 6 nm. Numerically well-converged values of Δ are calculated for small NPs using Monte Carlo simulations in the canonical ensemble. Simulations are based on an embedded atom method (EAM) potential for metal alloys.
1. Introduction
Metal alloy nanoparticles (NPs) are used extensively in fuel cells,1,2 catalysis3–6 and energy7,8 applications due to their tunable electronic, magnetic, optical and catalytic properties. For example, Pt-based nanoparticles synthesized via alloying with one or more metals can possess higher activity and selectivity at lower cost than pure Pt.9,10 It is well known that surface segregation, i.e., the tendency of one of the metals to enrich the surface, is ubiquitous in alloy NPs and greatly determines the nanoscale properties.3,6,11,12 However, predicting size-, shape- and composition-dependent segregation in metal alloy NPs is another matter. Experimental determination of the phase diagram in terms of the elemental distribution within alloy NPs is difficult even with ultra-high vacuum (UHV) characterization techniques. Recent applications of ternary metal nanoparticles in fuel cells,13 formic acid production,14 methanol oxidation,15 oxygen reduction reaction,16 hydrogen storage,17 hydrogen generation18 and electrochemical biosensors,19 highlight the need for a nano-thermodynamic model that can accurately predict segregation in binary and multi-metal alloy nanomaterials alike.Over the years, theoretical approaches have provided important insights into segregation phenomena in bulk materials. The simplest segregation model is the Langmuir–McLean theory20 where the surface composition is related to the bulk composition of the A–B binary alloy through the expression
 | (1) |
A recent review on theories of surface segregation and issues related to the nanoscale is provided in ref. 29. Segregation in alloy NPs can often be perplexing compared to their bulk counterparts for the following reasons. Nanomaterials possess a large surface-to-volume ratio. The diverse local atomic environments encountered in nanomaterials are far richer than the ones in bulk materials. Accounting for the multiple types of surfaces in eqn (1) or for that matter other segregation models is not straight-forward. Using MC simulations to directly sample the equilibrium configurations of NPs23,30–33 with accurate interatomic potentials may enable numerical estimation of ΔEseg. Since segregation is dependent on NP size, shape and overall alloy composition, ΔEseg is expected to retain this dependence thereby rendering eqn (1) unwieldy. It is important to realize that in bulk materials the bulk composition xbulks equals the overall mole fraction for species s in the NP xs, therefore ΔEseg can be written as a function of xs. In nanomaterials the surface composition xsurfaces ≠ xbulks ≠ xs, where xsurfaces and xbulks are unknown. Like experiments, MC studies are plagued by the combinatorial complexity associated with the underlying parameter space (size, shape, composition, etc.). MC simulations are generally employed with NPs less than 4–6 nm in size due to the tremendous amount of computer time required for these calculations. There are many situations that demand prediction capabilities beyond the ones offered by current segregation models.
Recently, we developed a thermodynamic model based on distribution coefficients Δ to elucidate the elemental distribution in bimetallic NPs.33 The distribution coefficient for an equilibrated A–B alloy particle
 | (2) |
2. Nano-thermodynamic model
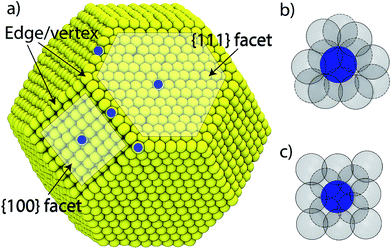
We consider a A–B–C truncated octahedron NP consisting of N atoms. Monte Carlo simulations are performed in the canonical (NVT) ensemble. More details are provided in the Method Section. The truncated octahedron shape is studied because of its low surface energy per unit volume. Given xs (overall mole fraction of species s), the number of s atoms in the NP is Ns = Nxs, s = A, B, C. Atoms can reside at specific sites in the NP. Each truncated octahedron NP possesses 8 {111} facets, 6 {100} facets, 12 {111}-{111} edges, 24 {111}-{100} edges, and 24 vertices (see Fig. 1). We focus on four regions, namely, {111} facet, {100} facet, bulk and edge/vertex sites denoted as 111, 100, Bu and EV, respectively. Nα is the number of sites in region α, α = 111, 100, Bu, EV. Nα determines the NP shape, surface area and volume. Extension to alloy NPs with more than 3 metal species and/or other shapes is trivial. We assume that N equals the total number of sites in the NP for the purpose of writing material balances later. The mole fraction of species s in region α is xαA = NαA/Nα where NαA is the average number of s atoms of region α. Typically, xαA or NαA needs to be determined given xs and Nα.
Metal atoms distribute themselves within the NP to lower the free energy. The Monte Carlo (MC) technique provides a useful means of sampling equilibrium configurations of the NP in the canonical ensemble. In MC one can perform trial moves consisting of exchange of positions of randomly-selected pairs of atoms in the NP among other types of moves. At equilibrium, the net probability flux for exchange of two metal species between two regions is zero. For the forward direction of the move
| A(α) + B(β) ⇌ A(β) + B(α), | (3) |
 . The term xαAxβB arises from the probability of selecting a pair of atoms. The fraction of trial moves accepted is given by the Metropolis acceptance criterion
  , which ensures the correct canonical distribution. Angular brackets denote ensemble-averaged value and ΔUα–β denotes the energy change associated with the forward direction. Writing a similar expression for the probability flux for the reverse move in eqn (3) and equating the forward and reverse probability fluxes we obtain
 | (4) |
The distribution coefficient provides a thermodynamic relation between the elemental compositions in various regions of the NP. Defining the distribution coefficient Δα–βA–B for eqn (3) in terms of the mole ratios in the same way as eqn (2), we obtain from eqn (4)
 | (5) |
Eqn (5) provides the theoretical basis for defining distribution coefficients for multi-metal alloys. In the context of ternary systems, the distribution coefficient Δα–βA–B describes the relative preference of both species A and B for the region α over β in the presence of a third metal species.
Although we restrict ourselves to the use of eqn (2) for estimating the distribution coefficients from known compositions and vice versa, eqn (5) does provide some important insights. Since the energy change associated with exchanging positions of A and B depends on the local atomic environment, beyond a certain NP size finite size effects cease to be important to the right hand side of eqn (5). A careful analysis of the embedded atom method (EAM) potential commonly used with metal alloys shows that the interactions up to the second nearest neighbor (2NN) atom position are important towards the calculation of ΔUα–β. Fig. 1b and c show the local environment up to 2NN positions for any {111} and {100} atom in the NP. Atoms lying at the facet boundary possess as many neighbors as the atom lying at the facet center. Similar observations are made for bulk atoms independent of size. This motivates the main point of this work: can distribution coefficients be assumed to be independent of the NP size and shape? If this assumption is valid, numerically accurate values of Δ for a few NPs can be extended to nanostructures with a wide range of size, shape and composition.
MC calculations can provide equilibrium compositions in regions for specified values of xA, xB, xC and Nα. A table of distribution coefficients typically of the form Δα−Bus−s′(xBuA, xBuB), s ≠ s is constructed directly from equilibrium compositions using eqn (2). Next, we focus on the inverse problem, namely, using a distribution coefficient table to solve for the unknown compositions in α = 111, 100, EV and Bu with values of xA, xB, xC and Nα being different from the ones used to construct the tables. There are 18 distribution coefficients for a ternary alloy NP with 4 regions. However, only 6 distribution coefficients are independent. The other distribution coefficients are related through the following identities:
| Δα–βA–B = Δα–γA–BΔγ–βA–B, | (6) |
| Δα–βA–B = Δα–βA–CΔα–βC–B, | (7) |
| Δα–βA–B = (Δβ–αA–B)−1, | (8) |
and
| Δα–βA–B = (Δα–βB–A)−1. | (9) |
The distribution coefficients are used alongside material balance equations for region α:
| xαA + xαB + xαC = 1. | (10) |
The overall balance for species s
 | (11) |
3. Self-consistent procedure for estimating elemental distribution from tabulated distribution coefficients
The main challenge is that Δα–βA–B is a function of the compositions in α and β and cannot be determined until the elemental distributions are known. Thus, eqn (2), (10) and (11) form a system of implicit nonlinear equations with constraints. The distribution coefficients and compositions are determined simultaneously using a self-consistent procedure. In this procedure, an initial guess for the bulk composition {xBuA, xBuB, xBuC} is made. Typically, this guess involves initializing the bulk composition to given values of {xA, xB, xC}. Estimating Δ111–BuA–B(xBuA, xBuB) and Δ111–BuA–C(xBuA, xBuB) requires interpolating the tabulated distribution coefficients. Using the definition of the distribution coefficients with (eqn (10)) we solve for x111s, s = A, B, C from
 | (12) |
Note that Δ111–Bus–s = 1 in eqn (12). Similarly, the compositions xs100 and xEVs, s = A, B, C are solved for using expressions analogous to eqn (12). The residual is calculated in terms of the compositions in each regions as
 | (13) |
The value of {xBuA, xBuB, xBuC} that minimizes the residual is deemed to be the solution. The optimization steps are performed while moving on the Δ − xBuA − xBuB surface. This scheme is termed as self-consistent because the calculated compositions are consistent with thermodynamics while satisfying the constraints given by eqn (10) and (11). The pseudo-code is provided in Table 1.
| Input: |
| (1) Thermodynamic tables for six distribution coefficients typically of the form Δα–Bus–s′(xBuA, xBuB) |
| (2) Number of atoms in each region Nα, α = 111, 100, EV, Bu |
| (3) Overall composition {xA, xB, xC} |
![[thin space (1/6-em)]](https://www.rsc.org/images/entities/char_2009.gif) |
| Output: |
| Compositions xαA, xαB and xαC for the regions Bu, 111, 100 and EV |
![[thin space (1/6-em)]](https://www.rsc.org/images/entities/char_2009.gif) |
| Pseudo-code: |
| Step 1. Choose an initial guess for xBuA, xBuB and xBuC |
| Step 2. Find xBuA, xBuB and xBuC that minimize the residual R2. The residual is calculated in the following steps: |
| (a) Estimate x111A, x111B and x111C using interpolated values of Δ111–BuA–B and Δ111–BuA–C |
| (b) Estimate x100A, x100B and x100C using interpolated values of Δ100–BuA–B and Δ100–BuA–C |
| (c) Estimate xEVA, xEVB and xEVC using interpolated values of ΔEV–BuA–B and ΔEV–BuA–C |
| (d) Calculate the residual (eqn (13)) |
4. Computational details
4.1 Interatomic potentials for ternary metal alloys
Embedded atom method (EAM) interatomic potentials developed for bimetallic alloys with tunable mixing parameter of ref. 34 are employed here. The potential energy Et is calculated as
 | (14) |
 . The value of the parameter θ was obtained for each binary metal system (Table 2) by performing numerical fits to the experimental heats of mixing shown in Fig. 2. The predicted segregation behavior for NPs was found to be in good agreement one observed in previous literature.34
| Metal A | Metal B | θ |
|---|---|---|
| Au | Pt | 0.707 |
| Au | Pd | 0.693 |
| Pt | Pd | 0.541 |
| Ag | Pd | 0.663 |
| Ag | Au | 0.545 |
| Pt | Ni | 0.509 |
| Au | Ni | 0.705 |
| Ni | Pd | 0.637 |
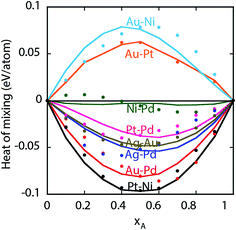 | ||
| Fig. 2 Heats of mixing for bulk A–B alloys. Symbols are experiments and lines are predictions from the EAM potential. | ||
4.2 Segregation energies and heats of mixing
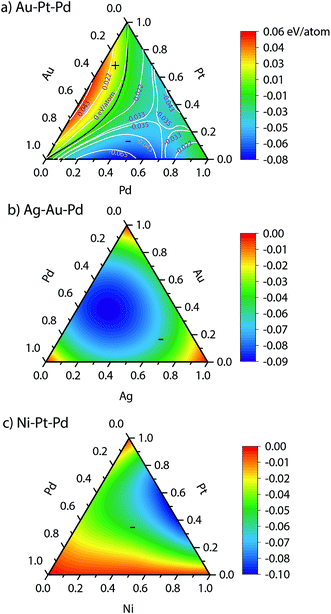
The heat of mixing and segregation energies are two important parameters used in rules of thumb to determine phase separation and surface segregation. Fig. 3 shows the heats of mixing for bulk Au–Pt–Pd, Ag–Au–Pd and Ni–Pt–Pd alloys from EAM, i.e., when surfaces are absent. A positive heat of mixing implies that segregation is favored, whereas negative heat of mixing implies alloying. Black curve in Fig. 3 denotes the composition where zero heat of mixing is observed. The symbols (+) and (−) highlight the compositions with positive and negative heat of mixing, respectively.Experimentally, a miscibility gap is known to exist for Au–Pt at low temperatures whereas Au–Pd and Pd–Pt are miscible in the solid phase. The heats of mixing predicted using EAM for Au–Pt–Pd are in good agreement with the experimental ones35 (white lines in Fig. 3a). The heat of mixing is positive at low Pd compositions similar to the one observed with Au–Pt in Fig. 2. Other parts of the diagram are associated with a negative heat of mixing as Au–Pd and Pd–Pt are completely miscible. In contrast, negative heats of mixing are obtained with all compositions of Ag–Au–Pd and Ni–Pt–Pd alloys (Fig. 3b and c, respectively) and the corresponding binary pairs (see Fig. 2).
The relative tendency for the metal species to enrich a surface is captured by segregation energies. Segregation energy is calculated for dilute alloys in terms of the energy required to bring an impurity atom from a bulk site to a surface site. One impurity atom in an otherwise pure host is considered. The L-BFGS optimization method was used to obtain the fully relaxed structures. Segregation energies are usually calculated for extended surfaces. Here the impurity atom is allowed to occupy five surface sites marked in blue circle in Fig. 1a. Thus, the segregation energy for {111} facet, {100} facet, {111}–{111} edge, {100}–{111} edge and vertex sites are obtained. The impurity atom is placed at the center of the NP when it is present in the bulk region.
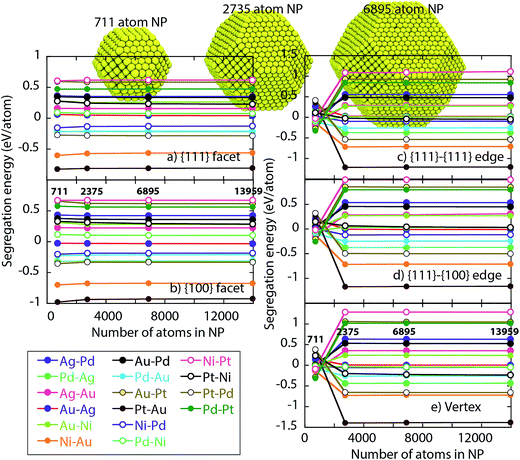
Fig. 4 shows the segregation energy as a function of the NP size. NPs of size 711, 2735, 6895 and 13959 atoms (symbols in Fig. 4) are considered. For various host–impurity pairs (see legend in Fig. 4), the main observations are that the segregation energies can be positive or negative. Negative segregation energies imply the impurity atoms prefer residing in the surface. The observed surface segregation tendencies are Ag > Au > Pd > Ni, Pt. Another important observation is that the segregation energy varies with the type of surface site highlighting the need for distribution coefficients Δα–βA–B for pair of regions α–β.
Segregation energies for the {111} and {100} facets are more or less independent of size for NPs containing 711 or more atoms. However, EV segregation energies for the 711 atom NP are different from ones for the larger NPs. This behavior is expected since the EAM interactions tend to be significant up to 2NN, which is comparable to the edge length for the 711 atom NP shown in Fig. 4. Based on this observation and the dependence of the distribution coefficient on the energy differences in eqn (5) we might expect distribution coefficients involving EV to be a function of size. Other regions could be affected because of the coupling through eqn (10) and (11). Later, we shall demonstrate that this is not the case.
5. Results and discussion
MC simulations of Au–Pt–Pd, Ag–Au–Pd and Ni–Pt–Pd NPs are performed to demonstrate (i) complex segregation patterns such as compositional heterogeneity, compositional oscillations, phase separation and ordered structures within the NPs, (ii) the inability of standard rules of thumb to quantitatively predict segregation patterns in NPs, (iii) size-independence of the distribution coefficients and (iv) features of the nano-thermodynamic model. More details on the MC simulations are provided in the Methods Section.5.1 Au–Pt–Pd
From the segregation energies and heats of mixing we expect Pt and Pd to reside in bulk while Au prefers the surface. Cross-sectional views of Au–Pt–Pd NP shown in Fig. 5 are largely in line with these expectations. In bulk, good mixing between Au and Pd, moderate mixing between Pd and Pt, and no mixing between Au and Pt is observed. However, Au can also be present in bulk while mixing with Pd (Fig. 5a and d) and Pd can reside in the {111}/{100} facets (Fig. 5d). Pt atoms accumulate in the sub-surface layer below the {111} facet with xPt = 0.1 (Fig. 5a and c). This behavior is identical to the one observed in binary Au–Pt NPs at low Pt concentration. Au atoms decorate the EV region. At high Pt compositions (Fig. 5b), Pt completely occupies the bulk and is also present at the {111}/{100} facets. An onion-like structure is observed in Fig. 5d where the outermost shell is composed mainly of Au, Pt forms the sub-surface layer, and Au and Pd form the core.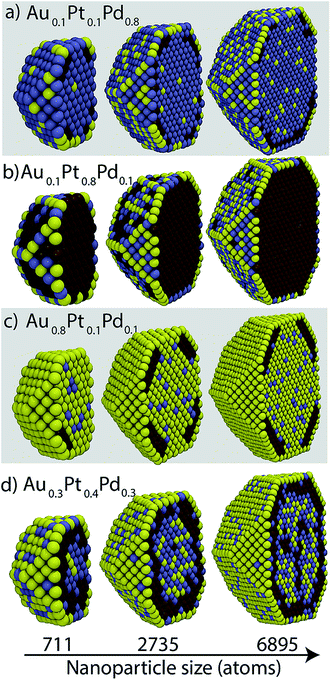 | ||
| Fig. 5 Cross-sectional views of Au–Pt–Pd NPs containing 711, 2735 and 6895 atoms. Yellow, brown and blue colors denote Au, Pt and Pd, respectively. | ||
The cross-sectional views in Fig. 5 indicate that the local compositions are size-dependent. Surface compositions of {111} facets vary with size in Fig. 5b. In Fig. 5c, the Pt sub-surface layer is 1 and 2 atoms thick for 711 and 2735 atom NPs, respectively. The NP core in Fig. 5d contains Au–Pd for 711 and 2735 atom NP whereas the 6895 atom NP contains Pt as well. The richness in the phase behavior and the compositional heterogeneity within a region is important to the calculation of the distribution coefficients (eqn (5)). Starting structures often used for the calculation of segregation energies and heats of mixing do not account for this complex phase behavior.
Fig. 6 shows the elemental distribution between the regions as a function of the alloy composition {xAu, xPt} for the 711 atom NP. Compositions from MC simulations are shown in blue dots in Fig. 6. These compositions directly provide the table of distribution coefficients. The green surfaces were generated using Delaunay triangulation of the data for the purpose of interpolating the distribution coefficients. In an ideal situation where no preferential enrichment of a region occurs, the elemental composition would be identical in each region, i.e., xαs = xβs. Instead, a complex nonlinear behavior is observed. Although the distribution coefficients do not capture the rich compositional heterogeneity within the NP, as shown later they can correctly provide compositions in each region (like Fig. 6) as a function of size. Heats of mixing and segregation energies in the dilute regime cannot provide such quantitative information.
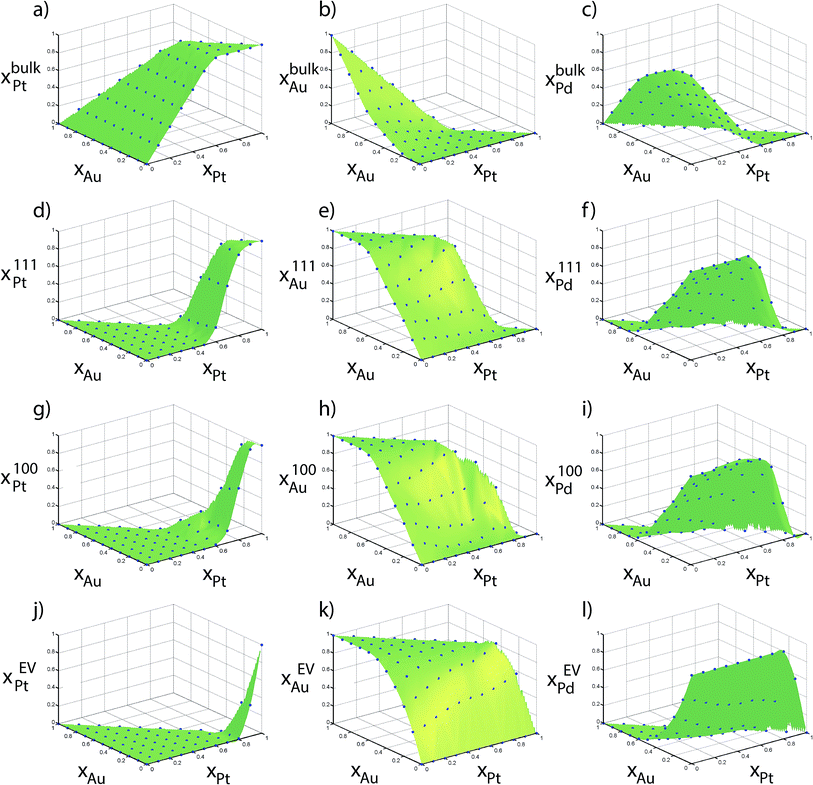 | ||
| Fig. 6 Compositions measured using Monte Carlo calculations of 711 atom Au–Pt–Pd NPs are shown in points. | ||
Six independent distribution coefficients are calculated from the compositions measured for the 711 atom NPs (Fig. 7). These distribution coefficients can vary over 3–5 orders of magnitude highlighting a strong compositional-dependence. The variation in Δ at the intermediate compositions cannot be captured using the dilute-regime segregation energies. Note that log10![[thin space (1/6-em)]](https://www.rsc.org/images/entities/char_2009.gif) Δ is plotted against xBus as required by the nano-thermodynamic model and not in terms of the xs. log10
Δ is plotted against xBus as required by the nano-thermodynamic model and not in terms of the xs. log10![[thin space (1/6-em)]](https://www.rsc.org/images/entities/char_2009.gif) Δ111–BuPt–Au is always less than 1, i.e., x111Pt/x111Au < xbulkPt/xbulkAu. In other words, Pt has a lower preference for {111} facet than Au (Fig. 7a). Similarly, log10
Δ111–BuPt–Au is always less than 1, i.e., x111Pt/x111Au < xbulkPt/xbulkAu. In other words, Pt has a lower preference for {111} facet than Au (Fig. 7a). Similarly, log10![[thin space (1/6-em)]](https://www.rsc.org/images/entities/char_2009.gif) Δ111–BuPd–Au is always less than 1. In Au-rich phases, Δ111–BuPd–Au < Δ111–BuPt–Au (Fig. 7b) that implies x111Pd/x111Pt < xbulkPd/xbulkPt contrary to our previous understanding from binary segregation energies at the dilute-regime that Pd is more likely to be present at the {111} surface in comparison to Pt. Trends for 100 and EV regions are similar to the ones for 111.
Δ111–BuPd–Au is always less than 1. In Au-rich phases, Δ111–BuPd–Au < Δ111–BuPt–Au (Fig. 7b) that implies x111Pd/x111Pt < xbulkPd/xbulkPt contrary to our previous understanding from binary segregation energies at the dilute-regime that Pd is more likely to be present at the {111} surface in comparison to Pt. Trends for 100 and EV regions are similar to the ones for 111.
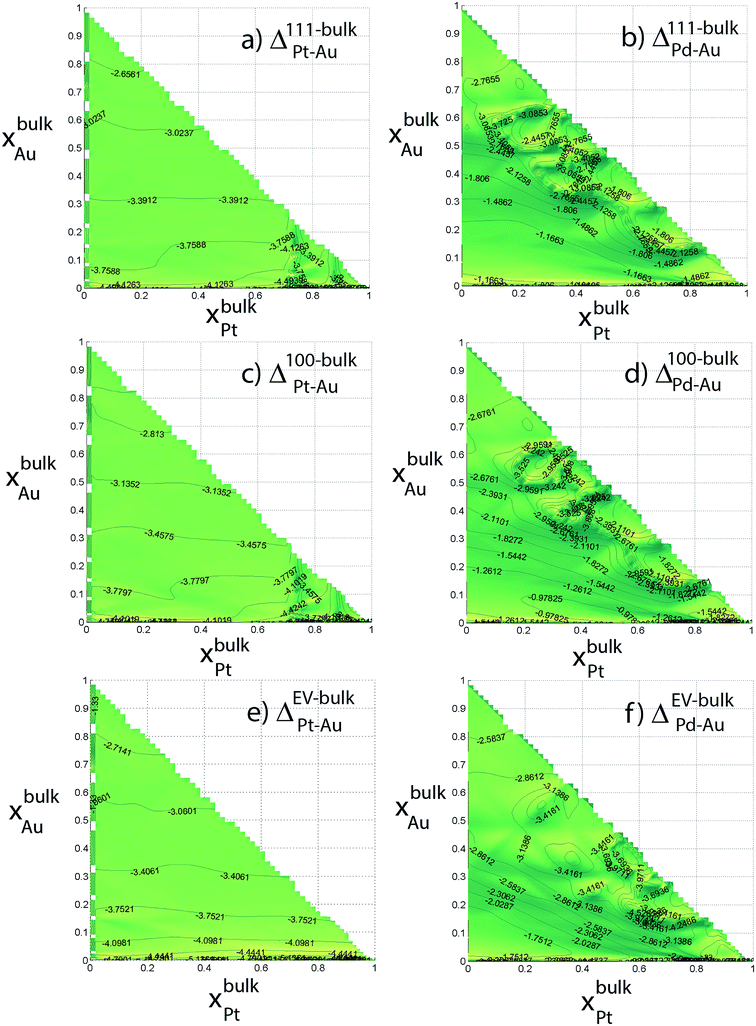 | ||
| Fig. 7 Distribution coefficients for 711 atom Au–Pt–Pd NP (in log10) as a function of the Au and Pt composition of the bulk. | ||
5.2 Ag–Au–Pd
Ag–Au–Pd is completely miscible in the solid phase. Fig. 8 shows cross-sectional views of the NPs at selected compositions. Most trends are consistent with the surface segregation tendencies at the dilute-regime, namely, Pd has a stronger preference for the bulk than Ag and Au, and Au and Ag atoms have nearly equal preference for the surface. Generally Ag would enrich the surface, however, it may be present in the bulk as well (Fig. 8b and d). Au prefers sub-surface at high Ag compositions (Fig. 8c). Random alloy formation is observed in Fig. 8d.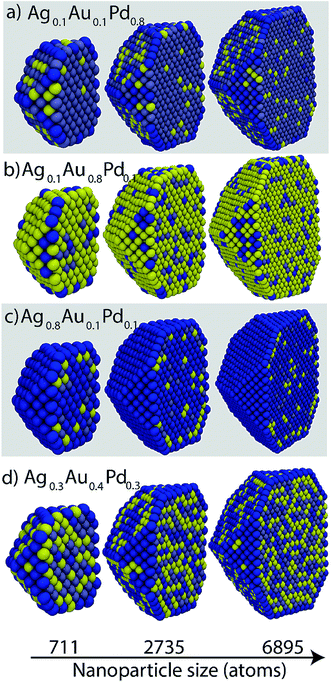 | ||
| Fig. 8 Cross-sectional views of Ag–Au–Pd NPs. Yellow, dark blue and grayish blue colors denote Au, Ag and Pd, respectively. | ||
The size effect is most clearly evident in Fig. 8a where Ag atoms are present in greater concentration at the edges of the 6895 atom NP in comparison to the smaller NPs. In addition, Ag is more visible at the {111} and bulk sites of the 6895 atom NP. In Fig. 8b the density of Pd–Ag clusters dispersed within bulk Au is lower for large NP sizes. Thus, the bulk Au composition increases with size. Other examples can be seen by visual inspection of Fig. 8. Fig. 9 shows Au, Ag and Pd compositions in various regions of 711 atom NP as a function of alloy composition. The strong tendency of Ag to saturate the surface sites is seen. The alloy composition where all surface sites will be occupied by Ag atoms is given by Nα/N, which is related to the surface to volume ratio of the NP. Thus, the transition from an alloyed surface to a complete Ag surface is a size-dependent property. Fig. S9 in ESI† shows six independent distribution coefficients calculated for the 711 atom NP. As in the case of Au–Pt–Pd NP the distribution coefficients vary over several orders of magnitude.
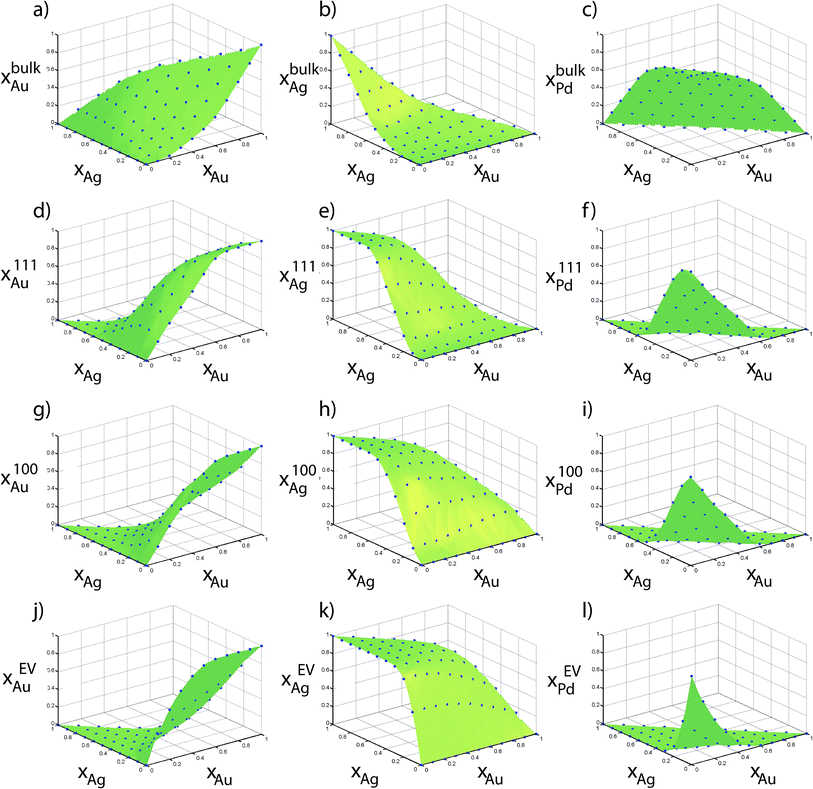 | ||
| Fig. 9 Compositions measured using Monte Carlo simulations of 711 atom Ag–Au–Pd NPs are shown in points. Surface was generated using Delaunay triangulation of the data. | ||
5.3 Ni–Pt–Pd
Cross-sectional views of the Ni–Pt–Pd NPs are shown in Fig. 10. Ordering observed in bulk at low Pd compositions (Fig. 10c) is consistent with L12 structures that are known to be present in the binary Ni–Pt system. The ordered regions are seen as 3 rows of Ni atoms followed by a row of Pt atoms in the cross-sectional views of 711 and 2735 atom NPs. Partially ordered structures are observed with the 6895 atom NP. Ordered structures are also witnessed in Fig. 10d. Unlike the 711 atom NP, onion structures form within 2735 and 6895 atom NP, which consist of a Pd-rich outer shell, a Pd-rich core and Ni–Pt inner shell (Fig. 10). Fig. S10 of the ESI† shows the elemental compositions in each region as a function of the overall alloy composition.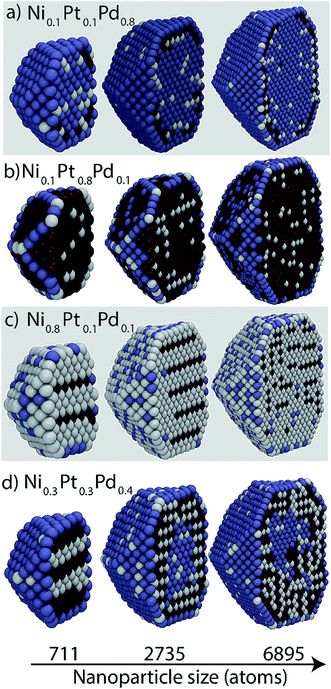 | ||
| Fig. 10 Cross-sectional views of Ni–Pt–Pd NPs. White, brown and blue colors denote Ni, Pt and Pd, respectively. | ||
5.4 Size-independence of the distribution coefficients
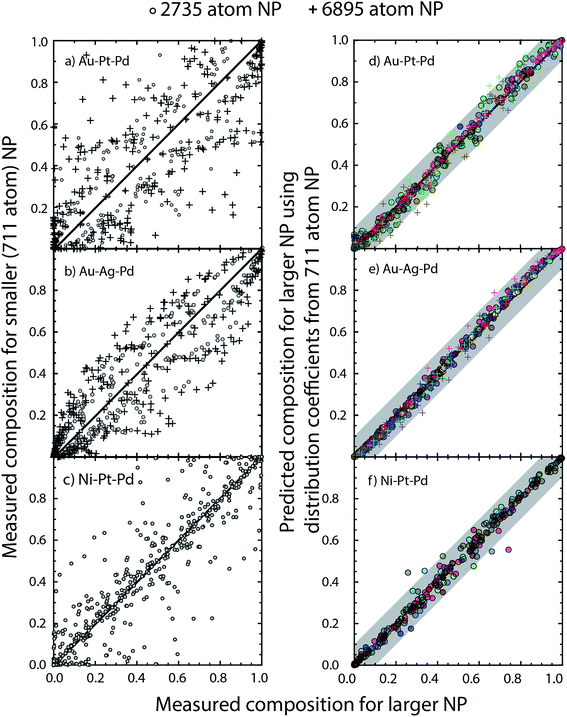
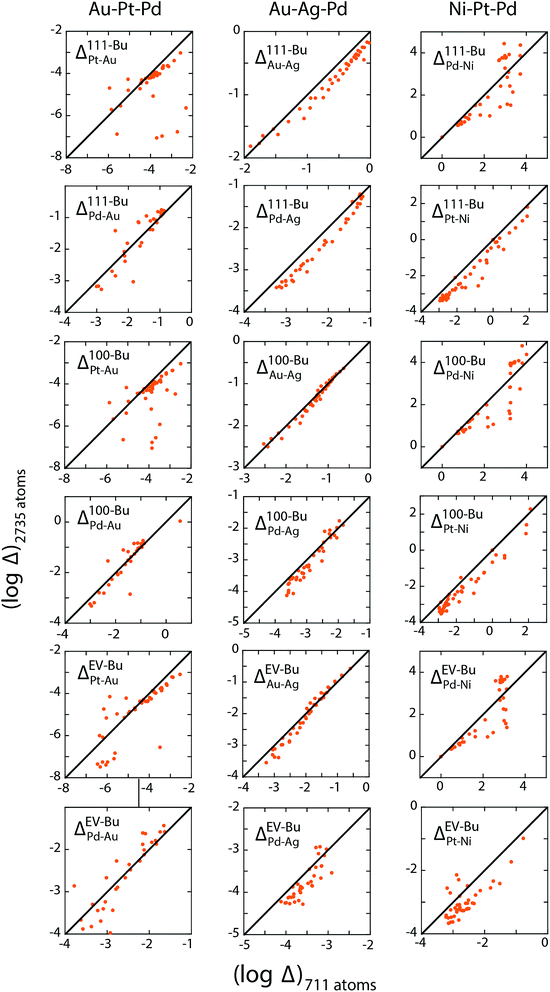
The three examples discussed so far exhibit distinct heats of mixing and segregation properties. Au–Pt–Pd is characterized by phase separation, Ag–Au–Pd by mixing and Ni–Pt–Pd by ordering in the bulk. Size-dependent effects were clearly observed but whether the distribution coefficients are size-dependent is verified next. We employ the distribution coefficients calculated with the 711 atom NPs with the nano-thermodynamic model to predict the compositions in larger NPs as a function of {xA, xB, xC} using the self-consistent procedure. Compositions in larger NPs are measured using MC calculations for the same {xA, xB, xC}. The predicted compositions are compared to the measured ones.Fig. 11a–c shows a parity plot comparing the region-wise compositions measured in the MC calculations for 711 and larger 2375 and 6895 atom NPs. The symbols deviate from the diagonal line in the parity plot. Plus symbols belonging to the 6895 atom NP deviate more than the circles (2735 atom NP) clearly demonstrating the size effect. Similar to previous studies on segregation in alloy NPs this size effect appears quite perplexing. When the distribution coefficients for the 711 atom NP are employed with the self-consistent procedure to predict compositions for the larger NPs, we find that the predictions are in good agreement with the measured compositions (Fig. 11d–f). Δ calculated from the measured compositions for the 711 and 2375 atom NPs are shown in Fig. 12. This confirms the main outcome of this study that Δ is independent of size for the ternary alloys investigated here.
Several important implications follow. First, the compositions {xA, xB, xC} do not provide a useful measure to understand elemental distribution with the NP. Instead equilibrium at the nanoscales is determined by {xbulkA, xbulkB, xbulkC}. The phase behavior (ordering/random ordering/phase separation) within the NP bulk is also determined by {xbulkA, xbulkB, xbulkC} as long as the NP size is reasonably large. Differences observed in the cross-sections in Fig. 5, 8 and 10 as a function NP size originates from the fact that {xA, xB, xC} was kept fixed like most studies on segregation. Second, Δ involving different regions (111, 100, EV, Bu, etc.) can be estimated using MC simulations of NPs. Size-independence is ascertained using simulations of two or more size. Previous experimental/theoretical studies where the local compositions have been measured can be used to construct tables of distribution coefficients. The MC technique is not amenable to 10 nm and larger NPs, which are frequently encountered in experiments. In such cases, well-converged values of distribution coefficients calculated with smaller NPs provide a useful starting ground for understanding the elemental distribution in other nanostructures.
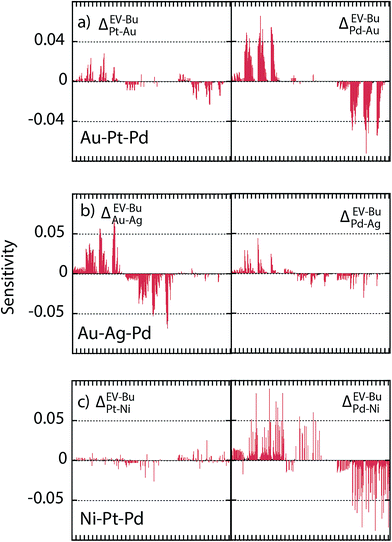
Since the segregation energy for the EV region was found to be size-dependent (Fig. 4c–e) we probe the effect of uncertainty in ΔEV–BuA–B on the nano-thermodynamic model. The sensitivity of the nano-thermodynamic model to the distribution coefficients is calculated as
 | (15) |
SlogΔ provides the change in composition as a distribution coefficient Δ (e.g., ΔEV–BuPt–Au) is altered by a decade while keeping other coefficients fixed. The model sensitivity towards ΔEV–BuA–B is calculated region-wise for each metal in the 2735 atom NP (Au–Pt–Pd, Au–Ag–Pd and Ni–Pt–Pd in panels a–c of Fig. 13). The sensitivity is studied for 36 ternary alloy compositions of Fig. 9, i.e., there are 432 data points in each panel of Fig. 13. Fig. 13 shows that the model is moderately sensitive to the distribution coefficients. A factor of 10 change in Δ (which corresponds to approximately 0.08 eV change in segregation energy at 400 K) can cause one or more compositions to shift by as much as 0.05. Based on this understanding the gray bands in Fig. 11d–f show the deviation in compositions when the distribution coefficients are allowed to vary by as much as two orders of magnitude. This suggests that even when ΔEV–BuA–B possesses a weak dependence on the NP size the nano-thermodynamic model may not be sensitive to the size. This may explain why there are many examples in literature where different EAM parameterizations report qualitatively similar segregation behavior.
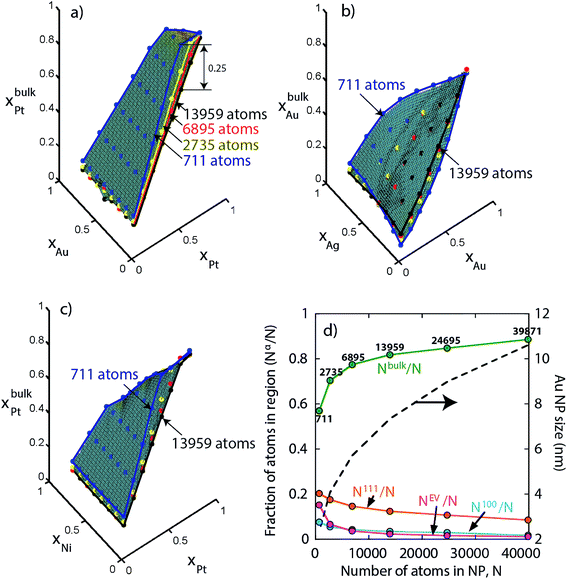
Finally, we investigate size effect in larger NPs not included so far in our study. For instance, keeping {xA, xB, xC} fixed xbulkPt is calculated as a function of the Au–Pt–Pd NP size. In Fig. 14a we see that initially xbulkPt decreases rapidly with increasing size but the variation becomes smaller beyond 6895 atoms (see blue, yellow, red and black edges for 711, 2735, 6895 and 13![[thin space (1/6-em)]](https://www.rsc.org/images/entities/char_2009.gif) 959 atom NPs in Fig. 14). The maximum change in xbulkPt for 711 atom to 13
959 atom NPs in Fig. 14). The maximum change in xbulkPt for 711 atom to 13![[thin space (1/6-em)]](https://www.rsc.org/images/entities/char_2009.gif) 959 atom NP is 0.25. Compositions in other regions are also sensitive to NP size for N < 6895 atoms. Similar size effect is also observed with Ag–Au–Pd and Ni–Pt–Pd NPs in Fig. 14b and c. The reason for this observation is provided in Fig. 14d. As N increases the fraction Nbulk/N begins to approach 1. The change in Nbulk/N is rapid for N = 711–6895 atoms but becomes gradual beyond 6895 atoms. As a result, for a significantly wide range of NP sizes, e.g., 10–40 nm NPs (size of Au NPs as a function of N is shown in Fig. 14d) the compositions xbulks possess a weak N-dependence (Nbulk/N ≈ 0.89–0.96 for 10–36 nm). In the limit of infinitely large NP, Nbulk/N ≈ 1 and xbulks ≈ xs. It is only in this limit that the alloy composition {xA, xB, xC} becomes a relevant thermodynamic variable for understanding segregation.
959 atom NP is 0.25. Compositions in other regions are also sensitive to NP size for N < 6895 atoms. Similar size effect is also observed with Ag–Au–Pd and Ni–Pt–Pd NPs in Fig. 14b and c. The reason for this observation is provided in Fig. 14d. As N increases the fraction Nbulk/N begins to approach 1. The change in Nbulk/N is rapid for N = 711–6895 atoms but becomes gradual beyond 6895 atoms. As a result, for a significantly wide range of NP sizes, e.g., 10–40 nm NPs (size of Au NPs as a function of N is shown in Fig. 14d) the compositions xbulks possess a weak N-dependence (Nbulk/N ≈ 0.89–0.96 for 10–36 nm). In the limit of infinitely large NP, Nbulk/N ≈ 1 and xbulks ≈ xs. It is only in this limit that the alloy composition {xA, xB, xC} becomes a relevant thermodynamic variable for understanding segregation.
We end our discussion by commenting on the distribution coefficient calculated in this work. The EAM parameters used here were originally fitted to material properties such as lattice constants, elastic constants, heats of mixing, vacancy formation energies and sublimation energies. The trends for segregation energy from the EAM model are in agreement with density functional theory (DFT) calculations.34 However, site preferences and segregation energies were not included in the fitting procedure. Therefore, the calculated values of distribution coefficients could be prone to errors resulting from the EAM parameterization. The accuracy of the distribution coefficients can be assessed by comparing with interatomic potentials that capture site preference and segregation energy more realistically. Since the goal here is to establish the nano-thermodynamic model we have chosen to focus only on capturing the segregation behaviour from an existing EAM model.
In our earlier work, we have shown the distribution coefficients are temperature-dependent. This was confirmed using MC simulations performed at temperatures 400 and 600 K. It will be interesting to study the temperature effect on the L12 ordering in the Ni–Pt–Pd system or the miscibility gap in the Au–Pt–Pd system and the consequent effect on the distribution coefficient.
6. Conclusions
A general nano-thermodynamic model for understanding segregation, i.e., preferential enrichment of a region by one or more metal species, in a multi-alloy nanoparticle (NP) has been introduced. The importance of this model can be gauged from the fact that knowledge of elemental distribution within an alloy NP is crucial for the calculation of the NP properties. The unique features of the model are:(i) Systematically capturing composition-dependent thermodynamic preference of the metal species for different regions of the NP using distribution coefficients Δ,
(ii) Accounting for size effects explicitly in terms of material balances for each region,
(iii) A self-consistent procedure needed to account the composition-dependence of Δ and size effects while predicting segregation is introduced,
(iv) Applicable to multi-alloy (2 or more species) NPs, and
(v) The ability to accurately quantify the elemental distribution which is not possible with many of the existing techniques,
As demonstrated using Au–Pt–Pd, Ag–Au–Pd and Ni–Pt–Pd NPs, the nano-thermodynamic model is capable of handling complex phase behavior, e.g., ordered structures, phase separation and alloying within the NP, even though it does not explicitly account for ordered structures or phase separation. The new understanding from this work, namely, that Δ might be independent of size and shape, which is not apparent from eqn (2) or (5), makes our approach particularly attractive. This crucial finding paves the way for development of distribution coefficient tables to describe the phase behavior at the nanoscales over a wide range of sizes. When tables are generated using MC simulations the reliability of the distribution coefficients would depend on the accurateness of the interatomic potentials. One can employ the tables to predict segregation more realistically in single or a collection of NPs with a broad size distribution for static and dynamical property measurement.37–41 Extension of the main concepts to experiments could significantly reduce the need to expensive characterization. From our investigations we also conclude that compositions are sensitive to size for NPs between 2–6 nm and comparatively less sensitive beyond 6 nm.
7. Methods
Metropolis Monte Carlo (MC) simulations36 are performed to study surface segregation in equilibrated alloy NPs at 400 K. 711, 2735 and 6895 atom (approximately 2–6 nm in size) truncated octahedron NPs in vacuum are considered. The NP was placed in a periodic box with the box being sufficiently large to avoid interactions with periodic images. Size of the periodic box is provided in Table S1 of the ESI.† NPs were created by randomly placing the requisite number of A, B, and C atoms for given {xA, xB, xC}. 3 ternary and 7 binary alloy materials were studied. Step size of 0.1 in the compositional range for xA, xB and xC resulted in 63 alloy compositions for each A–B–C system. 60% of the MC moves involved random atomic displacement of while the remaining 40% were swap moves, which entail exchanging positions of two randomly-chosen pairs of unlike atoms. In addition, a short molecular dynamics (MD) calculation involving 100 MD steps with time step of 4 fs was performed in the canonical ensemble after every 1000 MC moves to ensure that the system remains at the set-point temperature.1.25 million MC steps were first performed to equilibrate the system.The potential energy as a function of the MC steps is typically used to determine whether equilibration is attained (Fig. S1–S8 of the ESI†). Thereafter, longer MC calculations of 10 million steps were performed to sample composition in each region. NPs with 6895 or more atoms did not converge properly but were used to qualitatively verify the predicted segregation behavior predicted using 2.7 nm NP. Typical time required for performing 10 million MC trial moves with 711, 2735 and 6895 atom NPs are 1.3, 5.7 and 14.7 CPU days, respectively.
Conflict of interest
The authors declare no conflict of interest.Acknowledgements
The author acknowledges support from Science and Engineering Research Board, Department of Science and Technology Grant No. SB/S3/CE/022/2014 and Indian National Science Academy Grant No. SP/YSP/120/2015/307.References
- M. Oezaslan, F. Hasché and P. Strasser, Pt-Based Core–Shell Catalyst Architectures for Oxygen Fuel Cell Electrodes, J. Phys. Chem. Lett., 2013, 4(19), 3273–3291 CrossRef CAS.
- C.-J. Zhong, J. Luo, B. Fang, B. N. Wanjala, P. N. Njoki, R. Loukrakpam and J. Yin, Nanostructured Catalysts in Fuel Cells, Nanotechnology, 2010, 21(6), 62001 CrossRef PubMed.
- S. Sui, X. Wang, X. Zhou, Y. Su, S. Riffat and C. Liu, A Comprehensive Review of Pt Electrocatalysts for the Oxygen Reduction Reaction: Nanostructure, Activity, Mechanism and Carbon Support in PEM Fuel Cells, J. Mater. Chem. A, 2017, 5(5), 1808–1825 CAS.
- Y. Yan, J. S. Du, K. D. Gilroy, D. Yang, Y. Xia and H. Zhang, Intermetallic Nanocrystals: Syntheses and Catalytic Applications, Adv. Mater., 2017, 29(14), 1605997 CrossRef PubMed.
- Y. Dai, Y. Wang, B. Liu and Y. Yang, Metallic Nanocatalysis: An Accelerating Seamless Integration with Nanotechnology, Small, 2015, 11(3), 268–289 CrossRef CAS PubMed.
- B. Roldan Cuenya and F. Behafarid, Nanocatalysis: Size- and Shape-Dependent Chemisorption and Catalytic Reactivity, Surf. Sci. Rep., 2015, 70(2), 135–187 CrossRef CAS.
- S. Shan, J. Luo, L. Yang, C.-J. Zhong, J. B. Wu, H. Yang, A. K. Singh, Q. Xu, S. J. Guo and S. Zhang, et al. Nanoalloy Catalysts: Structural and Catalytic Properties, Catal. Sci. Technol., 2014, 4(10), 3570–3588 CAS.
- Y. P. Zhu, C. Guo, Y. Zheng and S.-Z. Qiao, Surface and Interface Engineering of Noble-Metal-Free Electrocatalysts for Efficient Energy Conversion Processes, Acc. Chem. Res., 2017, 50(4), 915–923 CrossRef CAS PubMed.
- A. K. Singh and Q. Xu, Synergistic Catalysis over Bimetallic Alloy Nanoparticles, ChemCatChem, 2013, 5(3), 652–676 CrossRef CAS.
- L. Wang and Y. Yamauchi, Strategic Synthesis of Trimetallic Au@pd@pt Core-Shell Nanoparticles from Poly(vinylpyrrolidone)-Based Aqueous Solution toward Highly Active Electrocatalysts, Chem. Mater., 2011, 23(9), 2457–2465 CrossRef CAS.
- G. E. Ramirez-Caballero and P. B. Balbuena, Surface Segregation of Core Atoms in Core–shell Structures, Chem. Phys. Lett., 2008, 456(1), 64–67 CrossRef CAS.
- N. J. Divins, I. Angurell, C. Escudero, V. Pérez-Dieste and J. Llorca, Influence of the Support on Surface Rearrangements of Bimetallic Nanoparticles in Real Catalysts, Science, 2014, 346, 6209 CrossRef PubMed.
- P. Brault, C. Coutanceau, P. C. Jennings, T. Vegge, J. Berndt, A. Caillard, S. Baranton and S. Lankiang, Molecular Dynamics Simulations of Ternary PtxPdyAuz Fuel Cell Nanocatalyst Growth, Int. J. Hydrogen Energy, 2016, 41(47), 22589–22597 CrossRef CAS.
- P.-P. Fang, S. Duan, X.-D. Lin, J. R. Anema, J.-F. Li, O. Buriez, Y. Ding, F.-R. Fan, D.-Y. Wu and B. Ren, et al., Tailoring Au-Core Pd-Shell Pt-Cluster Nanoparticles for Enhanced Electrocatalytic Activity, Chem. Sci., 2011, 2(3), 531–539 RSC.
- M. E. Scofield, C. Koenigsmann, L. Wang, H. Liu and S. S. Wong, Tailoring the Composition of Ultrathin, Ternary Alloy PtRuFe Nanowires for the Methanol Oxidation Reaction and Formic Acid Oxidation Reaction, Energy Environ. Sci., 2015, 8(1), 350–363 CAS.
- H. Wang, W. An, M. B. Vukmirovic, P. Liu, C. Ma, D. Su, R. R. Adzic, B. Hammer, Z. Sljivancanin and M. Mavrikakis, et al., Promoting the Oxygen Reduction Reaction with Gold at Step/edge Sites of Ni@AuPt Core-shell Nanoparticles, Catal. Sci. Technol., 2017, 7(3), 596–606 CAS.
- C. K. Ostrom and A. Chen, Synthesis and Electrochemical Study of Pd-Based Trimetallic Nanoparticles for Enhanced Hydrogen Storage, J. Phys. Chem. C, 2013, 117(40), 20456–20464 CAS.
- D. Bhattacharjee and S. Dasgupta, Trimetallic NiFePd Nanoalloy Catalysed Hydrogen Generation from Alkaline Hydrous Hydrazine and Sodium Borohydride at Room Temperature, J. Mater. Chem. A, 2015, 3(48), 24371–24378 CAS.
- A. Dutta and J. Ouyang, Ternary NiAuPt Nanoparticles on Reduced Graphene Oxide as Catalysts toward the Electrochemical Oxidation Reaction of Ethanol, ACS Catal., 2015, 5(2), 1371–1380 CrossRef CAS.
- J. M. Howe. Interfaces in Materials: Atomic Structure, Thermodynamics and Kinetics of Solid-Vapor, Solid-Liquid and Solid-Solid Interfaces, Wiley, 1997 Search PubMed.
- A. V. Ruban, H. L. Skriver and J. K. Nørskov, Surface Segregation Energies in Transition-Metal Alloys, Phys. Rev. B, 1999, 59(24), 15990–16000 CrossRef.
- M. Polak and L. Rubinovich, The Interplay of Surface Segregation and Atomic Order in Alloys, Surf. Sci. Rep., 2000, 38, 127–194 CrossRef CAS.
- G. Wang, M. A. Van Hove, P. N. Ross and M. I. Baskes, Quantitative Prediction of Surface Segregation in Bimetallic Pt–M Alloy Nanoparticles (M = Ni,Re,Mo), Prog. Surf. Sci., 2005, 79(1), 28–45 CAS.
- R. Ferrando, J. Jellinek and R. L. Johnston, Nanoalloys: From Theory to Applications of Alloy Clusters and Nanoparticles, Chem. Rev., 2008, 108(3), 845–910 CrossRef CAS PubMed.
- Z. H. Li and D. G. Truhlar, Nanothermodynamics of Metal Nanoparticles, Chem. Sci., 2014, 5(7), 2605 RSC.
- F. Calvo, Thermodynamics of Nanoalloys, Phys. Chem. Chem. Phys., 2015, 17(42), 27922–27939 RSC.
- A. R. Miedema, Surface Segregation in Alloys of Transition Metals, Int. J. Mater. Res., 1978, 455–461 CAS.
- J. R. Chelikowsky, Predictions for Surface Segregation in Intermetallic Alloys, Surf. Sci., 1984, 139(2–3), L197–L203 CAS.
- H. Liao, A. Fisher and Z. J. Xu, Surface Segregation in Bimetallic Nanoparticles: A Critical Issue in Electrocatalyst Engineering, Small, 2015, 11(27), 3221–3246 CrossRef CAS PubMed.
- L. Deng, W. Hu, H. Deng and S. Xiao, Surface Segregation and Structural Features of Bimetallic Au-Pt Nanoparticles, J. Phys. Chem. C, 2010, 114(25), 11026–11032 CAS.
- D. Cheng, X. Liu, D. Cao, W. Wang and S. Huang, Surface Segregation of Ag–Cu–Au Trimetallic Clusters, Nanotechnology, 2007, 18(47), 475702 CrossRef.
- P. Wynblatt and A. Landa, Computer Simulation of Surface Segregation in Ternary Alloys, Comput. Mater. Sci., 1999, 15(2), 250–263 CrossRef CAS.
- S. Divi and A. Chatterjee, Understanding Segregation Behavior in AuPt, NiPt, and AgAu Bimetallic Nanoparticles Using Distribution Coefficients, J. Phys. Chem. C, 2016, 120(48), 27296–27306 CAS.
- S. Divi, G. Agrahari, S. Kadulkar, S. Kumar and A. Chatterjee, Improved Prediction Of Heat Of Mixing And Segregation In Metallic Alloys Using Tunable Mixing Rule For Embedded Atom Method, Modell. Simul. Mater. Sci. Eng., 2017, 25(8), 085011 CrossRef.
- F. H. Hayes and O. Kubaschewski, The Heats of Formation in the System Gold-Platinum-Palladium, Met. Sci. J., 1971, 5(1), 37–40 CrossRef CAS.
- N. Metropolis, A. W. Rosenbluth, M. N. Rosenbluth, A. H. Teller and E. Teller, Equation of State Calculations by Fast Computing Machines, J. Chem. Phys., 1953, 21(6), 1087–1092 CrossRef CAS.
- D. Sholl and J. A. Steckel, Density Functional Theory: A Practical Introduction, John Wiley & Sons, 2011 Search PubMed.
- T. Rehman, M. Jaipal and A. Chatterjee, A Cluster Expansion Model for Predicting the Activation Barrier of Atomic Processes, J. Comput. Phys., 2013, 243, 244–259 CrossRef CAS.
- S. Verma, T. Rehman and A. Chatterjee, A Cluster Expansion Model For Rate Constants Of Surface Diffusion Processes On Ag, Al, Cu, Ni, Pd And Pt (100) Surfaces, Surf. Sci., 2013, 613, 114–125 CrossRef CAS.
- S. Divi and A. Chatterjee, Accelerating Rare Events While Overcoming the Low-Barrier Problem Using a Temperature Program, J. Chem. Phys., 2014, 140(18), 184115 CrossRef PubMed.
- V. Imandi and A. Chatterjee, Estimating Arrhenius Parameters Using Temperature Programmed Molecular Dynamics, J. Chem. Phys., 2016, 145(3), 34104 CrossRef PubMed.
Footnote |
| † Electronic supplementary information (ESI) available: See DOI: 10.1039/c8ra00945g |
| This journal is © The Royal Society of Chemistry 2018 |

