 Open Access Article
Facile synthesis of a two-dimensional layered Ni-MOF electrode material for high performance supercapacitors†
Cunrong Zhang,
Qi Zhang*,
Kai Zhang,
Zhenyu Xiao,
Yu Yang and
Lei Wang *
*
Key Laboratory of Eco-chemical Engineering, Ministry of Education, Laboratory of Inorganic Synthesis and Applied Chemistry, College of Chemistry and Molecular Engineering, Qingdao University of Science and Technology, Qingdao 266042, P. R. China. E-mail: inorchemwl@126.com; zhangqi@qust.edu.cn
First published on 15th May 2018
Abstract
Recently, various metal–organic framework (MOF)-based supercapacitors (SCs) have received much attention due to their porosity and well-defined structures. Yet poor conductivity and low capacitance in most MOF-based devices limit their wide application. As an electrode material, 2D MOFs exhibit a rapid electron transfer rate and high specific surface area due to their unique structures. In this work, a 2D layered Ni-MOF is synthesized through a simple solvothermal method and serves as an electrode material for SCs. Electrochemical studies show that the Ni-MOF exhibits low charge transfer resistance, excellent specific capacitance of 1668.7 F g−1 at 2 A g−1 and capacitance retention of 90.3% after 5000 cycles at 5 A g−1. Moreover, Ni-MOF//AC asymmetric SCs are assembled. The device exhibits high specific capacitance of 161 F g−1 at 0.2 A g−1 and the energy density reached 57.29 W h kg−1 at a power density of 160 W kg−1. The high electrochemical performance can be ascribed to the inherent porosity of MOFs and the 2D layered structure.
Introduction
The shortage of fossil fuels and the deterioration of the eco-environment leave people seeking out clean and efficient energy supplies, which in turn has triggered the booming of various electrochemical energy storage and conversion systems, such as supercapacitors (SCs),1–3 lithium-ion batteries (LIBs)4,5 and fuel cells (FCs).6,7 Among them, SCs, which are also called electrochemical capacitors, have drawn considerable attention due to their long cycling stability, high power density, super charge/discharge rate and environmental friendliness in the last few years.8,9 According to the storage mechanism, SCs can be classified into two types: electric double-layer capacitors (EDLCs) and pseudocapacitors.10 Both of them store charge at the surface or in a thin-layer region of the active materials. The former store charge through absorption/desorption of ions to form electric double layers, and the latter store charge via reversible faradic reactions.11–13 The active materials conventionally used in SCs are carbon, metal oxides and conducting polymers, however, few of them are applied in actual production due to their low energy density or cycle stability.14–16 For this reason, much effort have been devoted to the synthesis of novel materials with high electrochemical performance and study of the energy storage ability. Among them, inspired by the unique properties of graphene, other 2D nanomaterials such as transition metal dichalcogenides (TMDs),17 boron nitride (BN),18 and black phosphorus (BPs)19 have received much attention.Metal–organic frameworks (MOFs) are constructed by joining metal ions with organic links via strong coordinative bonds with periodic structural units.20–23 Recently, research on MOFs is certainly one of the most active fields due to their large specific surface area, tunable pore size and different topological structures. MOFs have been widely applied in sensing,24 gas storage and separation,25 catalysis,26 optoelectronics,27 electrochemical systems28,29 and so on. In fact, MOFs could provide inherent advantages as electrochemical electrode materials. The porous MOFs possess high specific surface area which can store more charge and the porosity will be a great benefit to the diffusion of electrolyte. Also, MOFs exhibited electrochemical active sites to increase pseudo-capacitive redox centers.28,29 However, reported MOFs electrode materials suffer from three disadvantages: weak conductivity, poor cycle stability and low specific capacitance, which dramatically limit their utilization as electrode materials for SCs. In view of the first two problems for MOF, using functional MOFs (conductive MOFs and water-stable MOFs) or bind with other additives to improve the conductivity or stability. For example, Yang et al. fabricated Ni-MOF/CNT composites to serve as the electrodes material and shows excellent conductivity.30 Its capacitance up to 1765 F g−1 at a current density of 0.5 A g−1 and energy density of 36.6 W h kg−1 at a power density of 480 W kg−1.30 M. Dincă et al. reported the first SCs made entirely from neat conductive MOFs as active material without other additives or binders, which shows high capacitance and capacity retention (90% retention over 10![[thin space (1/6-em)]](https://www.rsc.org/images/entities/char_2009.gif) 000 cycles).31 For the last problem, the solution lies in the improvement of the specific surface area and active sites. Yaghi et al. used a series of 23 porous MOFs nanocrystals as the electrode materials of SCs for high areal capacitance, a zirconium MOF among them has the areal capacitance of 5.09 mF cm−2.32 The high performance are attributed to the decreased particle size, which improve the specific surface area. Other method is to develop novel MOFs with sufficient pores and active sites to increase the specific capacitance, such as two-dimensional (2D) MOFs.
000 cycles).31 For the last problem, the solution lies in the improvement of the specific surface area and active sites. Yaghi et al. used a series of 23 porous MOFs nanocrystals as the electrode materials of SCs for high areal capacitance, a zirconium MOF among them has the areal capacitance of 5.09 mF cm−2.32 The high performance are attributed to the decreased particle size, which improve the specific surface area. Other method is to develop novel MOFs with sufficient pores and active sites to increase the specific capacitance, such as two-dimensional (2D) MOFs.
As a member of the 2D family, 2D MOFs have unique properties originating from both MOFs and 2D nanomaterials: large surface area, ordered pores and ultrathin thickness, which endow it has advantages in electrochemical compared with 3D bulk MOF crystals.33–35 The thin sheets to allow high electron transfer rate and rapid mass transport; high percentages of exposed active metal centers to improve the pseudocapacitance;36,37 the large lateral size also provides a big enough area to store charges. For these reasons, 2D MOFs may offer an ideal model system to explore high performance electrode materials of SCs. Many researches have been reported in the last decade for using 2D MOFs as electrode material. Wei et al. have successfully synthesized a 2D Ni-MOF via solvothermal method and use it as electrode material firstly.38 The material shows specific capacitances of 1127 F g−1 at 0.5 A g−1 and over 90% performance was retained after 3000 cycles.38 Wang et al. have studied the electrochemical performance of Co-based layered MOFs as an electrode material of SCs, which exhibits high specific capacitance of 2474 F g−1 at 1 A g−1 and capacitance retention up to 94.3% after 2000 cycles.39 However, the electrochemical performance of these materials should be further studied to investigate their actual application. Xue and his co-worker have synthesized an accordion-like Ni-MOFs, which exhibit outstanding cycling stability and high specific capacitance as electrode of SCs, but the synthesis progress is complicated for the ultrasonic treatment before used.40 Thus, 2D MOFs do have advantages in electrochemical and simple synthesis of MOFs electrode materials with high electrochemical performance is still in its infancy.
Inspired by the pioneering works using 2D MOFs as electrode material for SCs, herein, we report a 2D layered Ni-MOF directly synthesized through a simple, low cost solvothermal method and used it as the electrode material for SCs without further treatment. The characterization assays showed that the Ni-MOF own micropores structure and constructed by numerous nanosheets which enhance the specific surface area and provide nanochannels for ions and electronics. The electrochemical experiments show that the Ni-MOF has high specific capacitance of 1668.7 F g−1 at 2 A g−1 in a three-electrode system, which is much higher than the metal oxides from Ni-MOF. The specific capacitance remains 90.3% after 5000 cycles which suggested the high cycle stability. Moreover, a flexible asymmetric SC device was constructed based on the layered Ni-MOF and active carbon, which showed a energy density of 57.29 W h kg−1 at a power density of 160 W kg−1. The amazing electrochemical performance of the 2D layered Ni-MOF suggest this material is a promising electrode material of SCs.
Experimental
2.1 Synthesis of Ni-MOF
The Ni-MOF was synthesized according to the previous report.41 Typically, 1 mmol H3BTC (1,3,5-benzenetricarboxylic) and 0.5 mmol NiCl2·6H2O was dissolved in 20 mL DMF (N,N′-dimethylformamide) to form homogeneous solution. After that, the mixture was transferred into a 50 mL Teflon-lined stainless-steel autoclave and maintained at 100 °C for 48 h. The resultant green flake-like hexagonal tabular crystals were collected and washed with DMF, then dried at 80 °C for 6 h for further application.The metal oxide was obtained by calcining Ni-MOF under 400, 500, and 600 °C for 2 hours with a heating rate of 2 °C min−1 in air to destroy its structure, and the obtained materials were named compound 1, 2 and 3, respectively.
2.2 Characterizations
The phase purity and crystallinity of as-prepared products were characterized by the X-ray diffraction (XRD, D/max-500, Rigaku Co., Tokyo, Japan) using Cu Kα radiation (λ = 1.541874 Å) with the 2θ ranging from 5 to 50°.Thermogravimetric analysis (TGA) was performed on a TGA/DSC1 thermal analyser between room temperature and 800 °C with a heating rate of 20 K min−1 in N2 atmosphere.
The morphology of the samples was characterized by field-emission scanning electron microscopy (SEM, JSM-7500F). Transmission electron microscopy (TEM) images were collected on Tecnai G2 F20 with an accelerating voltage of 200 kV under 91 μA.
X-Ray Photoelectron Spectroscopy (XPS) was carried out on a VG ESCALABMK II photoelectron spectrometer using an Al Kα (1.2 eV) photon source.
Nitrogen adsorption/desorption isotherms were performed at 77 K with TriStar II Plus to study the porous structure and the surface area of the Ni-MOF. The specific surface area was calculated by the BET method.
2.3 Electrochemical measurements
Cyclic voltammetry (CV), galvanostatic charge–discharge curves and electrochemical impedance spectroscopy (EIS) tests were done to study the electrochemical behavior of the Ni-MOF electrode. CV curves were observed with the potential range of 0 to 0.6 V at different scan rates. GCD curves were collected at different current densities with potential window of 0 to 0.45 V. EIS experiments were carried out in the frequency range from 0.01 Hz to 105 Hz. These experiments were all tested on CHI660D electrochemical workstation. The specific capacitance of the electrode can be calculated from the following eqn (1):42
| C = (I·Δt)/(m·ΔV) | (1) |
| m+/m− = C−V−/C+V+ | (2) |
| E = (C·ΔV2)/2 ×3.6 | (3) |
| P = 3600E/Δt | (4) |
Results and discussion
3.1 Structure and morphology characterization
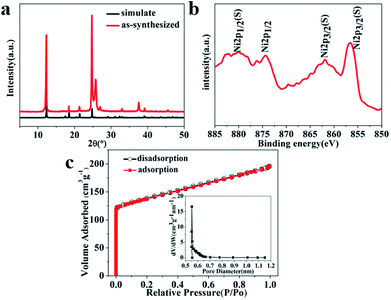
As shown in Fig. 1a, the XRD pattern of the as synthesized sample is in good agreement with the single-crystal data of [Ni(HBTC)(DMF)2·(guest)] (CCDC 636901). The coordination environments of Ni(II) ions is depicted in Scheme 1a where the nickel center is bounded with three BTC units. One of the BTC units coordinates to three metal centers in a bidentate fashion, while the other two BTC units coordinate to three metal centers in a monodentate fashion, and the solvent molecules occupy the polar position of the metal centers.41 The Ni-MOF possesses a 2D layered structure (Scheme 1b) with honeycomb pores that may contribute to larger specific surface area.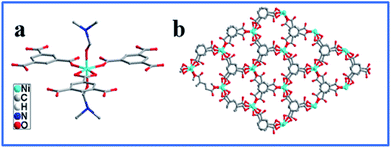 | ||
| Scheme 1 (a) Coordination environments of Ni(II) ions in the asymmetric units of the Ni-MOF; (b) view the structure of Ni-MOF along the c-axis. | ||
In order to examine the stability of the framework, thermal gravimetric analysis (TGA) were investigated in N2 atmosphere between room temperature and 800 °C with a heating rate of 20 K min−1 (Fig. S1†). The weight loss of Ni-MOF between 50 and 330 °C is about 35.35% owing to release of guest DMF molecules. Up to 350 °C, the decomposition of coordinated DMF molecule and BTC species in the MOF indicate that the compound begins to collapse, which is in accordance with the crystal data. The Ni-MOF was calcined under 400, 500, and 600 °C for 2 hours for compound 1, 2 and 3, respectively. XRD analysis was carried out to investigate the residual materials. As shown in Fig. S2,† all the diffraction peaks in the compound 3 can be well assigned to the NiO phase (JCPDS card no. 47-1049), indicating the formation of NiO from Ni-MOFs, and the sharp diffraction peaks with high intensity reveal the high crystalline and purity of the decomposed product. The diffraction peaks of the compound 1 and 2 were observed redundant peaks owing to the incomplete calcining. These results are coincidence with TGA that major weight loss of the Ni-MOF occurs before 500 °C.
XPS analysis was performed to get a further understanding of chemical composition of as-prepared Ni-MOF. As shown in Fig. 1b, The two major peaks centered at around 874.4 and 856.6 eV with a spin-energy separation of 17.6 eV, corresponding to Ni 2p1/2 and Ni 2p3/2, the other two broad peaks located at 880.1 and 862.0 eV are satellite bands of the major peaks, respectively. These results all imply the existence form of nickel ions is Ni2+ in the Ni-MOF, which is well consistent with previous literature reports.45–47
Typical isothermal nitrogen adsorption–desorption is measured to study the surface area and porous structure of the Ni-MOF. The result is shown in Fig. 1c, the nitrogen adsorption isotherm is a typical type I, the curve rises vertically at low relative pressure, indicating the dominating micropore characteristic. The adsorbed volume reached a plateau in the high relative pressure, which indicate N2 filling the pores. No obvious hysteresis loop between absorption and desorption suggests no further adsorption occurs in high relative pressure. The specific BET surface area of Ni-MOF was 436.06 m2 g−1. The pore size distribution calculated by the Horvath–Kawazoe differential method was shown in inset in Fig. 1c, the pore size was measured to be 0.5523 nm. The high specific surface area is benefit to the contact of electrolyte and electrode material, while the porous structure of Ni-MOF accelerates the ions diffusion rate, which result in high specific capacitance.
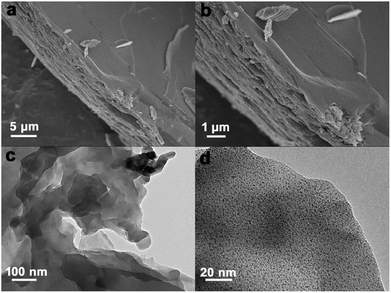
In order to confirm the morphology of 2D layered Ni-MOF, SEM and TEM experiments were carried out. SEM images were shown in Fig. 2a and b, the Ni-MOF was stacked up with numerous 2D sheets and the nano-sized sheets could provide lager specific surface area (Fig. S3†), which can store more charges and provide enough place for active metal centers. Obvious nanochannels between sheets were clearly seen, which may provide path for ions diffusion. The TEM images in Fig. 2c and d show the as-prepared ultrathin sheet with nanoscale size, this result is consistent with SEM images. In one word, the 2D layered Ni-MOF was synthesized successfully and the structure may own more electrochemical active sites and higher rate of the ions diffusion, which might help to improve the electrochemical performance of SCs.
3.2 Electrochemical evaluation of 2D layered Ni-MOF
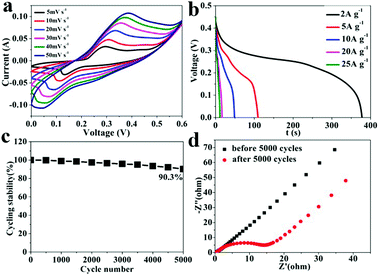
The electrochemical performance of the 2D Ni-MOF in three-electrode system was tested to investigate the feasibility of Ni-MOF used as electrode material of SCs. The cyclic voltammetry (CV) curves were measured to examine the electrochemical behavior of the as prepared Ni-MOF electrode in 3 M KOH. Fig. 3a shows the CV curves of Ni-MOF electrode at different scan rates in the potential range of 0–0.6 V. A pair of redox peaks was observed that indicates the pseudocapacitive behavior caused by the following faradic redox reactions:| [Ni(HBTC)(DMF)2] + OH− − e− → [Ni(HBTC)(DMF)(OH)]·DMF | (5) |
The hypothetical electrochemical process of the 2D Ni-MOF is also vividly shown in Scheme 2, as the previous report, the redox peaks were attribute to the intercalation and deintercalation of OH− in Ni-MOF.40 Briefly, during the fast charge process, one of the coordinated DMF molecule of the Ni-MOF is replaced by OH− along with that Ni2+ transfers to Ni3+, which is in coincidence with the oxidation peak of the CV curve; on the contrary, in the discharge progress, the OH− was released from the MOF and the Ni3+ transfers to Ni2+. It was found that the CV curves shape remained unchanged and the peak current increased with the increasing scan rate, which implied a high rate performance and reversibility of the charge–discharge process.
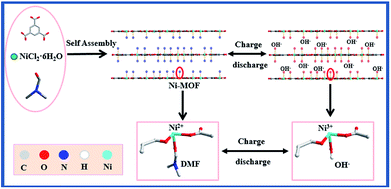 | ||
| Scheme 2 Schematic illustration of the formation process and electrochemical process for the 2D Ni-MOF. | ||
The galvanostatic charge–discharge were also tested in 3 M KOH electrolyte with a potential range of 0–0.45 V at various current densities ranging from 2 to 25 A g−1. As shown in Fig. 3b, the discharge curves show obvious characteristic of pseudocapacitor. Specific capacitance of the Ni-MOF electrode at different current densities can be calculated according to the eqn (1). The maximum specific capacitance of 1668.7 F g−1 was obtained at current density of 2 A g−1, which is comparable to previous reports for MOFs.30,38,40,44,48–52 Meanwhile, the specific capacitance values of the Ni-MOF electrode were measured to be 1224.67, 1110.2, and 648.89 F g−1 at current densities of 5, 10 and 20 A g−1, respectively. Even at 25 A g−1, the specific capacitance still maintained 564.73 F g−1, which indicating the Ni-MOF has a high rate capability. Excellent cycling stability is of vital importance for the electrode material of SCs to work steadily and safely. Fig. 3c shows the variation of the specific capacitance of Ni-MOF electrode at a current density of 5 A g−1. The electrode retained 90.3% of its initial capacitance after 5000 cycles, suggesting this Ni-MOF material exhibits high cycle stability. The TEM images after 5000 cycles in Fig. S4† shows slight change of their morphology but still retain the layer structure, the stability of the structure ensure the cycle stability.
The specific capacitance of the calcined samples were also calculated at 2 A g−1, the values were 198.7, 82, 77.7 F g−1, respectively (Table S1†). The higher performance of Ni-MOF electrode than compounds 1, 2, 3 may be attributed to the layered structure. The SEM of the calcined sample in Fig. S5† show the layered structure was destructed and nanoparticles aggregated together to form the bulk structure, which can't provide sufficient specific surface area to load more active sites. The decreasing BET specific surface area from isothermal nitrogen adsorption–desorption experiments (Fig. S6†) confirm the result. Interestingly, with the increasing calcinated temperature, the specific capacitance decreased. This can be explained from the crystallinity and specific surface area. The XRD pattern in Fig. S2† shows the FWHM (full width at half maximum) of each peak decreased with the calcined temperature, indicating the increasing crystallinity.53 While the poor crystallinity will benefit to the proton permeation when used in electrode material. For this reason, the compound 1 calcined in 400 °C owns the poor crystallinity and high specific surface area, then shows high specific capacitance, which is consistent with the experiment data in Table S1.†
In order to examine the conductivity of the Ni-MOF, the electrochemical impedance spectroscopy (EIS) spectrum was measured under open circuit condition. As shown in Fig. 3d, the Nyquist plots of the Ni-MOF electrode were obtained before and after 5000 cycles in frequency range of 0.01–105 Hz. Typical Nyquist plots contains two parts: semicircle in high frequency regions and a straight line in low frequency regions. The diameter of semicircle represents the charge transfer resistance (Rct) in the faradaic reactions and the slope of the straight refers to the diffusion resistance of ions in Ni-MOF electrode. The impedance results show that no obvious high frequency charge-transfer loop was founded before 5000 cycles, indicating high electron transfer rate in the electrode; and the value of Rct increased after 5000 cycles, which may result from the structure collapse and of Ni-MOF. Long Warburg line before and after 5000 cycles demonstrated the high electrolyte ions diffusion rate. This phenomenon was ascribed to the 2D porous structure and channels between sheets. In a word, the 2D structure enabled fast electron transport, while the pore and channels provide path for ions diffusion.
Thus, these above results demonstrate that the 2D Ni-MOF are promising materials as electrode material in SCs, the high electrochemical performance can be explained three aspects: firstly, 2D layered Ni-MOF owns high percentages of exposed active metal centers that increase the pseudocapacitance by redox reaction; secondly, the inherent porous structure and the nanochannels between sheets promote the ion diffusion rate and electron transfer rate; lastly, the large surface area can provide more active sites and store more charges.
3.3 Electrochemical performance of the Ni-MOF//AC asymmetric SC device
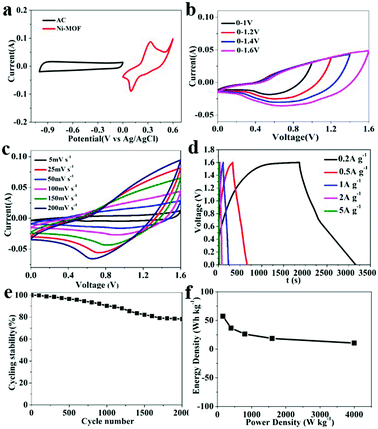
As the electrode material of SC, Ni-MOF owns high performance in three-electrode system. The performance of Ni-MOF in two-electrode system is also important for further practical application. For this reason, an asymmetric SC device Ni-MOF//activated carbon (AC) was designed with AC as the negative electrode and the Ni-MOF as the positive electrode. The mass ratio of the two electrodes was optimized according to the charge balance theory. Experimental results in Fig. 4 display the electrochemical performance of the asymmetric SC. The CV curves of the AC and Ni-MOF were carried out individually in three-electrode system to estimate the potential windows of the device. Fig. 4a shows the CV curves of the AC and Ni-MOF at a scan rate of 30 mV s−1. As a typical EDLC material, the CV curve of AC displays a nearly rectangular shape, while the Ni-MOF exhibits typical pseudocapacitive performance with redox peaks. In addition, the AC electrode was measured with a potential window of −1.15 V to 0 V, while the Ni-MOF was 0 V to 0.45 V. Therefore, it is anticipated that the maximum operating voltage of the device can reach to 1.6 V. Fig. 4b shows the CV curves of the asymmetric SC device at a scan rate of 30 mV s−1 with different potential window ranges. The shape of CV curves remains stable up to the optimal electrochemical voltage window, which is consistent with Fig. 4a.The CV curves of the Ni-MOF//AC asymmetric SC was measured within a potential window of 0 V to 1.6 V. As shown in Fig. 4c, the shape of CV curves shows the typical pseudocapacitive properties. In addition, the shape remains unchanged at increasing scan rates from 5 mV s−1 to 200 mV s−1, indicating an excellent rate capability of the asymmetric SC. To further investigate the charge storage performance of the SC device, the GCD experiments were carried out at various current densities over a wide voltage range of 0–1.6 V, the results were presented in Fig. 4d, on calculating the specific capacitance value of the device, it was found that the specific capacitances increased with increasing current density and the values are 161, 103, 74, 52.29 and 29.8 F g−1 at current densities of 0.2, 0.5, 1, 2 and 5 A g−1, respectively. Meanwhile, the cycling stability of the Ni-MOF//AC asymmetric SC was further evaluated at a current density of 1 A g−1 for 2000 cycles. Notably, it was observed that the device still retains 78.23% of the initial capacity, indicating its excellent cyclic stability (Fig. 4e). Furthermore, Fig. 4f reveals that the energy density of the Ni-MOF//AC symmetric SC reached 57.29 W h kg−1 at a power density of 160 W kg−1. The comparison of the specific capacitance, cycle stability and energy density obtained from our work with other previous reports are shown in Table 1. The results indicate the maximum value of energy density of 57.29 W h kg−1 is comparable among pioneers' reports for MOFs as electrode material indicating its promising application in SCs.
| Electrode | Specific capacitance (F g−1) | Energy density (W h kg−1) | Cycling stability | Ref. |
|---|---|---|---|---|
| Ni-MOF/CNT | 1765 at 0.5 A g−1 | 36.6 | 95% after 5000 cycles | 30 |
| Ni-MOF | 1127 at 0.5 A g−1 | 90% after 3000 cycles | 38 | |
| Ni-MOF | 988 at 1.4A g−1 | 4.18 mW h cm−3 | 96.5% after 5000 cycles | 40 |
| Ni-MOF | 726 at 1 A g−1 | 16.5 | 94.6% after 1000 cycles | 44 |
| Co/Ni-MOF | 236.1 at 1 A g−1 | 49.5 | 86% after 5000 cycles | 48 |
| Zn/Ni-MOF | 1620 at 0.25 A g−1 | 91% after 3000 cycles | 49 | |
| Ni-MOF | 1698 at 1 A g−1 | 94.8% after 1000 cycles | 50 | |
| Ni-MOF | 552 at 1 A g−1 | >98% after 16![[thin space (1/6-em)]](https://www.rsc.org/images/entities/char_2009.gif) 000 cycles 000 cycles |
51 | |
| Ni-MOF | 1577.7 at 1 A g−1 | 55.8 | 88.6% after 3000 cycles | 52 |
| Ni-MOF | 1668.7 at 2 A g−1 | 57.29 | 90.3% after 5000 cycles | Our work |
Conclusions
In summary, a 2D layered Ni-MOF was successfully synthesized through simple solvothermal method and used as electrode material of pseudocapacitor. The as-prepared Ni-MOF exhibited high performance, including a high specific capacitance of 1668.7 F g−1 at 2 A g−1, good rate capability, long cycle life with 90.3% capacitance retention after 5000 cycles. Furthermore, the Ni-MOF//AC asymmetric SC device owned high energy density of 57.29 W h kg−1 at a power density of 160 W kg−1. These results suggested the Ni-MOF can be applied to high performance SC, which may be due to the 2D layered structure. This study provides some information for designing 2D MOFs as electrode materials for SCs.Conflicts of interest
There are no conflicts to declare.Acknowledgements
The authors would like to thank the National Natural Science Foundation of China (No. 21203106, 21371105, 21571112, 51372125) and the Taishan Scholar Program; Natural Science Foundation of Shandong Province (ZR2016EMP02); the Natural Science Foundation of Qingdao (16-5-1-83-jch).References
- P. P. Shi, L. Li, L. Hua, Q. Q. Qian, P. F. Wang, J. Y. Zhou, G. Z. Sun and W. Huang, ACS Nano, 2017, 11, 444 CrossRef PubMed.
- M. H. Yu, W. T. Qiu, F. X. Wang, T. Zhai, P. P. Fang, X. H. Lu and Y. X. Tong, J. Mater. Chem. A, 2015, 3, 15792 Search PubMed.
- C. Chen, D. F. Yu, G. Y. Zhao, L. Sun, Y. Y. Sun, K. Y. Leng, M. Yu and Y. Sun, RSC Adv., 2017, 7, 34488 RSC.
- X. Y. Zhou, S. M. Chen, J. Yang, T. Bai, Y. P. Ren and H. Y. Tian, ACS Appl. Mater. Interfaces, 2017, 9, 14309 Search PubMed.
- Z. Y. Zhang, H. Yoshikawa and K. Awaga, J. Am. Chem. Soc., 2014, 136, 16112 CrossRef PubMed.
- X. j. Chen, Y. C. Zhang, P. Ribeiorinha, H. B. Li, X. Y. Konga and M. Boaventura, RSC Adv., 2018, 8, 5225 RSC.
- M. M. Liu, R. Z. Zhang and W. Chen, Chem. Rev., 2014, 114, 5117 CrossRef PubMed.
- S. L. Wang, N. S. Liu, J. Su, L. Y. Li, F. Long, Z. G. Zou, X. L. Jiang and Y. H. Gao, Nano Lett., 2017, 11, 2066 Search PubMed.
- N. Choudhary, C. Li, H. S. Chung, J. L. Moore, J. Y. Thomas and Y. W. Jung, ACS Nano, 2016, 10, 10726 CrossRef PubMed.
- M. Winter and R. J. Brodd, Chem. Rev., 2004, 104, 4245 CrossRef PubMed.
- J. Jiang, Y. Y. Li, J. P. Liu, X. T. Huang, C. Z. Yuan and X. W. Lou, Adv. Mater., 2012, 24, 5166–5180 CrossRef PubMed.
- P. J. Hall, M. Mirzaeian, S. I. Fletcher, F. B. Sillars, A. J. R. Rennie, G. O. Shitta-Bey, G. Wilson, A. Cruden and R. Carter, Energy Environ. Sci., 2010, 3, 1238 Search PubMed.
- C. Z. Yuan, B. Gao, L. F. Shen, S. D. Yang, L. Hao, X. J. Lu, F. Zhang, L. J. Zhang and X. G. Zhang, Nanoscale, 2011, 3, 529 RSC.
- Y. W. Zhu, S. Murali, M. D. Stoller, K. J. Ganesh, W. W. Cai, P. J. Ferreira, A. Pirkle, R. M. Wallace, K. A. Cychosz, M. Thommes, D. Su, E. A. Stach and R. S. Ruoff, Science, 2011, 332, 1537 CrossRef PubMed.
- D. B. Zhang, X. G. Kong, Y. F. Zhao, M. H. Jiang and X. D. Lei, J. Mater. Chem. A, 2016, 4, 12833 Search PubMed.
- N. Choudhary, C. Li, J. L. Moore, N. Nagaiah, L. Zhai, Y. Jung and J. Thomas, Adv. Mater., 2017, 29, 1605336 CrossRef PubMed.
- X. Huang, Z. Zeng and H. Zhang, Chem. Soc. Rev., 2013, 42, 1934 RSC.
- A. Pakdel, Y. Bando and D. Golberg, Chem. Soc. Rev., 2014, 43, 934 RSC.
- H. Wang, X. Yang, W. Shao, S. Chen, J. Xie, X. Zhang, J. Wang and Y. Xie, J. Am. Chem. Soc., 2015, 137, 11376 CrossRef PubMed.
- H. K. Kim, W. S. Yun, M. B. Kim, J. Y. Kim, Y. S. Bae, J. D. Lee and N. C. Jeong, J. Am. Chem. Soc., 2015, 137, 10009 CrossRef PubMed.
- L. Wang, X. Feng, L. T. Ren, Q. H. Piao, J. Q. Zhong, Y. B. Wang, H. W. Li, Y. F. Chen and B. Wang, J. Am. Chem. Soc., 2015, 137, 4920 CrossRef PubMed.
- G. C. Li, P. F. Liu, R. Liu, M. M. Liu, K. Tao, S. R. Zhu, M. K. Wu, F. Y. Yia and L. Han, Dalton Trans., 2016, 45, 13311 RSC.
- F. L. Meng, Z. G. Fang, Z. X. Li, W. W. Xu, M. J. Wang, Y. P. Liu, J. Zhang, W. R. Wang, D. Y. Zhao and X. H. Guo, J. Mater. Chem. A, 2013, 1, 7235 Search PubMed.
- Y. X. Guo, X. Feng, T. Y. Han, S. Wang, Z. G. Lin, Y. P. Dong and B. Wang, J. Am. Chem. Soc., 2014, 136, 15485 CrossRef PubMed.
- H. M. Wen, B. Li, D. Q. Yuan, H. L. Wang, T. Yildirim, W. Zhou and B. L. Chen, J. Mater. Chem. A, 2014, 2, 11516 Search PubMed.
- J. H. Hao, W. S. Yang, Z. Peng, C. Zhang, Z. P. Huang and W. D. Shi, ACS Catal., 2017, 7, 4214 CrossRef.
- Y. Bitla, C. Chen, H. C. Lee, T. H. Do, C. H. Ma, L. V. Qui, C. W. Huang, W. W. Wu, L. Chang, P. W. Chiu and Y. H. Chu, ACS Appl. Mater. Interfaces, 2016, 8, 32401 Search PubMed.
- Y. Wang, G. Ye, H. H. Chen, X. Y. Hu, Z. Niu and S. Ma, J. Mater. Chem. A, 2015, 3, 15292 Search PubMed.
- A. Morozan and F. Jaouen, Energy Environ. Sci., 2012, 5, 9269 Search PubMed.
- P. Wen, P. W. Gong, J. F. Sun, J. Q. Wang and S. R. Yang, J. Mater. Chem. A, 2015, 3, 13874 Search PubMed.
- D. Sheberla, J. C. Bachman, J. S. Elias, C.-J. Sun, Y. ShaoHorn and M. Dincă, Nat. Mater., 2017, 16, 220 CrossRef PubMed.
- K. M. Choi, H. M. Jeong, J. H. Park, Y. B. Zhang, J. K. Kang and O. M. Yaghi, ACS Nano, 2014, 8, 7451 CrossRef PubMed.
- F. F. Cao, M. T. Zhao, Y. F. Yu, B. Chen, Y. Huang, J. Yang, X. H. Cao, Q. P. Lu, X. Zhang, Z. C. Zhang, C. L. Tan and H. Zhang, J. Am. Chem. Soc., 2016, 138, 6924 CrossRef PubMed.
- Y. Peng, Y. S. Li, Y. j. Ban, H. Jin, W. M. Jiao, X. L. Liu and W. S. Yang, Science, 2014, 346, 1356 CrossRef PubMed.
- M. T. Zhao, Q. P. Lu, Q. L. Ma and H. Zhang, Small Methods, 2017, 1, 1600030 CrossRef.
- H. Zhang, ACS Nano, 2015, 9, 9452 Search PubMed.
- S. L. Zhao, Y. Wang, J. C. Dong, C. T. He, H. J. Yin, P. F. An, K. Zhao, X. F. Zhang, C. Gao, L. J. Zhang, J. W. Lv, J. X. Wang, J. Q. Zhang, A. M. Khattak, N. A. Khan, Z. X. Wei, J. Zhang, S. Q. Liu, H. J. Zhao and Z. Y. Tang, Nat. Energy, 2016, 184, 1 Search PubMed.
- J. Yang, P. X. Xiong, C. Zheng, H. Y. Qiu and M. D. Wei, J. Mater. Chem. A, 2014, 2, 16640 Search PubMed.
- X. X. Liu, C. D. Shi, C. W. Zhai, M. L. Cheng, Q. Liu and G. X. Wang, ACS Appl. Mater. Interfaces, 2016, 8, 4585 Search PubMed.
- Y. Yan, P. Gu, S. S. Zheng, M. B. Zheng, H. Pang and H. G. Xue, J. Mater. Chem. A, 2016, 4, 19078 Search PubMed.
- C. Y. Gao, S. X. Liu, L. H. Xie, Y. H. Ren, J. F. Cao and C. Y. Sun, CrystEngComm, 2007, 9, 545 RSC.
- J. S. Wei, H. Ding, P. Zhang, Y. F. Song, J. Chen, Y. G. Wang and H. M. Xiong, Small, 2016, 12, 5927 CrossRef PubMed.
- Z. F. Wang, Y. S. Liu, C. W. Gao, H. Jiang and J. M. Zhang, J. Mater. Chem. A, 2015, 3, 20658 Search PubMed.
- L. Kang, S. X. Sun, L. B. Kong, J. W. Lang and Y. C. Luo, Chin. Chem. Lett., 2014, 25, 957 CrossRef.
- J. W. Lee, T. Ahn, D. Soundararajan, J. M. Ko and J. D. Kim, Chem. Commun., 2011, 47, 6305 RSC.
- J. B. Liang, R. Z. Ma, N. B. Iyi, Y. S. Ebina, K. Takada and T. Sasaki, Chem. Mater., 2010, 22, 371 CrossRef.
- W. H. Shin, H. M. Jeong, B. G. Kim, J. K. Kang and J. W. Choi, Nano Lett., 2012, 12, 2283 CrossRef PubMed.
- Y. Jiao, J. Pei, D. Chen, C. Yan, Y. Hu, Q. Zhang and G. Chen, J. Mater. Chem. A, 2017, 5, 1094 Search PubMed.
- J. Yang, C. Zheng, P. X. Xiong, Y. F. Li and M. D. Wei, J. Mater. Chem. A, 2014, 2, 19005 Search PubMed.
- J. Xu, C. Yang, Y. F. Xue, C. Wang, J. Y. Cao and Z. D. Chen, Electrochim. Acta, 2016, 211, 595 CrossRef.
- C. Qu, Y. Jiao, B. Zhao, D. C. Chen, R. Q. Zou, K. S. Walton and M. L. Liu, Nano Energy, 2016, 26, 66 CrossRef.
- Y. Jiao, J. Pei, C. S. Yan, D. H. Chen, Y. Y. Hu and G. Chen, J. Mater. Chem. A, 2016, 4, 13344 Search PubMed.
- B. P. Bastakoti, H. S. Huang, L. C. Chen, K. C.-W. Wu and Y. Yamauchi, Chem. Commun., 2012, 48, 9150 RSC.
Footnote |
| † Electronic supplementary information (ESI) available. See DOI: 10.1039/c8ra01002a |
| This journal is © The Royal Society of Chemistry 2018 |

