 Open Access Article
Enhanced near infrared persistent luminescence of Zn2Ga2.98Ge0.75O8:Cr0.023+ nanoparticles by partial substitution of Ge4+ by Sn4+
Ting Song ,
Meng Zhang
 ,
Yuxue Liu
 *,
Jian Yang,
Zheng Gong,
Hong Yan,
Hancheng Zhu,
Duanting Yan,
Chunguang Liu and
Changshan Xu
School of Physics, Northeast Normal University, 5268 Renmin Street, Changchun, 130024, China. E-mail: yxliu@nenu.edu.cn
First published on 19th March 2018
Abstract
Spinel-phase Zn2Ga2.98Ge0.75–xSnxO8:Cr0.023+ (ZGGSO:Cr3+) nanoparticles with various Sn4+ concentrations were prepared by a hydrothermal method in combination with a post-annealing in vacuum at high temperature. For these nanoparticles, the observed near infrared (NIR) persistent luminescence peaked at ∼697 nm and originates from the 2E, 4T2 (4F) → 4A2 transitions of Cr3+ and the afterglow time exceeds 800 min. For both the interior and surface Cr3+ ions in the ZGGSO host, it can be found that the increased energy transfer from Cr3+ to the deep trap (anti-site defects,  ) after the substitution of Ge4+ by Sn4+ plays a key role in enhancing the persistent luminescence of the ZGGSO:Cr3+ nanoparticles. Strikingly, this energy transfer process can be controlled through the variations in the crystal field strength and the trap depths. Our results suggest that not only Sn4+ substitution can improve in vivo bioimaging but also the existence of deep traps in ZGGSO:Cr3+ nanoparticles is helpful for retracing in vivo bioimaging at any time.
Introduction
Nowadays, the materials and techniques related to in vivo bioimaging have attracted increasing attention because of their unique advantages, such as high sensitivity, contrast, resolution and in situ imaging during detection and therapy.1–8 Among them, the strategy adopting near infrared (NIR) persistent luminescence nanoparticles (PLNPs) is one of the most promising techniques because it does not need external excitation and possesses high penetrability during bioimaging.9–19 In particular, Cr3+ doped zinc gallate (ZGO:Cr3+) based PLNPs have been employed because its 3d3 electron configuration permits a narrow-band emission around 700 nm, which falls in the tissue optical window (650–1000 nm).20–28To understand how to enhance the persistent luminescence of ZGO:Cr3+, many efforts have been made by researchers. For example, Bessière et al. believed that, for Cr3+ doped ZnGa2O4 (ZGO:Cr3+) powders with spinel structure, the NIR persistent emissions at ∼695 nm originate from the distorted octahedral Cr3+ ions surrounded by anti-site pairs .29–31 In particular, Pan et al. found that the NIR afterglow time of Cr3+ doped zinc gallogermanate (Zn3Ga2Ge2O10:0:5% Cr3+) ceramics can be reached to more than 360 hours through the substitution of Ga3+ by Ge4+ due to the increased number of anti-sites defects.32,33 Our previous study found that, for Cr3+ doped zinc gallogermanate (Zn2Ga2.98−xGe0.75O8:Cr0.020, Prx) nanoparticles, the substitution of Ga3+ by Pr3+ can simultaneously decrease the particle size and enhance the NIR persistent luminescence.34 The related mechanism can be attributed to the generated anti-site defects and the suppressed energy transfer of the excited electrons from the 4T2 level to the deep trap level related to anti-site pairs around the distorted octahedral Cr3+ ions.31,34–37 However, for Cr3+ doped zinc gallogermanate nanoparticles, the effects of the variations in the crystal filed strength around Cr3+ ions and the depths of deep trap levels related to anti-sites on influencing the energy transfer from Cr3+ to the deep trap level still remain unclear.
Because cation substitution is an efficient approach to vary the crystal filed environments around luminescent centers, such as the bond length and crystal field strength, the substitution of Ge4+ by Sn4+ was employed in Cr3+ doped zinc gallogermanate nanoparticles.38 Here, the compositions of the samples with various Sn4+ concentrations (x) can be represented as Zn2Ga2.98Ge0.75−xSnxO8:Cr0.0203+. Furthermore, it is also essential to understand how Sn4+ substitution and the deep trap affect the bioimaging applications. Thus, this study can give the comprehension of how to design new Cr3+ doped zinc gallogermanate nanoparticles for in vivo bioimaging.
In this work, spinel-phase ZGGSO:Cr3+ nanoparticles with various Sn4+ concentrations were prepared by a hydrothermal method in combination with a post-annealing in vacuum at 800 °C. The effects of Sn4+ substitution on bond lengths, crystal filed strength, trap depth and the energy transfer from Cr3+ to the deep traps were studied in detail. For these nanoparticles, the observed near infrared (NIR) persistent luminescence peaked at ∼697 nm originates from the 2E, 4T2 (4F) → 4A2 transitions of Cr3+ and the afterglow time exceeds 800 min. For both the interior and surface Cr3+ ions in the ZGGSO host, it can be found that the increased energy transfer from Cr3+ to the deep trap (anti-site defects,  ) after the substitution of Ge4+ by Sn4+ plays a key role in enhancing the persistent luminescence of the ZGGSO:Cr3+ nanoparticles. Meanwhile, this energy transfer process can be controlled through the variations in the crystal field strength and the trap depths. Strikingly, our results suggest that an 808 nm stimulation is an efficient way to retrace in vivo bioimaging in the case that the persistent luminescence of NIR ZGGSO:Cr3+ nanoparticles is undetectable.
Synthesis and characterization
Zn2Ga2.98Ge0.75−xSnxO8:Cr0.023+ (ZGGSO:Cr3+) nanoparticles with various Sn4+ concentrations (x = 0, 0.015, 0.030, 0.063, 0.125 and 0.250) were prepared by a hydrothermal method in combination with a post-annealing in vacuum at high temperature. Gallium(III) nitrate hydrate (Ga(NO3)3·xH2O, 99.9%) (Sigma-Aldrich), zinc acetate (Zn(CH3COO)2, 99.99%) (Aladdin), chromium(III) nitrate nonahydrate (Cr(NO3)3·9H2O, 99.95%) (Aladdin), tin(IV) chloride (SnCl4, 99.99%) (Alfa Aesar) and germanium(IV) chloride (GeCl4, 99.9999%) (Alfa Aesar) were used as starting materials. They were dissolved in deionized water according to the proposed metal mole ratio. Then the solution was transferred into a Teflon-line steel autoclave with a capacity of 40 ml and heated at 180 °C for 4 h in a drying oven. The generated precipitates were washed with deionized water three times and then dried at 80 °C for 6 h to obtain as-prepared ZGGSO:Cr3+ nanoparticles. The final nanoparticles were acquired by annealing the as-prepared nanoparticles at 800 °C in vacuum (pressure: 2.3 × 10⁻³ Pa) for 1.5 h.The crystal structure of the samples was examined by a Rigaku D/MAX-2500 X-ray diffraction (XRD) spectrometer using Cu Kα radiation (0.15418 nm). The morphologies and compositions of the samples were characterized by means of a transmission electron microscope (TEM, JEOL-2100F). The Raman spectra were recorded by using a LabRAM HR Evolution Raman spectrometer (HORIBA) with a 488 nm excitation. The Rietveld refinements of XRD patterns were performed by GSAS program. The emission and excitation spectra, thermoluminescence (TL) and photostimulated luminescence (PSL) were recorded using a SHIMADZU RF-5301pc spectrophotometer equipped with a R928 photomultiplier tube. Especially, the emission spectrum at 80 K was obtained by using the above spectrophotometer in combination with INSTEC LN2-SYS Liquid Nitrogen Cooling Systems. The heating rate was 5 K min−1 and an 808 nm laser was used as a stimulation source. The afterglow decay curves were recorded by using a Zolix Omin λ-300 spectrophotometer. The measurements related to the luminescence kinetics of the samples were taken by an equipment combined with a LeCroy digital oscilloscope (62MXs-B), a Zolix Omin λ-300 spectrophotometer, an INNOLAS laser (SpitLight 600) and an INNOLAS optical parametric oscillator. X-ray photoelectron energy spectra (XPS) were obtained by using a Thermo ESCALAB 250 electron energy spectrometer with Al Kα radiation (1486.6 eV). All tests were performed at room temperature (RT) except for the TL measurements and part of emission spectra.
Results and discussion
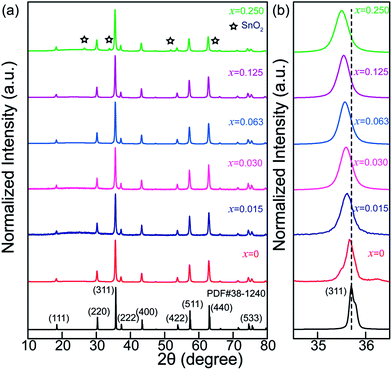
Fig. 1a shows XRD patterns of Zn2Ga2.98Ge0.75−xSnxO8:Cr0.023+ (ZGGSO:Cr3+) powders with various Sn4+ concentrations (x = 0, 0.015, 0.030, 0.063, 0.125 and 0.250). For the samples with Sn4+ substitution concentrations ranging from 0 to 0.125, the diffraction peaks correspond well to those of the standard ZnGa2O4 sample (JCPDS: 38-1240). This result suggests that single phase Zn2Ga2.98Ge0.75−xSnxO8:Cr0.023+ with spinel structure can be obtained. It can be explained by the replacement of Ga3+ by Ge4+, Sn4+ and Cr3+ ions due to the fact that their ionic radii, Ge4+(0.54 Å, CN = 6), Cr3+(0.615 Å, CN = 6) and Sn4+(0.69 Å, CN = 6), are similar to that of Ga3+(0.62 Å, CN = 6).39,40 Meanwhile, as the Sn4+ substitution concentration reaches to 0.250, additional XRD peaks related to impurity phases, such as Ga2O3, ZnO, GeO2 and SnO2 appear. It can be concluded that the maximum value of Sn4+ substitution concentration is lower than 0.250. In addition, for each sample with a certain Sn4+ concentration, the intensity ratio of (222) diffraction peak to (311) peak (I(222)/I(311)) was calculated and shown in Table 1. It can be found that the intensity ratios of the samples are in the range of 0.142–0.155, which is closer to that of ZnGa2O4 with normal spinel structure (0.13), but smaller than that of Zn2GeO4 with inversed spinel structure (0.20). This result indicates that the obtained samples maintain a normal spinel structure like ZnGa2O4.40 In particular, a slight shift of the (311) peak to lower angles with an increase of Sn4+ substitution concentration can be observed, as shown in Fig. 1b, further proving that the crystal lattice spacing is increased due to the substitution of Ge4+ by Sn4+.| Sample | I(222)/I(311) | Mean (nm) | Standard deviation (nm) |
|---|---|---|---|
| x = 0 | 0.144 | 37.7 | 6.4 |
| x = 0.015 | 0.147 | 38.2 | 6.0 |
| x = 0.030 | 0.151 | 38.0 | 5.9 |
| x = 0.063 | 0.142 | 36.9 | 5.6 |
| x = 0.125 | 0.147 | 37.5 | 7.5 |
| x = 0.250 | 0.148 | 37.4 | 6.8 |
To confirm the influence of Sn4+ substitution on the particle sizes of the samples, TEM images and EDS of ZGGSO:Cr3+ samples with various Sn4+ substitution concentrations (x = 0, 0.015, 0.030, 0.063, 0.125 and 0.250) are shown in Fig. 2a and b. It can be found that the average particle sizes of these samples are in the range 37.4–38.2 nm, as listed in Table 1. For all the samples, EDS signals related to Zn, Ga, Ge and O atoms in the ZGGO host can be observed. The signals related to Sn atom can be detected when the substitution concentration is equal to or larger than 0.063. The aforementioned results suggest that Sn4+ substitution has little influence on their particle sizes.
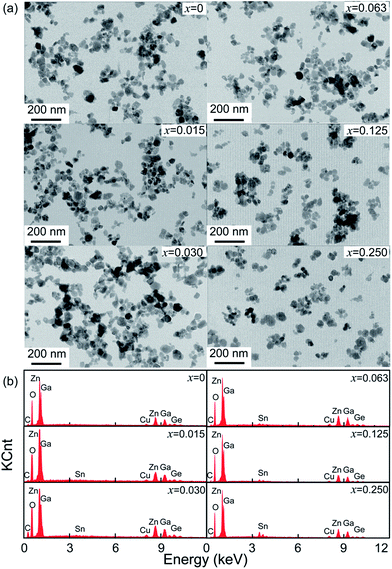 | ||
| Fig. 2 (a) TEM images and (b) EDS of ZGGSO:Cr3+ nanoparticles with various Sn4+ concentrations (x = 0, 0.015, 0.030, 0.063, 0.125 and 0.250). | ||
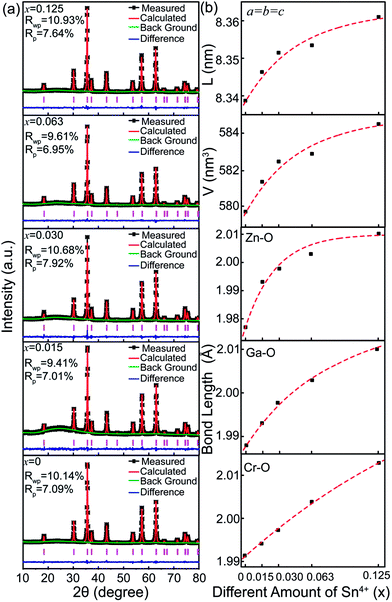
To further unravel the effect of Sn4+ substitution on the microstructure, the Rietveld refinements of XRD patterns for Zn2Ga2.98Ge0.75−xSnxO8:Cr0.023+ nanoparticles with various Sn4+ substitution concentrations ranging from 0 to 0.125 are shown in Fig. 3. For each of the samples, the obtained goodness of fitting parameters, Rwp, Rp and χ2, presented in Table 2, can ensure the reliability of the data fitting. Fig. 3b shows the calculated lattice constant, cell volume and Zn–O, Ga–O and Cr–O bond lengths as a function of Sn4+ substitution concentration. It can be found that these parameters increase with an increase of Sn4+ substitution concentrations because the ionic radius (0.62 Å) of Sn4+ is larger than that of Ge4+ (0.54 Å). In particular, the lattice constants and unit cell volumes show a slower increase as the Sn4+ substitution concentration is larger than 0.030. This suggests that it is difficult for Sn4+ ions substituting for interior Ge4+ ions and more Sn4+ ions appear on the surface of nanoparticles when x is larger than 0.030. This result is consistent with the XRD data, showing that the diffraction peaks related to SnO2 appear when x is equal to 0.250.
| Sample | x = 0 | x = 0.015 | x = 0.030 | x = 0.063 | x = 0.125 |
|---|---|---|---|---|---|
| Rwp | 10.14% | 9.41% | 10.68% | 9.61% | 10.93% |
| Rp | 7.09% | 7.01% | 7.92% | 6.95% | 7.64% |
| a = b = c (nm) | 8.339 | 8.347 | 8.34 | 8.351 | 8.361 |
| α = β = γ (°) | 90 | 90 | 90 | 90 | 90 |
| Volume (nm3) | 579.941 | 581.547 | 581.940 | 582.557 | 584.477 |
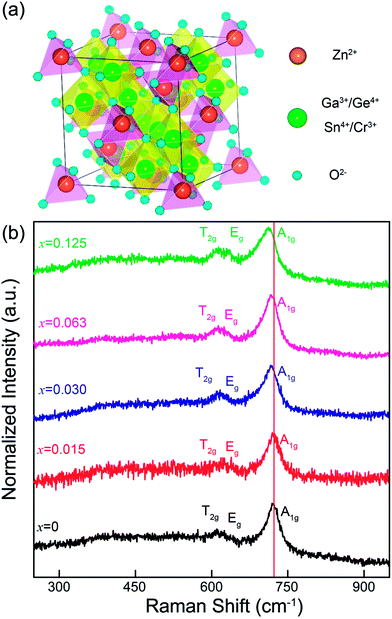
To illuminate the change in the microstructure induced by Sn4+ substitution, Fig. 4a and b show a cell of ZnGa2O4 with a spinel structure (AB2X4 formula) and Raman spectra of ZGGSO:Cr3+ nanoparticles with different Sn4+ substitution concentrations (x = 0, 0.015, 0.030, 0.063 and 0.125), respectively. In Fig. 4a, it can be found that a cell of ZGO contains a number of ZnO4 tetrahedrons and GaO6 octahedrons, which are centered by Zn2+ (occupying the A sites) and Ga3+ (occupying the B sites), respectively. On the basis of the study of Gorkom et al., the allowed Raman modes, A1g, Eg and T2g, originating from the symmetric stretching vibrations of ZnO4 groups can be found.41 Therefore, in Fig. 4b, for each of the samples, it is reasonable to detect the obvious Raman peaks at around 720, 630 and 610 cm−1, which are attributed to the A1g, Eg and T2g modes related to the Zn–O tetrahedron vibrations in the ZGGSO host, respectively.34,42 This result further suggests that the ZGGSO:Cr3+ nanoparticles with normal spinel structure were obtained. In particular, the Raman peaks related to the A1g mode show an obvious shift to lower wavenumbers with an increase of Sn4+ substitution concentration. This phenomenon might be explained by the increased Zn–O bond length due to partial substitution of Ge4+ by Sn4+. For the Y2O3-stabilized ZrO2 system, the similar result was reported by Hemberger et al., who believed that the Raman band shift of the Zr–O stretching vibrations depends on the environments around the participating ions, such as Zr4+ ions, and the Raman band shift to lower frequencies is due to the increased Zr–O bond length with increasing Y2O3.43 Because Sn4+ substitution also leads to the increased Cr–O and Ga–O bond lengths, it can be deduced that Sn4+ substitution might induce not only the change in the environments around Zn2+ ions, but also those around Cr3+ and Ga3+ ions.
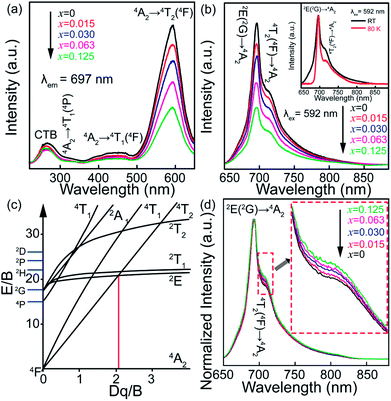
To confirm the variation in the environments around Cr3+ ions induced by Sn4+ substitution, excitation and emission spectra of ZGGSO:Cr3+ with various Sn4+ substitution concentrations (x = 0, 0.015, 0.030, 0.063 and 0.125) are shown in Fig. 5a and b, respectively. For each of all the samples, it can be observed that each excitation spectrum contains several of absorption peaks ranging from 220 to 660 nm when the monitored wavelength is 697 nm. The obvious excitation peaks at around 250, 440 and 592 nm can be attributed to the charge transfer from O2− to Cr3+, the 4A2 → 4T1(4F) and 4A2 → 4T2 (4F) transitions of Cr3+ ions, respectively. From room temperature emission spectra upon 592 nm excitation, it can be observed that there exist two emission peaks at 697 and 712 nm, respectively. On the basis of the previous study, they might be related to the transitions from the 2E and 4T2 (4F) states to the 4A2 state, respectively.26,27,44,45 To better discern the NIR emissions from the 2E and 4T2 energy levels of Cr3+ ions doped in ZGGO nanoparticles, emission spectra at RT and 80 K are shown in the inset of Fig. 5b. For RT emission spectrum, it can be observed that there exists a narrow emission at ∼697 nm superimposed on a broad emission band at ∼712 nm. At 80 K, the contribution of the narrow emission to the emission spectrum becomes more dominating compared to the broad emission band. The above result is in agreement with the study reported by Chen et al., who believed that the narrow emission at ∼697 nm and the broad emission band at ∼712 nm originated from the E(2G) → 4A2 and 4T2 (4F) → 4A2 transitions, respectively.46 In particular, Chen et al. found that the appearance of a narrow emission band superimposed on the broad emission band suggested that the Cr3+ ions were located in an intermediate crystal-field environment and the crystal field strength is close to the crossing between the 4T2 (4F) and 2E levels as shown in Fig. 5c.46,47 To further prove the above conclusion, Fig. 5d shows normalized emission spectra recorded at RT of ZGGSO:Cr3+ nanoparticles with various Sn4+ concentrations upon 592 nm excitation. From the enlarged part, it can be found that the intensity ratio of the 712 nm emission peak to the 697 nm emission peak increases with increasing Sn4+ substitution concentration. Our result is similar to that reported by Chen et al., who found that, for Cr3+ doped Bi2(Ga/Al)4O9, the substitution of Al3+ for Ga3+ could lead to the decreased ratio of broadband emission to the narrow emission and the stronger crystal field strength around Cr3+ ions.48 In our case, it can be deduced that Sn4+ substitution will give rise to the weakened crystal field strength around Cr3+ ions. Furthermore, on the basis of the study reported by Hermus et al., the relationship between the crystal field strength (Dq) around the luminescence center and the distance between the central atom (Cr3+) and the ligand (O2−) (R) can be expressed in the following equation:49
 | (1) |
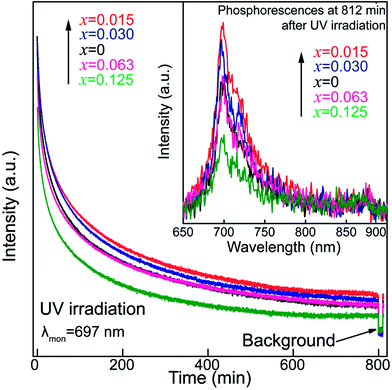
To understand how Sn4+ substitution influences the persistent luminescence of nanoparticles, afterglow decay curves of ZGGSO:Cr3+ nanoparticles with various Sn4+ substitution concentrations (x = 0, 0.015, 0.030, 0.063 and 0.125) monitored at 697 nm are shown in Fig. 6. For each of the samples, it can be found that the afterglow time exceeds 800 min (>13 h). This result is consistent with the fact that the obvious phosphorescence at 812 min after the stoppage of 254 nm irradiation can be detected as shown in the inset of Fig. 6. In particular, the afterglow intensities show an initial rise and a subsequent decrease with increasing Sn4+ substitution concentration from 0 to 0.125. The strongest afterglow intensity of the ZGGSO:Cr3+ nanoparticles with x = 0.015 can be obtained and its intensity recorded at 60 min after stopping 254 nm irradiation is ∼1.7 times as strong as that of the ZGGO:Cr3+ nanoparticles (x = 0). This result suggests that Sn4+ substitution can enhance the afterglow intensity of ZGGO:Cr3+ nanoparticles. According to our previous study on Pr3+ doped ZGGO:Cr3+ nanoparticles,50,51 the enhanced persistent luminescence can be explained by the increased number of the distorted Cr3+ ions and more generated anti-site defects around them due to Sn4+ substitution.38,52
To unravel the effect of Sn4+ substitution on the depth of the traps, TL spectra of ZGGSO:Cr3+ nanoparticles with various Sn4+ concentrations (x = 0, 0.015, 0.030, 0.063 and 0.125) are shown in Fig. 7. For each of all TL spectra, it can be observed that there exists a single broad TL peak at around 350 K. In particular, the TL peak position shifts to lower temperatures with increasing Sn4+ concentration. Generally, the trap depths can be obtained through the following equation:
| Et = Tm/500 | (2) |
 around distorted Cr3+ ions.31 According to our previous study on Pr3+ doped ZGGO:Cr3+ nanoparticles, the decrease of trap depth with increasing Sn4+ concentration indicates that anti-site defects are closer to distorted Cr3+ ions due to the increased numbers of the generated anti-site defects and distorted Cr3+ ions after Sn4+ substitution.34
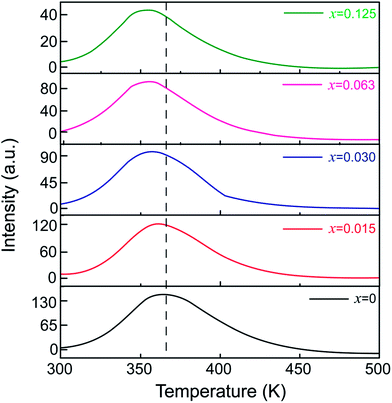 | ||
| Fig. 7 TL spectra of ZGGSO:Cr3+ nanoparticles with various Sn4+ concentrations (x = 0, 0.015, 0.030, 0.063 and 0.125). | ||
To further understand how Sn4+ substitution affects the surface distributions of Zn2+ and Ga3+ ions, XPS spectra of Zn 2p3/2 and Ga 3d5/2 core levels for ZGGSO:Cr3+ nanoparticles with various Sn4+ concentrations (x = 0, 0.015, 0.030, 0.063 and 0.125) are shown in Fig. 8a and b. These XPS peaks were calibrated by using the C 1s peak at 284.6 eV. For each of the samples with various Sn4+ concentrations, the binding energies of the Zn 2p3/2 and Ga 3d5/2 core levels can be obtained by fitting with a single Gaussian function, as listed in Table 3. On the basis of the afterglow spectral analysis and our previous XPS study on Pr3+ doped ZGGO:Cr3+ nanoparticles, it can be inferred that there merely exist Zn2+ ions in the tetrahedral sites and Ga3+ ions in the octahedral sites on the surface of the ZGGSO:Cr3+ nanoparticles, suggesting that Sn4+ substitution mainly leads to the generation of anti-site defects in the interior of the ZGGSO:Cr3+ nanoparticles.34 Strikingly, the peak positions related to the Zn 2p3/2 and Ga 3d5/2 core levels exhibit an initial decrease and a following increase with increasing Sn4+ concentration. The decreased binding energies of the Zn 2p3/2 and Ga 3d5/2 core levels with a rise of Sn4+ concentration might be related to the increased Zn–O and Ga–O bond lengths due to Sn4+ substitution. For carbon nitride systems, the similar behavior were also reported by Titantah et al., who found that the N 1s binding energy decreases with increasing C–N bond length.54 Meanwhile, the increased Zn 2p3/2 and Ga 3d5/2 binding energies can be attributed to the deformations of ZnO4 tetrahedrons and GaO6 octahedrons after Sn4+ substitution based on our previous study on Pr3+ doped ZGGO:Cr3+ nanoparticles.34
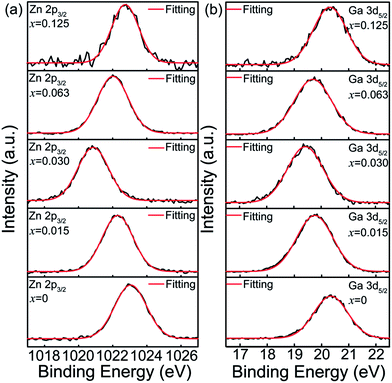 | ||
| Fig. 8 XPS spectra of (a) Zn 2p3/2 and (b) Ga 3d5/2 core levels for ZGGSO:Cr3+ nanoparticles with various Sn4+ concentrations (x = 0, 0.015, 0.030, 0.063 and 0.125). | ||
| x | Zn 2p3/2 | Ga 3d5/2 | Decay (4T2 → 4A2)d | Decay (2E → 4A2)e | ||
|---|---|---|---|---|---|---|
| BE (eV)b | BE (eV)c | τs (μs) | τi (μs) | τs (ms) | τi (ms) | |
| a The samples are ZGGSO:Cr3+ with various Sn4+ concentrations (x = 0, 0.015, 0.030, 0.063, 0.125).b BE refers to the binding energies of the Zn 2p3/2 core level.c BE refers to the binding energies of the Ga 3d5/2 core level.d Emission decay of the 4T2 → 4A2 transition.e Emission decay of the 2E → 4A2 transition. τs and τi represent the lifetimes related to the surface and interior Cr3+ ions, respectively. | ||||||
| 0 | 1023.1 | 20.3 | 78 | 668 | 2.23 | 6.63 |
| 0.015 | 1022.3 | 19.8 | 17 | 249 | 2.24 | 6.88 |
| 0.030 | 1020.9 | 19.4 | 19 | 218 | 2.62 | 7.43 |
| 0.063 | 1022.0 | 19.7 | 32 | 257 | 2.12 | 6.75 |
| 0.125 | 1022.7 | 20.3 | 34 | 398 | 2.06 | 6.71 |
To further illuminate the effect of Sn4+ substitution on the surroundings of Cr3+ ions, the decay curves of the 697 nm emission of ZGGSO:Cr3+ nanoparticles with various Sn4+ concentrations (x = 0, 0.015, 0.030, 0.063 and 0.125) under 575 nm excitation are shown in Fig. 9. In analogy with our previous study on Pr3+ doped ZGGO:Cr3+ nanoparticles, for each of the samples with various Sn4+ concentrations, the fitted lifetimes, as listed in Table 3, consist of four components.34 Herein, for ZGGSO:Cr3+ nanoparticles, all of the decay curves need to be fitted with a sum of four exponentials. The two longer lifetimes (unit: ms) are related to the 2E(2G) → 4A2 transitions of Cr3+ due to the forbidden spin-selection rule. The two shorter lifetimes (unit: μs) are related to the allowed 4T2 (4F) → 4A2 transitions of Cr3+. Furthermore, Cr3+ ions doped in nanoparticles can be sorted into two different surroundings: surface and interior. The lifetime of the surface Cr3+ exhibits a shorter decay time because of Cr3+ occupying low-symmetry sites.40
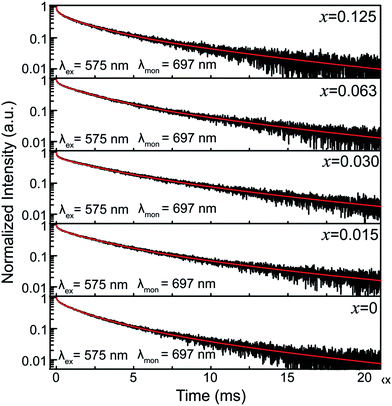 | ||
| Fig. 9 The decay curves of ZGGSO:Cr3+ nanoparticles with various Sn4+ concentrations (x = 0, 0.015, 0.030, 0.063 and 0.125) monitored at 697 nm under 575 nm excitation. | ||
Because the energy level position of the 4T2 state is sensitive to the variation in the surroundings of Cr3+ ions (linearly depends on the variation in the crystal field strength), we focus on the effect of Sn4+ substitution on the lifetimes related to the 4T2 → 4A2 emissions of the surface and interior Cr3+. For both the surface and interior Cr3+ ions, it can be found that the lifetimes of Sn4+ doped nanoparticles are shorter than those of the undoped nanoparticles. Usually, the reciprocal of a lifetime (τ) can be expressed using a sum of radiative (WR), nonradiative (WNR) and energy transfer (WET) rates as follows:34,55
| 1/τ = WR + WNR + WET | (3) |
It is known that the WR value depends on the variation in the symmetry of the occupied sites and the WNR value can be tuned by the variations of the particle size and phonon energy of the host after cation substitution. Based on the TEM observations and Raman, emission and absorption spectral analyses, it can be found that Sn4+ substitution leads to little variation in the WR and WNR values. Thus, in our case, the obtained lifetimes can be mainly ascribed to the contribution of the variation in the energy transfer rate after Sn4+ substitution. Since the emission intensity decreases with increasing Sn4+ concentration from Fig. 5b, it can be inferred that Sn4+ substitution gives rise to the increased energy transfer rate and the decreased lifetimes.
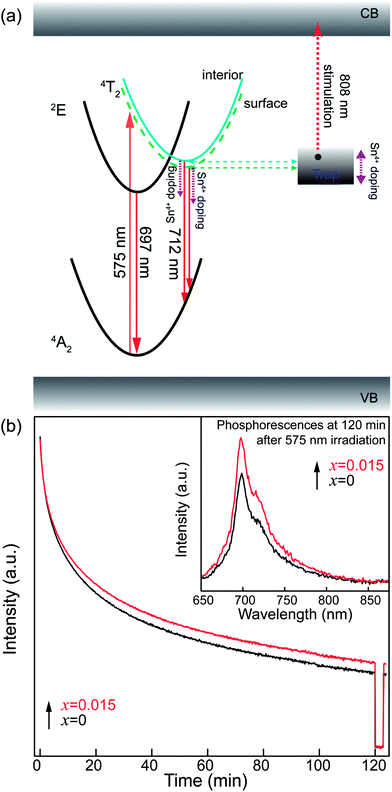
In addition, for both the surface and interior Cr3+ ions in the ZGGSO:Cr3+ nanoparticles with various Sn4+ concentrations, the corresponding lifetimes show an initial decrease and a following rise with increasing Sn4+ concentration. These phenomena might be explained by the variations in the 4T2 level position of Cr3+ and the related trap depths after Sn4+ substitution. A schematic configuration coordinate diagram related to the energy transfer from Cr3+ to the deep traps under the 4A2–4T2 excitation is given in Fig. 10 based on our previous studies.34,40 Here, the deep traps refer to the anti-site pair  , which is close to the distorted Cr3+ ions, and the trap depths can be tuned by varying the distance between the anti-site pair and the distorted Cr3+ ion.40 This distance will decrease with increasing the numbers of anti-site defects and distorted Cr3+ ions.34 Because the numbers of the anti-site defects show an initial rise and a following decrease with increasing Sn4+ concentration, the distances between the anti-site pair and the distorted Cr3+ ions will initially decrease and then increase with increasing Sn4+ concentration. Thus, the variation in the deep trap depth will show a non-monotonic changing behaviour with increasing Sn4+ concentration. Meanwhile, Sn4+ substitution leads to the monotonously increased crystal field strength and the lowered bottom of the 4T2 parabola. It can be deduced that Sn4+ substitution will cause the non-monotonic variations in the energy difference between the 4T2 level and the deep traps related to the anti-site defects. Thus, the energy transfer from Cr3+ to the deep trap and the related lifetimes can be tuned through Sn4+ substitution. In particular, the sample (x = 0.015) with the shortest lifetimes corresponds to that with the strongest afterglow intensity, further indicating that the increased energy transfer from Cr3+ to the deep trap after Sn4+ substitution plays a key role in enhancing the persistent luminescence of the ZGGSO:Cr3+ nanoparticles. To prove the existence of the tunnelling mechanism, the afterglow decay curves of ZGGSO:Cr3+ nanoparticles without and containing Sn4+ (x = 0, 0.015) under 575 nm excitation are shown in Fig. 10b. For both of the samples, the strong persistent luminescence can be detected under visible light excitation. Strikingly, the afterglow intensity of the ZGGSO:Cr3+ containing Sn4+ (x = 0.015) is higher than that without Sn4+. This result further suggests that Sn4+ substitution can enhance the persistent luminescence through controlling the tunnelling process. The detailed explanation is given as follows. For the excited electrons in the 4T2 level upon 575 nm excitation, the tunnelling process will happen in the case that the bottom of the 4T2 parabola is far from the bottom of the conduction band of the host. Fortunately, for Cr3+ doped ZGO or ZGGO, it can be found that the 4T2 level of Cr3+ is ∼1.6–1.8 eV below the bottom of conduction band of the host based on the reported studies.33,34,56 Thus, the observed persistent luminescence of ZGGSO:Cr3+ nanoparticles under 575 nm irradiation may originate from the tunnelling process between the 4T2 and the deep traps.
To confirm the existence of the aforementioned deep traps in the ZGGSO nanoparticles, PSL spectra of ZGGSO:Cr3+ nanoparticles with various Sn4+ concentrations monitored at 697 nm (stimulation wavelength: 808 nm) after the stoppage of 254 nm irradiation for 5 min are shown in Fig. 11. Here, in order to realize high-quality in vivo bioimaging, we employed the 808 nm laser in the PSL measurement. For each of the samples, it can be found that a strong PSL signal superimposes on the afterglow curve when the 808 nm laser is on (the electrons stored in the deep traps are released). In particular, among ZGGSO:Cr3+ nanoparticles with various Sn4+ concentrations, the sample with x = 0.015 shows the strongest NIR luminescence, further proving that Sn4+ substitution can enhance the NIR persistent luminescence via tuning the energy transfer from Cr3+ to the deep traps. Meanwhile, at 30 min after stopping 254 nm irradiation, the PSL intensity is ∼12 times as strong as the afterglow intensity without 808 nm stimulation. This result suggests that the strong NIR luminescence can be acquired using an 808 nm stimulation strategy in the case that the weak NIR afterglow intensity cannot be detected.
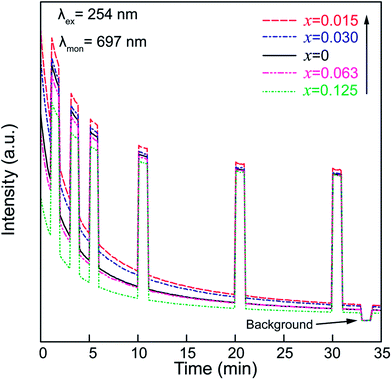 | ||
| Fig. 11 PSL spectra of ZGGSO:Cr3+ nanoparticles with various Sn4+ concentrations monitored at 697 nm (stimulation wavelength: 808 nm) after the stoppage of 254 nm irradiation. | ||
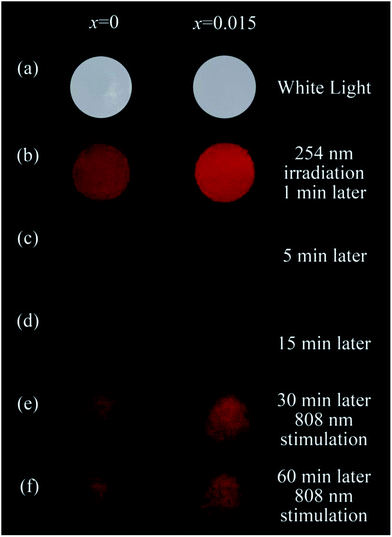
To demonstrate the effects of Sn4+ substitution and 808 nm stimulation on the bioimaging using NIR persistent luminescence nanoparticles, images of two pellets, pressed by the ZGGSO:Cr3+ nanoparticles without Sn4+ (x = 0) and containing Sn4+ (x = 0.015) upon 254 nm irradiation and 808 nm stimulation are shown in Fig. 12. The clear images of the two pellets were recorded using a digital camera under white light illumination, as shown in Fig. 12a. As the two pellets were taken at 1 min after stopping 254 nm irradiation, two red images can be observed, as shown in Fig. 12b. Strikingly, the image of the pellet containing Sn4+ is brighter than that without Sn4+. This result is consistent with the afterglow spectral analysis. While, taken at 15 min or later after stopping 254 nm irradiation, the two red images become less clear, as shown in Fig. 12c and d. To retrace bioimaging in the case that the afterglow intensity is undetectable, the images of the two pellets taken at 30 and 60 min after stopping 254 nm irradiation stimulated by an 808 nm laser are shown in Fig. 12e and f. It can be found that the two clear images, originating from the NIR PSL of ZGGSO:Cr3+ nanoparticles, reappear and the image of the pellet containing Sn4+ is still brighter than that without Sn4+. This result suggests that 808 nm stimulation is an efficient way to retrace the bioimaging using NIR persistent luminescence nanoparticles. In addition, the power density of 808 nm excitation is ∼7.8 mW cm−2, which is much smaller than the critical value of photodamaged skin of human beings (330 mW cm−2). This further can ensure the accuracy and security of in vivo bioimaging using ZGGSO:Cr3+ NIR PLNPs at any time.57,58 Our results suggest that ZGGSO:Cr3+ nanoparticles have potential applications in in vivo bioimaging.
Conclusions
Spinel-phase ZGGSO:Cr3+ nanoparticles with various Sn4+ concentrations were prepared by a hydrothermal method in combination with a post-annealing in vacuum at 800 °C. It can be found that Sn4+ substitution has little influence on their particle sizes and leads to the increased Zn–O, Ga–O and Cr–O bond lengths. For these nanoparticles, the observed near infrared (NIR) persistent luminescence peaked at ∼697 nm originates from the 2E, 4T2 (4F) → 4A2 transitions of Cr3+ and the afterglow time exceeds 800 min. For both the interior and surface Cr3+ ions in the ZGGSO host, it can be found that the increased energy transfer from Cr3+ to the deep trap (anti-site defects, ) after the substitution of Ge4+ by Sn4+ plays a key role in enhancing the persistent luminescence of the ZGGSO:Cr3+ nanoparticles. It can be found that this energy transfer process can be controlled through the variations in the crystal field strength and the trap depths. Strikingly, our results suggest that not only Sn4+ substitution can improve in vivo bioimaging but also the existence of deep traps in ZGGSO:Cr3+ nanoparticles is helpful for retracing in vivo bioimaging at any time.
Conflicts of interest
There are no conflicts to declare.Acknowledgements
This work was supported by the National Natural Science Foundation of China (no. 11674050, 11374047 & 11604044).Notes and references
- N. Basavaraju, K. R. Priolkar, A. Bessière, S. K. Sharma, D. Gourier, L. Binet, B. Viana and S. Emura, Phys. Chem. Chem. Phys., 2017, 19, 1369–1377 RSC.
- T. Maldiney, A. Bessière, J. Seguin, E. Teston, S. K. Sharma, B. Viana, A. J. Bos, P. Dorenbos, M. Bessodes and D. Gourier, Nat. Mater., 2014, 13, 418 CrossRef CAS PubMed.
- S. Kidd, E. Spaeth, J. L. Dembinski, M. Dietrich, K. Watson, A. Klopp, V. L. Battula, M. Weil, M. Andreeff and F. C. Marini, J. Stem Cells, 2009, 27, 2614–2623 CrossRef CAS PubMed.
- D. W. Bartlett, H. Su, I. J. Hildebrandt, W. A. Weber and M. E. Davis, Proc. Natl. Acad. Sci. U. S. A., 2007, 104, 15549–15554 CrossRef CAS PubMed.
- M.-K. So, C. Xu, A. M. Loening, S. S. Gambhir and J. Rao, Nat. Biotechnol., 2006, 24, 339 CrossRef CAS PubMed.
- A. Sato, B. Klaunberg and R. Tolwani, Comp. Med., 2004, 54, 631–634 CAS.
- B. W. Rice, M. D. Cable and M. B. Nelson, J. Biomed. Opt., 2001, 6, 432–440 CrossRef CAS PubMed.
- J. Wang, J. Ye, H. Jiang, S. Gao, W. Ge, Y. Chen, C. Liu, C. Amatore and X. Wang, RSC Adv., 2014, 4, 37790–37795 RSC.
- C. Rosticher, B. Viana, M. A. Fortin, J. Lagueux, L. Faucher and C. Chaneac, RSC Adv., 2016, 6, 55472–55478 RSC.
- A. Mondal, S. Das and J. Manam, RSC Adv., 2016, 6, 82484–82495 RSC.
- E. Teston, Y. Lalatonne, D. Elgrabli, G. Autret, L. Motte, F. Gazeau, D. Scherman, O. Clément, C. Richard and T. Maldiney, Small, 2015, 11, 2696–2704 CrossRef CAS PubMed.
- Z. Li, Y. Zhang, X. Wu, L. Huang, D. Li, W. Fan and G. Han, J. Am. Chem. Soc., 2015, 137, 5304–5307 CrossRef CAS PubMed.
- Y.-C. Lu, C.-X. Yang and X.-P. Yan, Nanoscale, 2015, 7, 17929–17937 RSC.
- Y. Li, Y. Li, R. Chen, K. Sharafudeen, S. Zhou, M. Gecevicius, H. Wang, G. Dong, Y. Wu and X. Qin, NPG Asia Mater., 2015, 7, e180 CrossRef.
- S. Singh, RSC Adv., 2014, 4, 58674–58698 RSC.
- T. Maldiney, A. Lecointre, B. Viana, A. l. Bessieère, M. Bessodes, D. Gourier, C. Richard and D. Scherman, J. Am. Chem. Soc., 2011, 133, 11810–11815 CrossRef CAS PubMed.
- Q. l. M. de Chermont, C. Chanéac, J. Seguin, F. Pellé, S. Maîtrejean, J.-P. Jolivet, D. Gourier, M. Bessodes and D. Scherman, Proc. Natl. Acad. Sci. U. S. A., 2007, 104, 9266–9271 CrossRef PubMed.
- W. Chen and J. Zhang, J. Nanosci. Nanotechnol., 2006, 6, 1159–1166 CrossRef CAS PubMed.
- R. Zhong, J. Zhang, X. Zhang, S. Lu and X.-j. Wang, Appl. Phys. Lett., 2006, 88, 201916 CrossRef.
- Y. Jin, Y. Hu, L. Yuan, L. Chen, H. Wu, G. Ju, H. Duan and Z. Mu, J. Mater. Chem. C, 2016, 4, 6614–6625 RSC.
- M. Back, E. Trave, J. Ueda and S. Tanabe, Chem. Mater., 2016, 28, 8347–8356 CrossRef CAS.
- D. Chen, Y. Zhou, W. Xu, J. Zhong and P. Huang, J. Mater. Chem. C, 2016, 4, 11457–11464 RSC.
- N. Basavaraju, K. R. Priolkar, D. Gourier, S. K. Sharma, A. Bessière and B. Viana, Phys. Chem. Chem. Phys., 2015, 17, 1790–1799 RSC.
- R. Zhong, J. Zhang, X. Zhang, S. Lu and X.-j. Wang, Appl. Phys. Lett., 2006, 88, 201916 CrossRef.
- C. Walsh, J. Donegan, T. Glynn, G. Morgan, G. Imbusch and J. Remeika, J. Lumin., 1988, 40, 103–104 CrossRef.
- W. Mikenda and A. Preisinger, J. Lumin., 1981, 26, 67–83 CrossRef CAS.
- W. Mikenda and A. Preisinger, J. Lumin., 1981, 26, 53–66 CrossRef CAS.
- M. Reynolds, W. Hagston and G. Garlick, Phys. Status Solidi, 1968, 30, 113–117 CrossRef CAS.
- L. Li, Y. Wang, H. Huang, H. Li and H. Zhao, Mod. Phys. Lett. B, 2016, 30, 1650019 CrossRef CAS.
- A. l. Bessieère, S. K. Sharma, N. Basavaraju, K. R. Priolkar, L. Binet, B. Viana, A. J. Bos, T. Maldiney, C. Richard and D. Scherman, Chem. Mater., 2014, 26, 1365–1373 CrossRef.
- A. Bessière, S. Jacquart, K. Priolkar, A. Lecointre, B. Viana and D. Gourier, Opt. Express, 2011, 19, 10131–10137 CrossRef PubMed.
- F. Liu, Y. Chen, Y. Liang and Z. Pan, Opt. Lett., 2016, 41, 954–957 CrossRef PubMed.
- Z. Pan, Y.-Y. Lu and F. Liu, Nat. Mater., 2012, 11, 58 CrossRef CAS PubMed.
- Z. Gong, Y. Liu, J. Yang, D. Yan, H. Zhu, C. Liu, C. Xu and H. Zhang, Phys. Chem. Chem. Phys., 2017, 19, 24513 RSC.
- N. Basavaraju, K. R. Priolkar, A. Bessière, S. K. Sharma, D. Gourier, L. Binet, B. Viana and S. Emura, Phys. Chem. Chem. Phys., 2017, 19, 1369–1377 RSC.
- A. De Vos, K. Lejaeghere, D. E. P. Vanpoucke, J. J. Joos, P. F. Smet and K. Hemelsoet, Inorg. Chem., 2016, 55, 2402–2412 CrossRef CAS PubMed.
- N. Basavaraju, K. R. Priolkar, D. Gourier, A. Bessière and B. Viana, Phys. Chem. Chem. Phys., 2015, 17, 10993–10999 RSC.
- M. Allix, S. Chenu, E. Véron, T. Poumeyrol, E. A. Kouadri-Boudjelthia, S. Alahraché, F. Porcher, D. Massiot and F. Fayon, Chem. Mater., 2013, 25, 1600–1606 CrossRef CAS.
- D. Chen, Z. Wan, Y. Zhou and Z. Ji, J. Eur. Ceram. Soc., 2015, 35, 4211–4216 CrossRef CAS.
- J. Yang, Y. Liu, D. Yan, H. Zhu, C. Liu, C. Xu, L. Ma and X. Wang, Dalton Trans., 2016, 45, 1364–1372 RSC.
- G. G. P. Van Gorkom, J. H. Haanstra and H. v. d. Boom, J. Raman Spectrosc., 1973, 1, 513–519 CrossRef CAS.
- G. Van Gorkom and J. Haanstra, J. Raman Spectrosc., 1973, 1, 513–519 CrossRef CAS.
- Y. Hemberger, N. Wichtner, C. Berthold and K. G. Nickel, Int. J. Appl. Ceram. Technol., 2016, 13, 116–124 CrossRef CAS.
- D. Gourier, A. Bessière, S. K. Sharma, L. Binet, B. Viana, N. Basavaraju and K. R. Priolkar, J. Phys. Chem. Solids, 2014, 75, 826–837 CrossRef CAS.
- D. Chen, Z. Wan and Y. Zhou, Opt. Lett., 2015, 40, 3607–3610 CrossRef CAS PubMed.
- D. Chen, Y. Chen, H. Lu and Z. Ji, Inorg. Chem., 2014, 53, 8638–8645 CrossRef CAS PubMed.
- F. Castelli and L. S. Forster, Phys. Rev. B, 1975, 11, 920 CrossRef CAS.
- D. Chen, X. Chen, X. Li, H. Guo, S. Liu and X. Li, Opt. Lett., 2017, 42, 4950–4953 CrossRef PubMed.
- M. Hermus, P.-C. Phan, A. C. Duke and J. Brgoch, Chem. Mater., 2017, 29, 5267–5275 CrossRef CAS.
- R. Zou, S. Gong, J. Shi, J. Jiao, K.-L. Wong, H. Zhang, J. Wang and Q. Su, Chem. Mater., 2017, 29, 3938–3946 CrossRef CAS.
- V. B. R. Boppana and R. F. Lobo, ACS Catal., 2011, 1, 923–928 CrossRef CAS.
- Y. Li, S. Zhou, Y. Li, K. Sharafudeen, Z. Ma, G. Dong, M. Peng and J. Qiu, J. Mater. Chem. C, 2014, 2, 2657–2663 RSC.
- A. Ambast and S. Sharma, Opt. Quantum Electron., 2017, 49, 58 CrossRef.
- J. T. Titantah and D. Lamoen, Diamond Relat. Mater., 2007, 16, 581–588 CrossRef CAS.
- M. Zhang, Y. Liu, H. Zhu, D. Yan, J. Yang, X. Zhang, C. Liu and C. Xu, Phys. Chem. Chem. Phys., 2016, 18, 18697–18704 RSC.
- Y.-J. Li and X.-P. Yan, Nanoscale, 2016, 8, 14965–14970 RSC.
- P. Vijayaraghavan, C.-H. Liu, R. Vankayala, C.-S. Chiang and K. C. Hwang, Adv. Mater., 2014, 26, 6689–6695 CrossRef CAS PubMed.
- Q. Tian, M. Tang, Y. Sun, R. Zou, Z. Chen, M. Zhu, S. Yang, J. Wang, J. Wang and J. Hu, Adv. Mater., 2011, 23, 3542–3547 CrossRef CAS PubMed.
| This journal is © The Royal Society of Chemistry 2018 |

