 Open Access Article
Creative Commons Attribution 3.0 Unported Licence
Chemical activation of prolyl hydroxylase-2 by BBAP-1 down regulates hypoxia inducible factor-1α and fatty acid synthase for mammary gland chemoprevention†
Manjari Singh‡
a,
Uma Devi‡b,
Subhadeep Roya,
Pushpraj S. Guptaa and
Gaurav Kaithwas *a
*a
aDepartment of Pharmaceutical Sciences, Babasaheb Bhimrao Ambedkar University (A Central University), Vidya Vihar, Raebareli Road, Lucknow-226025, UP, India. E-mail: gauravpharm@hotmail.com; gauravk@bbau.ac.in; Tel: +91 9670204349
bDepartment of Pharmaceutical Sciences, Faculty of Health and Medical Sciences, Sam Higginbottom University of Agricultural Sciences and Technology, Naini, Allahabad, UP, India
First published on 4th April 2018
Abstract
(4-[7-(Acetyloxy)-2-ethyl-2H-chromen-3-yl] phenyl acetate) (BBAP-1) was identified as a potential prolyl hydroxylase-2 activator and tested for this activity using the 2-oxoglutarate dependent in vitro assay. BBAP-1 was evaluated for its cytotoxic potential against ER + MCF-7 cells, and N-methyl-N-nitrosourea induced estrogen positive mammary gland carcinoma model. The effect of BBAP-1 on cellular morphology was evaluated using in vitro acridine orange/ethidium bromide and JC-1 staining. The morphological symptoms of apoptosis were evident after BBAP-1 treatment when studied through cell staining using acridine orange/ethidium bromide and JC-1 dye. Flow cytometric analysis revealed that BBAP-1 treatment arrested the cell cycle in the G2/M phase. In vivo study revealed the morphological changes of mammary gland tissue when scrutinized using carmine staining, hematoxylin and eosin staining and scanning electron microscopy. BBAP-1 treatment produced a marked effect on histopathological and morphological features when scrutinized against N-methyl-N-nitrosourea induced mammary gland carcinoma. Treatment with BBAP-1 also attenuated the deleterious effects of N-methyl-N-nitrosourea as measured on the basis of oxidative stress markers. Immunoblotting and qRT-PCR analysis revealed the participation of BBAP-1 in the mitochondrial mediated death apoptosis pathway and BBAP-1 also downregulated the hypoxic pathway through activation of prolyl hydroxylase-2. It was concluded that BBAP-1 activated the prolyl hydroxylase-2 enzyme and curtailed the over expression of hypoxia inducible factor-1α and fatty acid synthase along with the mitochondrial mediated death apoptosis pathway.
Introduction
Tumor hypoxia is a condition where solid tumors have insufficient oxygen supply, leading to an imbalance in their consumption of oxygen. Thus, hypoxia alters the cellular energy production mechanism, with the anaerobic mode prevailing over aerobic respiration.1 In the hypoxic state, an imbalance is developed between the supply and consumption of oxygen.2,3 Importantly, hypoxia distress in cancer cells leads to an alteration in their metabolite signaling, consequently promoting glycolysis and lipid biogenesis (Warburg effect) over the tri-carboxylic acid (TCA) cycle and beta-oxidation.4The hypoxic microenvironment triggers hypoxic signaling pathways in which hypoxia inducible factor (HIF) is the most clearly understood transcription factor.5 The structure of HIF is a basic helix-loop-helix PAS (Per, Arnt, Sim) domain, which consists of two subunits HIF-1α and HIF-1β.6 HIF-1α is found to be overexpressed in all types of cancer and enables tumor cells to grow under hypoxic conditions.7 It would be appropriate to note that increased glycolysis and lipogenic activity is one of the major methods by which the tumor cells meet their high energy and lipid requirements.8 In addition to the above, HIF-1α regulates the process of angiogenesis through binding with vascular endothelial growth factor (VEGF).9
During normoxia, HIF-1α goes through proteasomal degradation, which is regulated by prolyl hydroxylases (PHDs), followed by binding with von Hippel–Lindau (pVHL) suppresser protein.10 PHDs include the iron and 2-oxoglutarate (2-OG) dependent dioxygenase and are responsible for the hydroxylation of HIF-1α.11 In mammals, three isoforms of PHDs (PHD-1, PHD-2, and PHD-3) exist, each having different sub cellular localization, and PHD-2 is the most important protein in regulating HIF-1α.12 However, during hypoxia, PHD-2 remains dormant and HIF-1α escapes proteasomal degradation. Subsequently, HIF-1α translocates into the nucleus and forms a complex with HIF-1β which binds with hypoxia-responsive elements. Altogether, HIF-1α and PHD-2 regulate the process of energy production, angiogenesis and cellular proliferation in cancer cells.13
The association between PHD-2 deficiency and metastasis in pancreatic tumor cells has been reported earlier, which further strengthens its role in tumor progression.14 It was previously hypothesized that the chemical activation of PHD-2 can down-regulate the overexpressed level of HIF-1α and fatty acid synthase (FASN) in tumor cells.15,16 In fact, previous preliminary reports also suggested three activators of PHD-2, named KRH102053, KRH102140 and R59949, with anticancer potential.17–19 In consideration of the above and in search of potential activators of PHD-2 with anticancer activity, we considered it worth screening structural analogs of PHD-2 and validating their anticancer efficacy through in vitro and in vivo studies.
Materials and methods
Drugs and chemicals
4-[7-(Acetyloxy)-2-ethyl-2H-chromen-3-yl] phenyl acetate (BBAP-1) was received as a generous gift from National Cancer Institute, National Institutes of Health, USA (export reference: SL#201500077, job number-0348). Other materials included RPMI 1640 medium (Gibco-11875093); L-glutamine (Gibco-25030081); fetal bovine serum (FBS) (Gibco-10270); trypsin (Gibco-R001100); eagle's balanced salt solution (EBSS) (Gibco-2018-11); hank's balanced salt solution (HBSS) (Himedia-TL1190); ethidium bromide (EtBr) (Himedia-MB071-1G); acridine orange (AO) (Himedia-MB116-10G); propidium iodide (PI) (SC-3541); JC-1 assay kit (Thermo Scientific M34152); tamoxifen citrate (Biochem Pharmaceuticals); penicillin-streptomycin (Thermo Scientific, 15410-163); gentamycin (Thermo Scientific, 15710-049); 3-(4,5-dimethyl-2-thiazolyl)-2,5-diphenyl-2H-tetrazolium bromide (MTT) (TC191-1G); RNase (SRL, 9001-99-4); dimethyl sulfoxide (DMSO) (Merck, 1.16743.0521); ponceau S (Himedia-ML045); sodium cacodylate (Sigma-Aldrich, C0250); collagenase type IV (TC214); hyaluronidase (TC331); hematoxylin (Himedia-S058); eosin (Himedia-S007); RIPA lysis buffer (Amresco, N653); protein assay kit (Amresco, M173); bovine serum albumin (BSA) (Genetix, PG-2330); transfer buffer (Genetix, GX-9411AR); N-methyl-N-nitrosourea (MNU) (Sigma-Aldrich, N1517). Caspase 3 (SC-4263) and caspase 8 (SC-4267) assay kits were procured from Santa Cruz Biotechnology Inc., California. All other chemicals were of molecular grade and purchased from Genetix Biotech Asia Pvt. Ltd., New Delhi, India unless otherwise stated within the text.Screening of compounds
The compounds were screened based on 50% structural similarity with the previously reported PHD-2 activator KRH102140![[thin space (1/6-em)]](https://www.rsc.org/images/entities/char_2009.gif) 18 from the zinc database. The compounds were screened for their drug likeness (ADME, Lipinski, MDDR and CMC) using the DruLiTo tool.20
18 from the zinc database. The compounds were screened for their drug likeness (ADME, Lipinski, MDDR and CMC) using the DruLiTo tool.20
C-DRUG web server
Approximately 5055 compounds were retrieved from the structural similarity and drug likeness search. The compounds were further screened for the possibility of anticancer activity, using the C-DRUG web server. The C-DRUG server predicts the anticancer potential of a compound in silico by using the molecular description method (relative frequency–weight fingerprint). The results are represented by a set of variables, including query compound(s), matched compound(s), average GI50 value of the matched compound(s), maximum H-score and P-value. C-DRUG categorizes the results as most promising (green), possible (black), and less likely (gray) molecules depending on the P-value. C-DRUG screening retrieved BBAP-1 as a highly possible anti-cancer compound.21Docking and toxicity study
The highly possible anti-cancer compound BBAP-1 obtained through the C-DRUG server was docked with the PHD-2 enzyme (PDB id-2G19) using Autodock 4.2.22 The toxicity profile was estimated through the toxicity estimation software tool (TEST).23 TEST is a simple QSAR modeling tool to calculate the toxicity of test molecules.24Metabolic profiling of BBAP-1
The metabolic profile of BBAP-1 was evaluated using Metaprint2D,25 licensed under the Apache license, 2.0. BBAP-1 was further screened for the type of isoform of CYP450 involved in its metabolism using the WhichCyp web server.26In vitro PHD-2 assay
Serum samples were collected from control animals, pooled and homogenized with five volumes of 0.25 M sucrose containing HEPES buffer (50 mM, pH 7.0). The homogenizing medium also contained PMSF as an anti-proteolytic agent (50 μg ml−1), 10−4 M dithiothreitol (DTT), 10−5 M EDTA and 0.1% Triton X-100. Homogenates were centrifuged at 14![[thin space (1/6-em)]](https://www.rsc.org/images/entities/char_2009.gif) 000 rpm for 10 min and supernatants were collected. To 100 μl of the supernatant, 990 μl of PHD-2 activation buffer [sodium ascorbate (1 mM); proline (1 mM); BSA (0.2%); catalase (0.04%); α-ketoglutarate (0.1 mM)] was added and incubated at 30 °C for 3 h. After incubation, 100 μl HCl (0.5 M) was added to stop the reaction, followed by 50 μl of o-phenylenediamine (OPD) (10 mg ml−1 prepared in 0.5 M HCl). The reaction mixture was heated at 95 °C for 10 min followed by centrifugation at 10
000 rpm for 10 min and supernatants were collected. To 100 μl of the supernatant, 990 μl of PHD-2 activation buffer [sodium ascorbate (1 mM); proline (1 mM); BSA (0.2%); catalase (0.04%); α-ketoglutarate (0.1 mM)] was added and incubated at 30 °C for 3 h. After incubation, 100 μl HCl (0.5 M) was added to stop the reaction, followed by 50 μl of o-phenylenediamine (OPD) (10 mg ml−1 prepared in 0.5 M HCl). The reaction mixture was heated at 95 °C for 10 min followed by centrifugation at 10![[thin space (1/6-em)]](https://www.rsc.org/images/entities/char_2009.gif) 000 rpm for 5 min to collect the supernatant. To 100 μl of the supernatant, 60 μl of 1.2 M sodium hydroxide was added and fluorescence was read at 340 nm excitation, 420 nm emission wavelengths. The assay was divided among three groups: control (serum); inhibitor [serum + cobalt (inhibitor)]; activator [serum + BBAP-1 (activator)]. The relative PHD-2 activities of the cobalt and BBAP-1 were calculated by considering the activity in the control samples as 100%.27,28
000 rpm for 5 min to collect the supernatant. To 100 μl of the supernatant, 60 μl of 1.2 M sodium hydroxide was added and fluorescence was read at 340 nm excitation, 420 nm emission wavelengths. The assay was divided among three groups: control (serum); inhibitor [serum + cobalt (inhibitor)]; activator [serum + BBAP-1 (activator)]. The relative PHD-2 activities of the cobalt and BBAP-1 were calculated by considering the activity in the control samples as 100%.27,28
Cell culture
ER + MCF-7 cells were cultured and routinely maintained in RPMI 1640 medium supplemented with 10% heat-inactivated FBS, penicillin (100 units per ml), streptomycin (100 μg ml−1), and gentamycin (0.25 μg ml−1) and incubated at 37 °C in a humidified atmosphere containing 5% CO2 inside a CO2 incubator. The cells were counted using a trypan blue exclusion method in hemocytometer.29Cell viability assay
ER + MCF-7 cells (1 × 10⁵) were seeded in 96-well sterile plates and treated with different concentrations of BBAP-1 (1 μM, 5 μM, 10 μM, 15 μM, 20 μM, 25 μM) for 24 h against control and standard drug (tamoxifen). After 24 h of incubation at 37 °C in an atmosphere of 5% CO2 and 95% humidity, the apical and basolateral media were pooled on a 24-well plate and the cell viability was estimated by MTT assay through measuring the emitted fluorescence with a spectrofluorometric multi plate reader (excitation-555 nm, emission-585 nm). The percentage of cell viability for each sample was calculated compared to non-exposed cells (corresponding to 100% viability).30Fluorescence microscopic analysis of cell death using AO/EtBr dual staining
AO/EtBr dual staining was performed to identify the morphological symptoms of apoptosis in ER + MCF-7 cells. After 24 h cell attachment, the cells were treated with the IC50 dose of BBAP-1 for the duration of 1 day. The cells were washed with phosphate buffered saline (PBS) (pH 7.4) and fixed for 15 min at room temperature in the dark with a BD cytofix/cytoperm assay kit. After that, the samples were processed with 10 μl of AO/EtBr cocktail (100 μg ml−1 of AO and 100 μg ml−1 of EtBr) and made up to 100 μl using PBS and incubated for 5 min. The cells were later washed with PBS and treated with background suppressor for the respective green and red channels to decrease the signal-to-noise ratio and non-specific labeling, then air dried and examined under an inverted fluorescence microscope with gold anti-fade mountant in coverslips (Nikon Leica M165 FC).31Measurement of mitochondrial membrane potential (Δψ) using JC-1 staining
JC-1 is a cationic potential-dependent J-aggregate forming dye used to determine the loss of mitochondrial membrane potential (indicative of apoptosis). For the experimental schedule, ER + MCF-7 cells were seeded at a density of 2 × 10⁵ cells per well in a 75 cm2 culture flask and incubated overnight for cellular attachment. The cells were then treated with the IC50 dose of BBAP-1. The untreated control cells were included. After 24 h, 100 μl of JC-1 staining solution (1![[thin space (1/6-em)]](https://www.rsc.org/images/entities/char_2009.gif) :
:![[thin space (1/6-em)]](https://www.rsc.org/images/entities/char_2009.gif) 10 dilution) was added into each 1 ml of complete RPMI 1640 medium in a 6-well multiplate and incubated for 15 min at 37 °C in a CO2 incubator. The cells were later washed with PBS three times and treated with background suppressor for the red channel. Transition of fluorescence (red to green) under different experimental conditions was observed in the TRITC channel under an inverted fluorescence microscope (Nikon Leica M165 FC).32
10 dilution) was added into each 1 ml of complete RPMI 1640 medium in a 6-well multiplate and incubated for 15 min at 37 °C in a CO2 incubator. The cells were later washed with PBS three times and treated with background suppressor for the red channel. Transition of fluorescence (red to green) under different experimental conditions was observed in the TRITC channel under an inverted fluorescence microscope (Nikon Leica M165 FC).32
Flow cytometry analysis of cell cycle and apoptosis using PI staining
The ER + MCF-7 cells were seeded in 6-well plates at a density of 2 × 10⁵ cells per well. Then, the cells were treated with the IC50 dose of BBAP-1. After 24 h, the cells were trypsinized, washed with PBS and collected. The resulting pellet was fixed in ice chilled methanol and stored at −20 °C for 5 min. The fixed cells were washed with PBS and treated with RNase (add 50 μl of a 100 μg ml−1 sock of RNase) which ensure RNA free positive DNA solution and Triton-X (0.1%) and then stained with 200 μl PI (from 50 μg ml−1 stock solution). followed by 15 min dark incubation. The cell cycle phase distribution of nuclear DNA was determined by adjusting forward scatter (FS) and side scatter (SS) to identify single cells and pulse processing is used to exclude cell doublets from the analysis. A fluorescence activated cell sorter (FACS), using a fluorescence detector equipped with a 488 nm argon laser light source and 623 nm bandpass filter (linear scale) using BD FACS software 1.2.0.87 (BD Influx cell sorter, USA) with a suitable bandpass filter.33In vivo study
Female albino Wistar rats (100–120 g) were procured from the central animal house facility and acclimatized for a period of two weeks prior to the experiment. Animals were housed in polypropylene cages under controlled conditions (23 °C, 12 h light/dark cycle) with free access to standard pellet diet and water ad libitum. Animals were randomized and divided among four groups of eight animals each. Group I, served as normal control, received 0.9% normal saline 1 ml kg−1, p.o.; group II, served as toxic control, received MNU 8 mg kg−1, i.v.; group III and group IV, the drug treated groups, received BBAP-1 (61.55 μg kg−1, s.c.) + MNU (8 mg kg−1, i.v.) and BBAP-1 (123.11 μg kg−1, s.c.) + MNU (8 mg kg−1, i.v.) respectively. The animal dose of BBAP-1 was calculated using the IC50 dose of BBAP-1 and tamoxifen.34 The IC50 and rat dose of tamoxifen was taken as 27 μM and 200 μg per rat per day respectively, as reported in previous literature.35 Toxicity was induced by single tail vein injection of MNU on the 1st and 21st day followed by daily administration of BBAP-1 up to the 38th day of the study. All the animal experiments were performed in compliance with CPCSEA guidelines for laboratory animals and ethics, Department of Animal Welfare, Government of India. Ethical approval for the use of animals was received from Sam Higginbottom University of Agricultural Sciences and Technology, Naini, Allahabad (IAEC/SHIATS/PA16III/SUDPG01).Morphological evaluation of mammary gland tissue
Biochemical evaluation
The mammary gland tissues (10% w/v) were homogenized in 0.15 M KCl and centrifuged at 10![[thin space (1/6-em)]](https://www.rsc.org/images/entities/char_2009.gif) 000 rpm. The supernatants were scrutinized for various antioxidant markers including thiobarbituric acid reactive substances (TBARs), superoxide dismutase (SOD), catalase, glutathione (GSH) and protein carbonyl (PC) using the method established at our laboratory.40
000 rpm. The supernatants were scrutinized for various antioxidant markers including thiobarbituric acid reactive substances (TBARs), superoxide dismutase (SOD), catalase, glutathione (GSH) and protein carbonyl (PC) using the method established at our laboratory.40
Evaluation of caspase 3 and caspase 8
The activity of caspase 3 and caspase 8 was evaluated using the commercial kits. The DEVD-AFC and IETD-AFC synthetic substrates were used for the estimation of caspase 3 and caspase 8 respectively. Equal volumes of serum sample from control, toxic and drug treated groups were diluted with reaction buffer and DTT was added to a final concentration of 10 mM. To the reaction mixture 5 μl of IETD-AFC/DEVD-AFC substrate was added and incubated for 1 h at 37 °C. Free AFC levels formed were measured with the plate reader at 400 nm excitation and 505 nm emission. The results of experimental samples were compared with the control and expressed as fluorescence units per mg of protein.41Western blotting
Protein samples were prepared from the mammary gland tissue through acetone precipitation and quantified using the Bradford reagent.42 The immunoblotting analysis of Bcl-xl (MA-5-15142), Bcl-2 (SC-7382), BAX (SC-23959), VDAC (SC-390996), cytochrome c (SC-13561), Apaf-1 (SC-65891), procaspase 9 (SC-73548), NFκBp65 (MA5-1616), UCHL-1 (MA1-83428), PHD-2 (SC-67030), HIF-1α (SC-13515), FASN (SC-55580) and SREBP-1c (SC-13551) was performed according to the method elaborated elsewhere.43 β-actin (MA5-15739-HRP) was used as a standard reference. The membrane was washed with TBST thrice and incubated with the corresponding anti-rabbit (SC-2030), anti-goat (SC-2020) and anti-mouse (31430, Pierce Thermo Scientific, USA) HRP conjugated secondary antibody (1![[thin space (1/6-em)]](https://www.rsc.org/images/entities/char_2009.gif) :
:![[thin space (1/6-em)]](https://www.rsc.org/images/entities/char_2009.gif) 5000 dilutions) at room temperature for 3 h.
5000 dilutions) at room temperature for 3 h.
qRT-PCR
The fold change analysis of various genes was performed according to the method elaborated by us previously.32 The specific sequences of the forward and reverse primers are specified in Table S1.†Statistical analysis
All data were presented as mean ± SD and analyzed by one-way ANOVA followed by Bonferroni test for identification of the possible significance between various groups. *p < 0.05, **p < 0.01, ***p < 0.001 were considered as statistically significant. Statistical analysis was performed using Graph Pad Prism software (5.02).Results
BBAP-1 inhibits in vitro PDH-2 activity
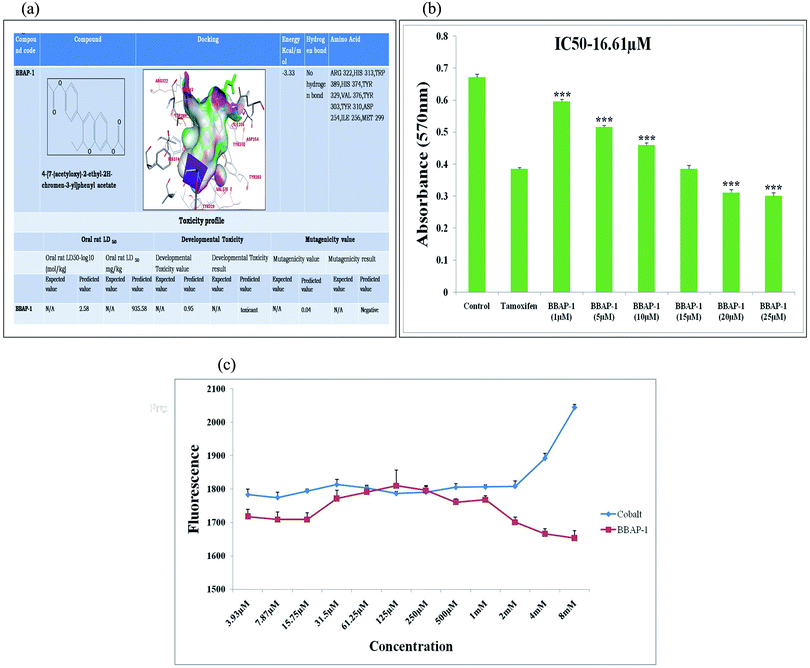 | ||
| Fig. 1 (A) In silico binding efficacy and toxicity profiling of BBAP-1: BBAP-1 was docked with PHD-2 protein (PDB id-2G19). Toxicity profile of BBAP-1 was estimated with TEST. (B) Effect of BBAP-1 upon MTT assay: the histogram revealed the effect of BBAP-1 on ER + MCF-7 cells by MTT assay. The cell growth was compared with the standard (tamoxifen). BBAP-1 displayed substantial cytotoxicity against ER + MCF-7 cells. Data is expressed as mean ± SD. The comparisons are made on the basis of one-way ANOVA followed by Bonferroni multiple test. *p < 0.05, **p < 0.01, ***p < 0.001 is considered statistically significant. Experiment was performed in triplicate. (C) Effect of BBAP-1 and cobalt upon in vitro PHD-2 activity: BBAP-1 demonstrates the in vitro activation of PHD-2. Cobalt was used as a negative control. The results are represented using control value as 100% PHD-2 activity. Values are represented as mean ± SD. Experiment was performed in triplicate. | ||
The metabolic positions of BBAP-1 were studied using the in silico tool Metaprint 2D which revealed that the 11th, 12th, 21st and 22nd carbon positions were major sites for metabolism through 12- and 22-dealkylation and 11- and 21-ester hydrolysis. CYP3A4 and CYP2D6 were the major cytochrome P450 enzymes involved in the metabolism of BBAP-1 when scrutinized through the WhichCyp web server (Fig. S1†).
Anti-proliferative effect of BBAP-1 upon cellular parameters
Effect of BBAP-1 upon tissue morphology in albino Wistar rats
Effect of BBAP-1 upon antioxidant parameters
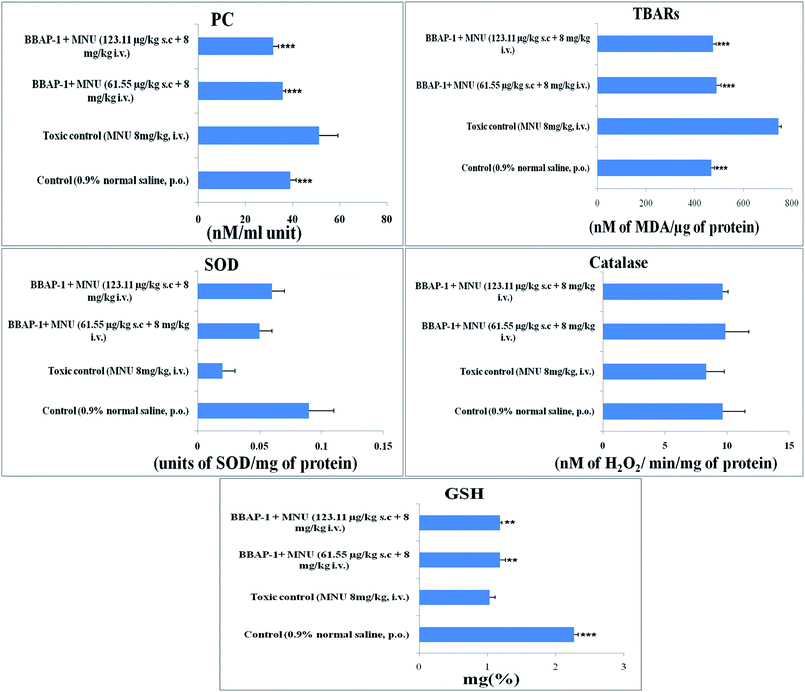
Cancerous tissues generate oxidative stress and this was measured using antioxidant parameters including TBARs, SOD, catalase, GSH and PC. MNU treatment was found to increase the peroxidation products of lipids and protein, as apparent through the increased levels of TBARs (743.59 ± 11.91 nM of MDA per μg of protein) and PC (51.29 ± 7.95 nM ml−1 unit) in comparison to the control. BBAP-1 treatment diminished the deleterious effects of MNU. The biological levels of enzymatic antioxidant defense of GSH, SOD and catalase were diminished after the MNU treatment and were recorded as 1.03 ± 0.08 mg%, 0.02 ± 0.002 units of SOD per mg of protein and 8.33 ± 1.45 nM of H2O2 per min per mg of protein respectively. In line with the peroxidative markers, BBAP-1 treatment helped to reinstate the enzymatic antioxidant defense towards the level of the control (Fig. 5).Evaluation of serum caspase 3 and caspase 8 level
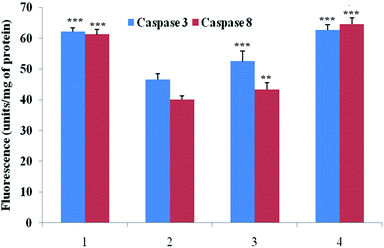
Caspase is an important marker for cell apoptosis and was evaluated using commercial serum based kits. The caspase 3 and caspase 8 levels were substantially down-regulated after the MNU administration, and BBAP-1 treatment helped to restore the levels of caspase 3 and caspase 8 towards the control (Fig. 6).Effect of BBAP-1 upon quantitative immunoblotting analysis
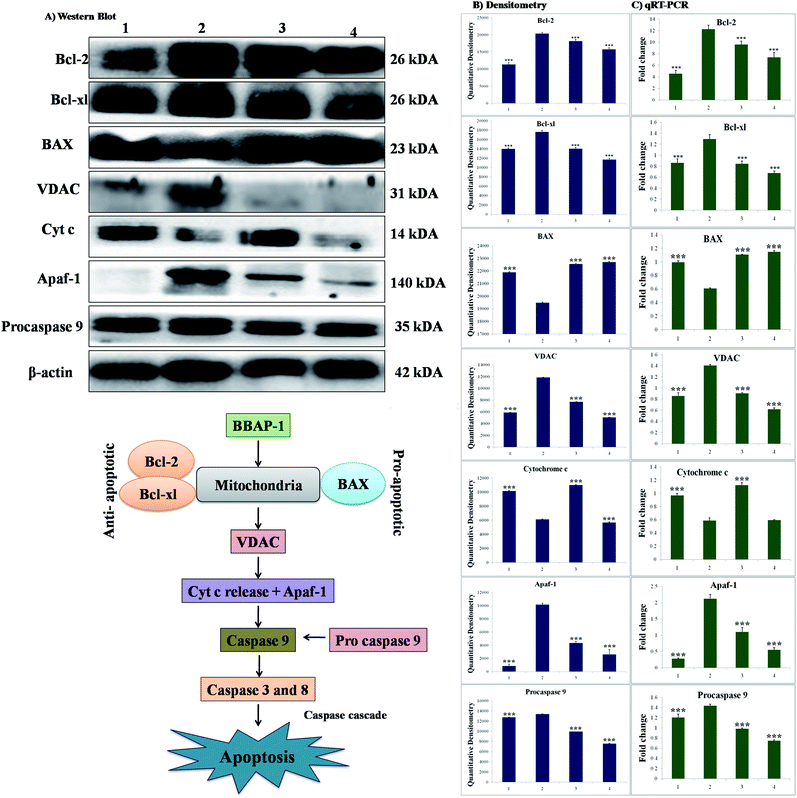
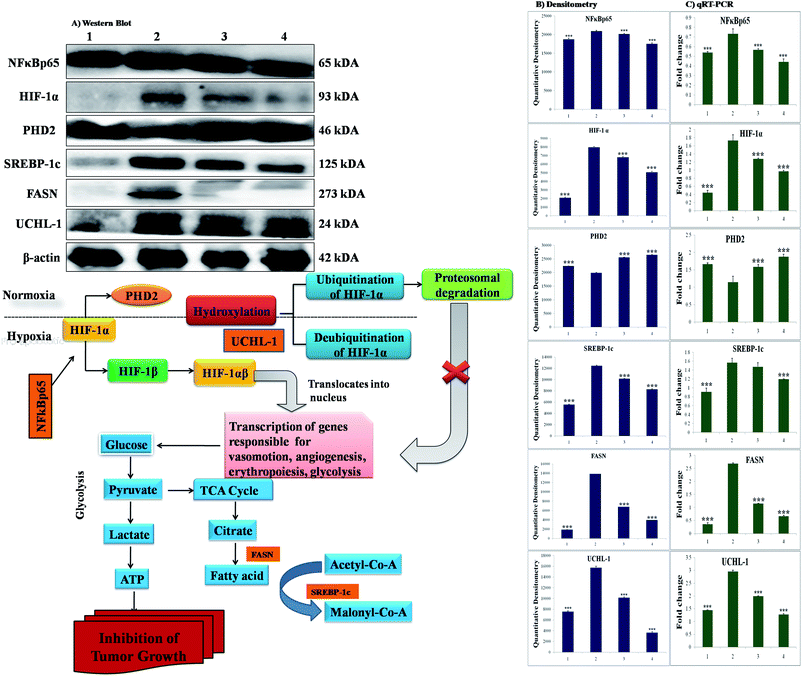
The participation of the mitochondrial mediated death apoptosis pathway was confirmed after immunoblotting analysis. The pathway is strongly regulated by the Bcl-2 family of proteins. The results revealed that after MNU treatment, the expressions of anti-apoptotic proteins Bcl-2 and Bcl-xl were upregulated, with the opposite effect on the pro-apoptotic protein BAX. BBAP-1 treatment restored the expression of Bcl-2, Bcl-xl and BAX towards the control. Other proteins of the mitochondrial mediated pathway (VDAC, Apaf-1 and cytochrome c) were strongly regulated after BBAP-1 treatment. BBAP-1 treatment downregulated the expression of VDAC, Apaf-1 and procaspase 9 while up-regulating expression of cytochrome c (Fig. 7). When measured through the biological markers of tumor hypoxia, the expression of PHD-2 was significantly up-regulated after BBAP-1 administration, suggesting activation of PHD-2. PHD-2 activation was also confirmed through down-regulated expression of HIF-1α, FASN and SREBP-1c after BBAP-1 treatment. Subsequently, the decreased expression of HIF-1α was furthermore affirmed through the abated expression of UCHL-1 and NF-κBp65 (Fig. 8).Quantification of mRNA expression of the targeted genes
The quantification of fold changes in genes was evaluated using qRT-PCR. The immunoblotting assay ascertained that mitochondrial-mediated apoptotic death was induced by BBAP-1 (Fig. 7) along with in vivo actuation of PHD-2, and the same findings were confirmed through the study of genomic contributors using qRT-PCR (Fig. 8).Discussion
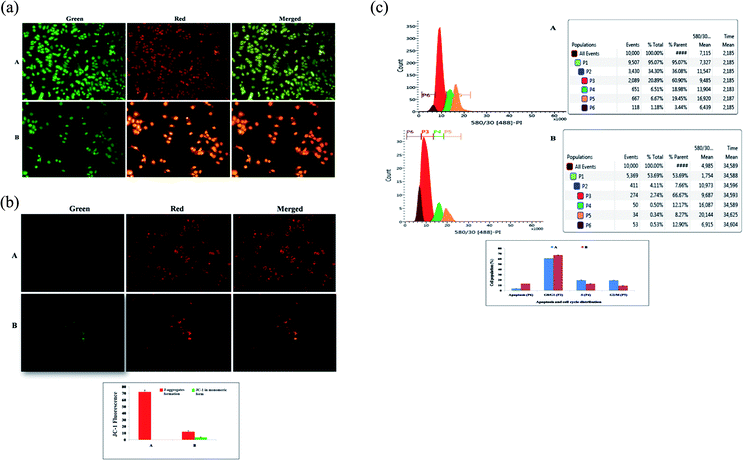
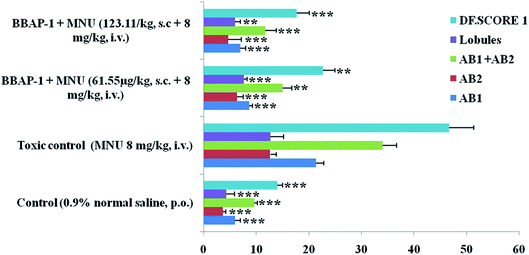
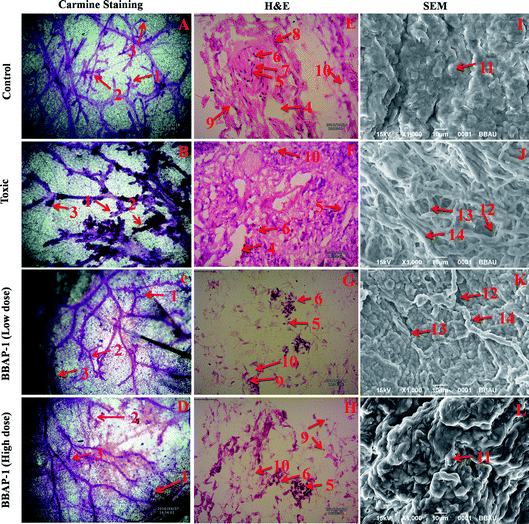
The present study revealed the potential role of PHD-2 activators in curtailing the growth of tumor cells by down-regulating the level of HIF-1α and FASN. BBAP-1 was identified as a potential activator of PHD-2 through a series of in silico tools and subjected to additional evaluation (Fig. 1A). BBAP-1 demonstrated noteworthy cytotoxic effects against ER + MCF-7 cells and was therefore considered for further evaluation (Fig. 1B). BBAP-1 treatment upregulated the level of PHD-2 when scrutinized through 2-OG dependent assay (Fig. 1C). Treatment with BBAP-1 induced morphological changes associated with apoptosis including membrane blebbing, fragmentation, chromatin condensation, the formation of apoptotic bodies and dotted nuclei when examined through AO/EtBr staining (Fig. 2A). BBAP-1 treatment also produced a marked decrease in mitochondrial membrane potential as visualized through JC-1 staining (Fig. 2B). Finally, cell cycle analysis was studied through PI staining to identify the population of cells existing in the G0/G1, S and G2/M phases.44 BBAP-1 treatment reduced the number of cells in the G2/M phase, as evidenced by the higher cell population in the G0/G1 phase along with the increase in apoptotic cell burden (Fig. 2C).Subsequently, the efficacy of BBAP-1 was also validated against the MNU induced mammary gland carcinoma model, which enables us to give a comprehensive assessment of its potential. The in vivo efficacy of BBAP-1 was further scrutinized on morphological grounds using carmine staining, H&E staining and SEM. The MNU induced mammary gland model is a well-established model for mammary gland carcinoma in rats.45 MNU is an alkylating agent, and one possible site of alkylation is the guanine base pair of DNA.46 The alkylation leads to the formation of a short-lived N-methyl guanine and a long-lived O-methyl guanine intermediate. Methylation of the O position changes the hydrogen bonding properties of guanine, thereby inducing the guanine to adenosine transition and causing DNA damage.47 MNU treatment increased the AB count and DF score and the findings are in line with a previous report.48 BBAP-1 treatment diminished both the AB count and DF score, suggesting the anti-proliferative effect of BBAP-1 (Fig. 3 and 4A–D). The results derived from carmine staining were subsequently affirmed by the histopathological evaluation and SEM analysis. Histopathological examination of the mammary gland tissue of the animals treated with MNU revealed the distorted histological architecture characterized by the scattered pattern of CECs, loss of ducts and MECs. The LCT and DCT were hard to identify, which is in agreement with the earlier report (Fig. 4E–H).39 In addition, SEM analysis of the mammary gland tissue of the MNU treated group demonstrated the presence of tumor micro-vessels, enlarged capillaries along with the loss of intra-arterial cushion. BBAP-1 treatment restored the surface architecture (Fig. 4I–L).
Progression of carcinogenesis is also related to generation of reactive oxygen species (ROS) and oxidative stress markers in multiple ways.49 Treatment with MNU intensified the lipid and protein peroxidation as manifested through increased levels of TBARs and PC, suggesting ROS generation. Increased ROS generation was also affirmed through the down-regulated levels of enzymatic defense of SOD/catalase/GSH.50 The increase in TBARs and PC could be attributed to the alkylating effect of MNU. The down-regulated enzymatic antioxidant defense could be attributed to the increased utilization of these enzymes to curtail progressive ROS generation. SOD dismutase catalyzes the O˙ to molecular O2 and H2O2. The H2O2 thus generated is catalyzed by catalase and GSH peroxidase to water. SOD, catalase and GSH work together to nudge ROS (O˙) .51 Concomitant treatment with BBAP-1 helped to restore the levels of SOD/catalase/GSH and curtail the production of TBARs and PC thereby reflecting the diminution of oxidative stress induced by MNU (Fig. 5).
We further extended the horizon of the study to elaborate the effect of BBAP-1 upon the biological markers of apoptosis. The expression of anti-apoptotic Bcl-2 and Bcl-xl was decreased after BBAP-1 treatment with the opposite effect upon pro-apoptotic BAX. The modulation of the apoptotic signals at the protein level was also marked at the mRNA level.52 The triggering of apoptosis can be further observed through decreased expression of VDAC and release of cytochrome c from mitochondria to cytosol.53 Treatment with BBAP-1 caused decreased VDAC and increased cytochrome c expression, which was also evident for the respective phenotypes at the mRNA level. Released cytochrome c in the cytosol interacts with Apaf-1, resulting in apoptosome formation for the execution of apoptosis.54 Apoptosome formation can be confirmed through decreased expression of Apaf-1 and this was observed after BBAP-1 treatment. The formation of apoptosome cleaves the procaspase 9 to give active caspase 9, and BBAP-1 treatment reduced the expression of procaspase 9.55 It is worth mentioning that activated caspase 9 further actuates the effectors caspase 3 and 8 for execution of apoptosis.56 BBAP-1 treatment up-regulated the levels of caspase 3 and 8 and thereby accelerated apoptosis (Fig. 6) which affirms the induction of mitochondrial mediated apoptosis after BBAP-1 treatment (Fig. 7).
In order to validate our hypothesis, the effect of BBAP-1 upon PHD-2 mediated proteasomal degradation of HIF-1α was scrutinized. It would be appropriate to remark that during hypoxia, HIF-1α escapes proteasomal degradation and promotes tumor growth through up-regulating fatty acid synthesis.57,58 The increased fatty acid demand of the tumor cells is fulfilled through FASN, which is very well reported to be overexpressed in tumor cells.59,60 It would be appropriate to mention that the transcriptional activity of FASN is regulated with the help of transcription factor SREBP1-c.61 The expression of PHD-2 was increased after BBAP-1 treatment followed by decreased expression of HIF-1α, demonstrating its proteasomal degradation. Treatment with BBAP-1 also downregulated the expression of FASN and SREBP-1c, confirming decreased fatty acid synthesis and lipogenic activity in mammary gland tissues. The PHD-2 mediated proteasomal degradation of HIF-1α was further validated through UCHL-1.62 The 20s immunoproteosomal subunit of UCHL-1 participated in the deubiquitination of HIF-1α, making HIF-1α more stable and thereby promoting the hypoxic microenvironment of the cancerous cells.63 In fact, UCHL-1 has been shown to provide diagnostic and anti-metastatic strategies via its deubiquitination effect upon HIF-1α.63 Treatment with BBAP-1 decreased UCHL-1 expression, affirming the proteasomal degradation of HIF-1α (Fig. 8). The role of UCHL-1 was validated through inhibition of NFκBp65 subunit in treatment groups, which is in line with our previous experimental outcome.36
Conclusion
The authors would like to conclude that the line of evidence derived from the present work validates our hypothesis that the exogenous chemical activation of PHD-2 can favorably regulate cellular proliferation through mitochondrial mediated apoptosis. In this context, BBAP-1 was recorded to be a chemical activator of PHD-2 with subsequent down-regulation of the expression of HIF-1α and FASN. The authors would also like to submit that the present study explicitly endorses the in vivo efficacy of BBAP-1 against mammary gland carcinoma and illustrates the need for clinical validation for exploring its future prospect as an anticancer agent.Funding
None.Conflicts of interest
Authors declare no conflict of interest.Acknowledgements
The authors would like to thank University Grants Commission, Government of India for granting senior research fellowship to MS (RGNF-2013-14-SC-UTT-38150). Authors are also thankful to Department of Science and Technology, Government of India for giving senior research fellowship to SR (SB/EMEQ-254/2013).References
- J.-Y. Kim and J.-Y. Lee, Int. J. Mol. Sci., 2017, 18, 1854 CrossRef PubMed.
- H. Xie and M. C. Simon, J. Biol. Chem., 2017, 292, 16825–16832 CrossRef CAS PubMed.
- C. V. Dang, Genes Dev., 2012, 26, 877–890 CrossRef CAS PubMed.
- R. A. Cairns, I. S. Harris and T. W. Mak, Nat. Rev. Cancer, 2011, 11, 85–95 CrossRef CAS PubMed.
- A. Carnero and M. Lleonart, Inside the Cell, 2016, 1, 96–105 CrossRef PubMed.
- M. Mandl and R. Depping, Mol. Med., 2014, 20, 215 Search PubMed.
- D. Wu, N. Potluri, J. Lu, Y. Kim and F. Rastinejad, Nature, 2015, 524, 303–308 CrossRef CAS PubMed.
- M. Jang, S. S. Kim and J. Lee, Exp. Mol. Med., 2013, 45, e45 CrossRef PubMed.
- G. Niu and X. Chen, Curr. Drug Targets, 2010, 11, 1000–1017 CrossRef CAS PubMed.
- S. Chintala, T. Najrana, K. Toth, S. Cao, F. A. Durrani, R. Pili and Y. M. Rustum, BMC Cancer, 2012, 12, 293 CrossRef CAS PubMed.
- S. Martinez and R. P. Hausinger, J. Biol. Chem., 2015, 290, 20702–20711 CrossRef CAS PubMed.
- A. M. Meneses and B. Wielockx, Hypoxia, 2016, 4, 53–67 Search PubMed.
- M. E. Hubbi and G. L. Semenza, Am. J. Physiol.: Cell Physiol., 2015, 309, C775–C782 CrossRef CAS PubMed.
- A. Kuchnio, S. Moens, U. Bruning, K. Kuchnio, B. Cruys, B. Thienpont, M. Broux, A. A. Ungureanu, R. L. de Oliveira and F. Bruyère, Cell Rep., 2015, 12, 992–1005 CrossRef CAS PubMed.
- M. Singh, U. Devi, S. Roy, P. S. Gupta, S. A. Saraf and G. Kaithwas, Breast Cancer, 2016, 23, 820–829 CrossRef PubMed.
- S. Roy and G. Kaithwas, J. Cancer Res. Ther., 2017, 13(suppl.) Search PubMed pS151-S151. 1/4p.
- H. Choi, B. J. Song, Y. D. Gong, W. Gwak and Y. Soh, Br. J. Pharmacol., 2008, 154, 114–125 CrossRef CAS PubMed.
- M. Nepal, Y. D. Gong, Y. R. Park and Y. Soh, Cell Biochem. Funct., 2011, 29, 126–134 CrossRef CAS PubMed.
- E. Temes, S. Martín-Puig, B. Acosta-Iborra, M. C. Castellanos, M. Feijoo-Cuaresma, G. Olmos, J. Aragonés and M. O. Landazuri, J. Biol. Chem., 2005, 280, 24238–24244 CrossRef CAS PubMed.
- C. A. Lipinski, F. Lombardo, B. W. Dominy and P. J. Feeney, Adv. Drug Delivery Rev., 2012, 64, 4–17 CrossRef.
- G.-H. Li and J.-F. Huang, Bioinformatics, 2012, 28, 3334–3335 CrossRef CAS PubMed.
- S. M. Bensaber, H. Allafe, N. B. Ermeli, S. B. Mohamed, A. A. Zetrini, S. G. Alsabri, M. Erhuma, A. Hermann, M. I. Jaeda and A. M. Gbaj, Med. Chem. Res., 2014, 23, 5120–5134 CrossRef CAS.
- A. Lagunin, A. Zakharov, D. Filimonov and V. Poroikov, Mol. Inf., 2011, 30, 241–250 CrossRef CAS PubMed.
- F. Melnikov, J. Kostal, A. Voutchkova-Kostal, J. B. Zimmerman and P. T. Anastas, Green Chem., 2016, 18, 4432–4445 RSC.
- S. K. Paramashivam, K. Elayaperumal, B. Natarajan, M. Ramamoorthy, S. Balasubramanian and K. N. Dhiraviam, Bioinformation, 2015, 11, 73–84 CrossRef PubMed.
- M. Rostkowski, O. Spjuth and P. Rydberg, Bioinformatics, 2013, 29, 2051–2052 CrossRef CAS PubMed.
- R. Kuttan, D. Parrott, S. Kaplan and G. Fuller, Res. Commun. Chem. Pathol. Pharmacol., 1979, 26, 337–345 CAS.
- L. McNeill, L. Bethge, K. Hewitson and C. Schofield, Anal. Biochem., 2005, 336, 125–131 CrossRef CAS PubMed.
- H. Wang, J. Qian, Y. Zhang, W. Xu, J. Xiao and A. Suo, Cancer Cell Int., 2017, 17, 55 CrossRef PubMed.
- M. G. Perez, L. Fourcade, M. A. Mateescu and J. Paquin, Anal. Biochem., 2017, 535, 43–46 CrossRef PubMed.
- K. Mohankumar, S. Pajaniradje, S. Sridharan, V. K. Singh, L. Ronsard, A. C. Banerjea, C. S. Benson, M. S. Coumar and R. Rajagopalan, Chem.-Biol. Interact., 2014, 210, 51–63 CrossRef CAS PubMed.
- S. Roy, A. K. Rawat, S. R. Sammi, U. Devi, M. Singh, S. Gautam, R. K. Yadav, J. K. Rawat, L. Singh and M. N. Ansari, Oncotarget, 2017, 8, 70049 Search PubMed.
- S. E. Besra, M. Ray, S. Dey, S. Roy and N. Deb, Int. J. Pharm. Sci. Rev. Res., 2013, 20, 146–152 Search PubMed.
- A. J. Wilson, F. Tehrani and M. Baum, Br. J. Surg., 1982, 69, 121–125 CrossRef CAS PubMed.
- H. Seeger, J. Huober, D. Wallwiener and A. Mueck, Horm. Metab. Res., 2004, 36, 277–280 CrossRef CAS PubMed.
- A. Rani, S. Roy, M. Singh, U. Devi, R. K. Yadav, S. Gautam, J. K. Rawat, M. N. Ansari, A. S. Saeedan and A. Prakash, Inflammopharmacology, 2016, 24, 277–286 CrossRef CAS PubMed.
- C. Manral, S. Roy, M. Singh, S. Gautam, R. K. Yadav, J. K. Rawat, U. Devi, M. N. Ansari, A. S. Saeedan and G. Kaithwas, BMC Complementary Altern. Med., 2016, 16, 260 CrossRef PubMed.
- S. Gautam, P. Singh, M. Singh, S. Roy, J. K. Rawat, R. K. Yadav, U. Devi, P. S. Gupta, S. A. Saraf and G. Kaithwas, RSC Adv., 2018, 8, 3512–3521 RSC.
- H. Yoshida, A. Kadota, R. Fukunishi and K. Matsumoto, J. Natl. Cancer Inst., 1980, 64, 1105–1112 CAS.
- G. Kaithwas, P. Singh and D. Bhatia, Drug Chem. Toxicol., 2014, 37, 135–143 CrossRef CAS PubMed.
- B. L. Tan, M. E. Norhaizan, K. Huynh, S. R. Heshu, S. K. Yeap, H. Hazilawati and K. Roselina, BMC Complementary Altern. Med., 2015, 15, 205 CrossRef PubMed.
- N. Sharma and Y. Ahmad, J. Proteomics Bioinf., 2011, 2009 Search PubMed.
- S. Roy, M. Singh, A. Rawat, U. Devi, S. Gautam, R. K. Yadav, J. K. Rawat, M. N. Ansari, A. S. Saeedan and D. Kumar, Int. J. Biochem. Cell Biol., 2018, 96, 51–62 CrossRef CAS PubMed.
- A. Filby, E. Perucha, H. Summers, P. Rees, P. Chana, S. Heck, G. M. Lord and D. Davies, Cytometry, Part A, 2011, 79, 496–506 CrossRef PubMed.
- D. Sharma, B. M. Smits, M. R. Eichelberg, A. L. Meilahn, M. J. Muelbl, J. D. Haag and M. N. Gould, PLoS One, 2011, 6, e26145 CAS.
- N. Kondo, A. Takahashi, K. Ono and T. Ohnishi, Nucleic Acids Res., 2010, 21, 543531 Search PubMed.
- M. Christmann, B. Verbeek, W. P. Roos and B. Kaina, BBA, Biochim. Biophys. Acta, Rev. Cancer, 2011, 1816, 179–190 CrossRef CAS PubMed.
- S. De Assis, A. Warri, M. I. Cruz and L. Hilakivi-Clarke, J. Visualized Exp., 2010, 44, e2260 Search PubMed.
- S. Reuter, S. C. Gupta, M. M. Chaturvedi and B. B. Aggarwal, Free Radical Biol. Med., 2010, 49, 1603–1616 CrossRef CAS PubMed.
- G. Kaithwas and D. K. Majumdar, Inflammopharmacology, 2010, 18, 137–145 CrossRef CAS PubMed.
- P. Raj, M. Singh, J. K. Rawat, S. Gautam, S. A. Saraf and G. Kaithwas, RSC Adv., 2014, 4, 60397–60403 RSC.
- S. Xiong, T. Mu, G. Wang and X. Jiang, Protein Cell, 2014, 5, 737–749 CrossRef CAS PubMed.
- V. Shoshan-Barmatz, N. Keinan, S. Abu-Hamad, D. Tyomkin and L. Aram, BBA, Biochim. Biophys. Acta, Bioenerg., 2010, 1797, 1281–1291 CrossRef CAS PubMed.
- S. W. Tait and D. R. Green, Cold Spring Harbor Perspect. Biol., 2013, 5, a008706 CrossRef PubMed.
- S. B. Bratton and G. S. Salvesen, J. Cell Sci., 2010, 123, 3209–3214 CrossRef CAS PubMed.
- M. Brentnall, L. Rodriguez-Menocal, R. L. De Guevara, E. Cepero and L. H. Boise, BMC Cell Biol., 2013, 14, 32 CrossRef CAS PubMed.
- C. Munoz-Pinedo, N. El Mjiyad and J. Ricci, Cell Death Dis., 2012, 3, e248 CrossRef CAS PubMed.
- T. Soga, Cancer Sci., 2013, 104, 275–281 CrossRef CAS PubMed.
- P. S. Ward and C. B. Thompson, Cold Spring Harbor Perspect. Biol., 2012, 4, a006783 Search PubMed.
- M. Mansour, D. Schwartz, R. Judd, B. Akingbemi, T. Braden, E. Morrison, J. Dennis, F. Bartol, A. Hazi and I. Napier, Int. J. Oncol., 2011, 38, 537 CrossRef CAS PubMed.
- X. Deng, W. Zhang, O. InSug, J. B. Williams, Q. Dong, E. A. Park, R. Raghow, T. G. Unterman and M. B. Elam, J. Biol. Chem., 2012, 287, 20132–20143 CrossRef CAS PubMed.
- R. Nakashima, Y. Goto, S. Koyasu, M. Kobayashi, A. Morinibu, M. Yoshimura, M. Hiraoka, E. M. Hammond and H. Harada, Sci. Rep., 2017, 7, 6879 CrossRef PubMed.
- Y. Goto, L. Zeng, C. J. Yeom, Y. Zhu, A. Morinibu, K. Shinomiya, M. Kobayashi, K. Hirota, S. Itasaka and M. Yoshimura, Nat. Commun., 2015, 6, 6153 CrossRef CAS PubMed.
Footnotes |
| † Electronic supplementary information (ESI) available. See DOI: 10.1039/c8ra01239c |
| ‡ Both authors have contributed equally. |
| This journal is © The Royal Society of Chemistry 2018 |

