 Open Access Article
Creative Commons Attribution 3.0 Unported Licence
Role of NH4 ions in successive phase transitions of perovskite type (NH4)2ZnX4 (X = Cl, Br) by 1H MAS NMR and 14N NMR
Ae Ran Lim *ab
*ab
aAnalytical Laboratory of Advanced Ferroelectric Crystals, Jeonju University, Jeonju 55069, Korea. E-mail: aeranlim@hanmail.net; arlim@jj.ac.kr
bDepartment of Science Education, Jeonju University, Jeonju 55069, Korea
First published on 21st March 2018
Abstract
The 1H chemical shifts and the spin-lattice relaxation time, T1ρ, in the rotating frame of (NH4)2ZnX4 (X = Cl, Br) are observed in order to investigate local phenomena related to successive phase transitions. The temperature dependence of T1ρ values for 1H showed a minimum, and the T1ρ values for 1H appeared to be governed by tumbling molecular motions at high temperatures. In addition, 14N NMR spectra are studied in each phase of (NH4)2ZnX4 single crystals in the laboratory frame. The phase transition temperatures strongly affect the 14N number of symmetry related nitrogen centers within the unit cell. The 1H MAS NMR and 14N NMR results are discussed to elucidate the roles of NH4 ions during the phase transitions of (NH4)2ZnX4.
1. Introduction
Perovskite A2BX4 type (A = NH4, K, Rb, Cs; B = Zn, Co, Cu, Fe, Zn, Cd; X = Cl, Br) crystals have received a great deal of attention because of their nonlinear optical properties, and also because of the significant diversity of their structural phase transitions.1–10 The prototype of the crystal structures of this family is that of β-K2SO4, which consists of isolated BX42− tetrahedra and monovalent A+ cations placed in two inequivalent cavities. Ammonium tetrachlorozincate, (NH4)2ZnCl4, and ammonium tetrabromozincate, (NH4)2ZnBr4, belong to the family of crystals of the perovskite A2BX4 type and are known to undergo several phase transitions. Although the physical properties of (NH4)2ZnCl4 and (NH4)2ZnBr4 have been studied by several research groups, the structural geometry changes during the phase transitions of the two compounds have not been fully understood. Here, the phase transition temperatures and dynamics of the cations in (NH4)2ZnCl4 and (NH4)2ZnBr4 are important. The potential applications of these materials are strongly affected by the phase transitions and dynamics of the cations.11(NH4)2ZnCl4 undergoes five phase transitions: those between phases I and II at 406 K (=TC1) and phases II and III at 364 K (=TC2) are well-known, and the successive phase transitions at 319 K (=TC3), 271 K (=TC4), and 266 K (=TC5) have also been reported;12–14 the phases involved in these transitions are denoted by VI, V, IV, III, II, and I in order of increasing temperature, as shown in Table 1. The structure of (NH4)2ZnCl4 in the normal phase, phase I (above 406 K), is orthorhombic with ao = 9.274 Å, bo = 12.620 Å, and co = 7.211 Å, and space group Pnma.12 Upon cooling, there is a phase transition at 406 K to an incommensurate phase that is stable down to 364 K.15 The structure in phase III between 364 K and 319 K is orthorhombic with a = ao, b = bo, c = 4co, and the space group Pn21a.12,16,17 The room temperature phase, phase IV, is antiferroelectric with a pseudo-orthorhombic monoclinic structure and space group Pa.12 The region between 271 K and 266 K is mixed phase.14 Below 266 K, the lattice is constant with an orthorhombic structure, where a = ao, b = bo, and c = 3co.12,17
| (NH4)2ZnCl4 | ||||||
|---|---|---|---|---|---|---|
| Transition temperature | TC5 (=266K) | TC4 (=271 K) | TC3 (=319 K) | TC2 (=364 K) | TC1 (=406 K) | |
| Phase | VI | V | IV | III | II | I |
| Structure | Orthorhombic | Mixed phase | Monoclinic | Orthorhombic | Incommensurate | Orthorhombic |
| Space group | Pna21 | Pa | Pn21a | Pnma | ||
| Lattice constant | a = ao | a = ao | a = ao | ao = 9.274 Å | ||
| b = bo | b = bo | b = bo | bo = 12.620 Å | |||
| c = 3co | c = 4co | c = 4co | co = 7.211 Å | |||
| β = 89.992° | ||||||
| Z = 12 | Z = 12, 14, 16 | Z = 16 | Z = 16 | Z = 4 | ||
| Reference | 12 and 17 | 14 | 12 | 12, 16 and 17 | 15 | 12 |
| (NH4)2ZnBr4 | ||||
|---|---|---|---|---|
| Transition temperature | TC3 (=216 K) | TC2 (=395 K) | TC1 (=432 K) | |
| Phase | IV | III | II | I |
| Structure | Orthorhombic | Monoclinic | Incommensurate | Orthorhombic |
| Space group | P21cn | P21/c11 | Pmcn | |
| Lattice constant | a = ao | a = ao | ao = 7.649 Å | |
| b = bo | b = bo | bo = 13.353 Å | ||
| c = 3co | c = 4co | co = 9.727 Å | ||
| β = 90.00(3)° | ||||
| Z = 12 | Z = 16 | Z = 4 | ||
| Reference | 22 | 22 | 20 | 21 and 22 |
On the other hand, the successive phase transitions of (NH4)2ZnBr4 have been reported at 216 K (=TC3), 395 K (=TC2), and 432 K (=TC1),18–20 as shown in Table 1; the phases involved in these transitions are represented by IV, III, II, and I in order of increasing temperature. The structures of (NH4)2ZnBr4 crystals in phases I, III, and IV are shown in Fig. 1. In phase I (above 432 K), the structure of (NH4)2ZnBr4 is orthorhombic with ao = 7.649 Å, bo = 13.353 Å, co = 9.727 Å, and space group Pmcn.21,22 Upon cooling, there is a phase transition at 432 K to an incommensurate phase II that is stable down to 395 K. The structure in phase III, between 395 K and 216 K, is monoclinic with a = ao, b = bo, c = 4co, β = 90.00(3)°, and space group P21/c11.22 The low-temperature phase IV is orthorhombic with a = ao, b = bo, c = 3co, and space group P21cn.22
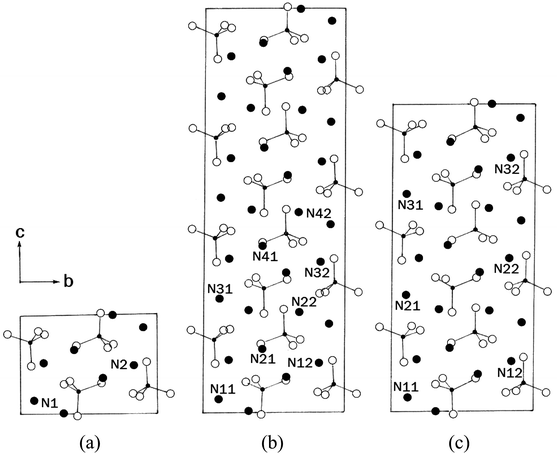 | ||
| Fig. 1 Projection of the structure along the a-axis in phases (a) I, (b) III, and (c) IV of (NH4)2ZnBr4 crystal. | ||
The 1H spin-lattice relaxation times of (NH4)2ZnCl4 and (NH4)2ZnBr4 crystals have been obtained in the laboratory frame by Lim et al.23–25 and Ramesh et al.,26 respectively. The molecular dynamics and phase transitions of (NH4)2ZnCl4 single crystals were reported previously. There were two crystallographically inequivalent NH4 sites, namely NH4(1) and NH4(2), in the (NH4)2ZnCl4. The 1H spin-lattice relaxation time T1 in the laboratory frame was observed to vary continuously with temperature without jumps or changes. The 1H T1 passes through a minimum value near 220 K; the presence of this minimum was attributed to the reorientation of the NH4 groups. In addition, the 14N nuclear magnetic resonance (NMR) results in phase I of (NH4)2ZnCl4 were reported for the two inequivalent sites N(1) and N(2): the quadrupole coupling constant, e2qQ/h, and asymmetry parameter, η, were e2qQ/h = 105.5 kHz and η = 0.96 for N(1), and e2qQ/h = 48.2 kHz and η = 0.087 for N(2).27
The NMR method enables the study of a lattice's local properties, and is particularly useful in those cases that require information on the behavior of individual structural groups. Measurements of T1ρ obtained by magic angle spinning (MAS) NMR in the rotating frame are advantageous in that they allow for probing of molecular motion in the kHz range, whereas T1 values obtained by state NMR in a laboratory frame reflect motion in the MHz range.28
The aim of this paper is to clarify the structural changes associated with the successive phase transitions in (NH4)2ZnX4 (X = Cl, Br). Detailed studies of the molecular motions are necessary in order to explain the mechanisms of the phase transitions of (NH4)2ZnX4. The temperature dependences of the MAS NMR spectra and the spin-lattice relaxation times, T1ρ, in the rotating frame for the 1H nuclei in (NH4)2ZnX4 were investigated using a pulsed NMR spectroscopy. In addition, the 14N NMR spectra in (NH4)2ZnX4 single crystals were obtained by static NMR in the laboratory frame, as a function of temperature. The 1H MAS NMR and 14N static NMR results were analyzed to elucidate the roles of NH4 ions during the phase transitions of (NH4)2ZnCl4 and (NH4)2ZnBr4. The T1ρ values by 1H MAS NMR obtained here and the previously reported T1 values by 1H static NMR are compared. In addition, the information regarding the structural geometry of nitrogen environments in NH4+ is discussed as a function of temperature.
2. Experimental method
Single crystals of (NH4)2ZnCl4 and (NH4)2ZnBr4 were obtained by the slow evaporation of aqueous solutions with the appropriate molar ratios of NH4Cl and ZnCl2, and NH4Br and ZnBr2, respectively, at 298 K.12,29,30 These single crystals exhibited hexagonal shapes that were transparent and colorless.1H MAS NMR spectra and the spin-lattice relaxation times, T1ρ, in the rotating frame in (NH4)2ZnCl4 and (NH4)2ZnBr4 were measured in a static magnetic field of 9.4 T and Larmor frequency of ω0/2π = 400.13 MHz, using a Bruker 400 MHz NMR spectroscopy at the Korea Basic Science Institute, Western Seoul Center. The chemical shifts were measured with respect to tetramethylsilane (TMS). Powder samples were placed inside a 4 mm cross-polarization (CP)/MAS probe, and the MAS rate was set to 5 kHz to minimize spinning sideband overlap. 1H T1ρ values were determined using a π/2–t sequence by varying the duration of spin-locking pulses. The widths of the π/2 pulse used to measure the T1ρ values of 1H in (NH4)2ZnCl4 and (NH4)2ZnBr4 were 4.35 μs and 3.7 μs, respectively, with the spin-locking field equaling 57.47 kHz and 67.56 kHz.
In addition, the 14N NMR spectra of the (NH4)2ZnCl4 and (NH4)2ZnBr4 single crystals in the laboratory frame were measured using a Unity INOVA 600 NMR spectroscopy at the Korea Basic Science Institute, Western Seoul Center. The static magnetic field was 14.1 T, and the Larmor frequency was set to ω0/2π = 43.342 MHz. The 14N NMR experiments were performed using a solid echo sequence of π/2–t–π/2–t. The widths of the π/2 pulse for 14N in (NH4)2ZnCl4 and (NH4)2ZnBr4 were 4 μs and 3.7 μs, respectively. The measurements of 1H MAS NMR in the rotating frame and 14N NMR in the laboratory frame were obtained over the temperature range of 180–430 K. Sample temperatures on MAS NMR and static NMR were held constant within ±0.5 K by controlling the helium gas flow and heater current.
3. Experimental results and discussion
3.1 Phase transition temperatures
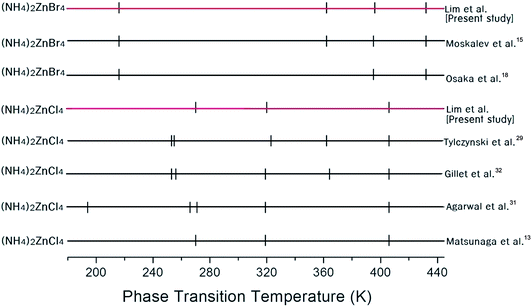
The phase transition temperatures for (NH4)2ZnCl4 and (NH4)2ZnBr4 single crystals have not yet been accurately established, as shown in Fig. 2. Here, the small vertical bars were represented the phase transition temperatures reported by several groups. In the case of (NH4)2ZnCl4, this crystal exhibits three temperature dependence anomalies in the dielectric, thermal, and X-ray diffraction measurements at 270 K, 319 K, and 406 K, respectively, as reported by Matsunaga et al.13 Furthermore, anomalies characteristic of phase transitions reported by Agarwal et al.31 have been found in the Raman spectra investigations at 194 K, 266 K, 271 K, 319 K, and 406 K. According to Gillet et al.,32 the occurrence of phase transitions at 253 K, 256 K, 319 K, 364 K, and 406 K was also confirmed on the basis of the Brillouin investigation.32 In addition, thermal expansion changes at temperatures of 253 K, 255 K, 323 K, 362 K, and 406 K were reported by Tylczynski et al.29 In the case of (NH4)2ZnBr4, phase transition temperatures have been reported at 216 K, 395 K, and 432 K by Osaka et al.,18 and an additional phase transition at 365 K was reported by Moskalev et al.15 in their investigation of a (NH4)2ZnBr4 crystal using 81Br nuclear quadrupole resonance (NQR), differential thermal analysis (DTA), and dielectric measurements. Fig. 2 shows that the phase transition temperatures obtained by several experiments are inconsistent for (NH4)2ZnCl4 and (NH4)2ZnBr4, respectively.In order to determine the phase transition temperatures for the (NH4)2ZnCl4 and (NH4)2ZnBr4 single crystals obtained here, differential scanning calorimetry (DSC) measurements were taken with a DuPont 2010 DSC instrument at a heating rate of 10 °C min−1. The DSC measurements revealed three endothermic peaks at 270 K, 320 K, and 406 K for (NH4)2ZnCl4, and four endothermic peaks at 216 K, 362 K, 396 K, and 432 K for (NH4)2ZnBr4, as shown in Fig. 3. These endothermic peaks were related to the phase transitions, and the temperatures were consistent with those previously reported by Matsunaga et al.13 and Moskalev et al.15 The phase transition temperatures of (NH4)2ZnX4 may vary according to the conditions of crystal growth.
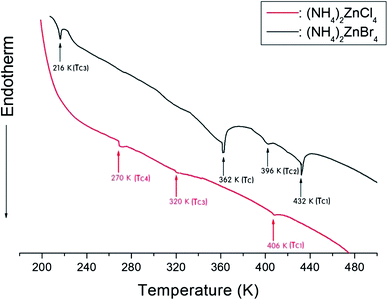 | ||
| Fig. 3 Differential scanning calorimetry (DSC) thermograms of (NH4)2ZnCl4 and (NH4)2ZnBr4 single crystals. | ||
3.2 Molecular motion near phase transition temperatures from 1H MAS NMR
The 1H MAS NMR spectra in (NH4)2ZnCl4 and (NH4)2ZnBr4 were measured as a function of temperature. At room temperature, (NH4)2ZnCl4 and (NH4)2ZnBr4 showed only one peak each, at chemical shifts of δ = 6.53 ppm and δ = 6.66 ppm, respectively, as shown in Fig. 4. The phase transition temperatures of (NH4)2ZnCl4 are denoted by solid lines, and those of (NH4)2ZnBr4 are denoted dash lines. The chemical shifts of the two materials did not change near the phase transition temperatures. The 1H chemical shifts of (NH4)2ZnCl4 decreased with increasing temperature, whereas the 1H chemical shift of (NH4)2ZnBr4 increased with increasing temperature. From the chemical shift for 1H, the proton environments in N–H⋯Cl bond and the proton environments in N–H⋯Br bond were very different. This difference of chemical shifts was possibly due to the difference between the electron structures of halogen ions.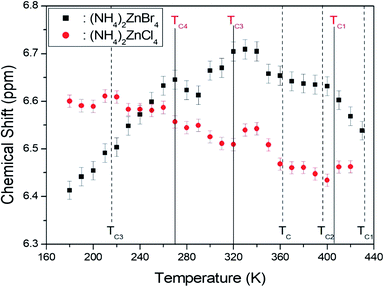 | ||
| Fig. 4 Chemical shifts of 1H MAS NMR spectra in (NH4)2ZnCl4 and (NH4)2ZnBr4 as a function of temperature ((NH4)2ZnCl4: solid lines, (NH4)2ZnBr4: dash lines). | ||
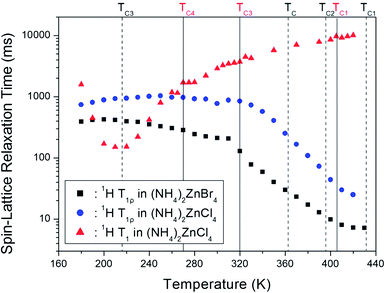
The decay traces for the 1H resonance line in (NH4)2ZnCl4 and (NH4)2ZnBr4 are represented by a single exponential function of M(t) = M(∞)exp(−t/T1ρ), where M(t) is the magnetization as a function of the spin-locking pulse duration t, and M(∞) is the total nuclear magnetization of 1H at thermal equilibrium.14 The decay traces for the 1H nuclei varied with the delay time, and these decay traces also varied depending upon the temperature. The decay traces fitted with the single exponential function for delay times. From the slopes of the decay traces, the 1H spin-lattice relaxation times, T1ρ, in the rotating frame for the (NH4)2ZnCl4 and (NH4)2ZnBr4 were obtained as a function of temperature, as shown in Fig. 5. The T1ρ values of 1H were significantly different in the high-temperature and low-temperature regions. The significant difference in the T1ρ values indicates that (NH4)2ZnCl4 and (NH4)2ZnBr4 are strongly affected, which considered to be mainly the result of molecular motions. The 1H T1ρ data showed no evidence of a change near the phase transition temperatures. The trend of 1H T1ρ in (NH4)2ZnCl4 resembled that of 1H T1ρ in (NH4)2ZnBr4. The two T1ρ series displayed similar trends, both decreasing quickly above 310 K. The variation of T1ρ with temperature exhibited a shallow minimum of 7.2 ms at 430 K in the case of (NH4)2ZnBr4, indicating that distinct molecular motion is present. The T1ρ minimum is considered to be clearly attributable to the tumbling motion of NH4+ ions. The T1ρ values are related to the corresponding values of the rotational correlation time, τC, which directly measures the rate of motion. The experimental T1ρ value can be expressed in terms of τC using molecular motion, as suggested by the Bloembergen–Purcell–Pound (BPP) theory.33 The T1ρ value in the rotating frame can also be expressed in terms of τC using molecular motion.28,34
| 1/T1ρ = (n/20)(γHγNħ/rH–N3)2[4f(ω1) + f(ωH − ωN) + 3f(ωN) + 6f(ωH + ωN) + 6f(ωH)] | (1) |
Here:
| f(ω1) = τC/[1 + ω12τC2] |
| f(ωH − ωN) = τC/[1 + (ωH − ωN)2τC2] |
| f(ωN) = τC/[1 + ωN2τC2] |
| f(ωH + ωN) = τC/[1 + (ωH + ωN)2τC2] |
| f(ωH) = τC/[1 + ωH2τC2] |
In the equation, γH and γN are the gyromagnetic ratios for the 1H and 14N nuclei, respectively; n is the number of directly bound protons; rH–N is the H–N internuclear distance; ħ is the reduced Planck constant; ωH and ωN are the Larmor frequencies of 1H and 14N, respectively; and ω1 is the spin-lock field frequency of 67.56 kHz. Here, the f(ω1) is non-zero, i.e., the τC is much less than the Larmor frequencies, therefore all of the other terms is far smaller than the f(ω1) term. We analyzed our data by assuming that T1ρ would show a minimum when ω1τC = 1, and that the relation between T1ρ and the characteristic frequency of motion, 1/τC, could be applied. The coefficient in eqn (1) can be determined because the T1ρ curve displays a minimum and because the value of τC can be obtained from ω1τC = 1; thus, (n/20)(γHγNħ/rH–N3)2 ≈ 4.66 × 10⁶ in the BPP formula. We were then able to calculate the correlation time τC as a function of temperature. The temperature dependence of τC follows a simple Arrhenius expression:34,35
τC = τo![[thin space (1/6-em)]](https://www.rsc.org/images/entities/char_2009.gif) exp(−Ea/RT), exp(−Ea/RT),
| (2) |
![[thin space (1/6-em)]](https://www.rsc.org/images/entities/char_2009.gif) τC versus 1000/T. We obtained Ea = 36.69 ± 0.66 kJ mol−1 for the tumbling motion of 1H in (NH4)2ZnBr4 at high temperature. This value is very similar to that for 1H in (NH4)2ZnCl4, and is the same within the error range. And, the Ea for (NH4)2ZnCl4 and (NH4)2ZnBr4 at low temperature is 0.32 ± 0.30 kJ mol−1 and 2.25 ± 0.37 kJ mol−1, respectively.
τC versus 1000/T. We obtained Ea = 36.69 ± 0.66 kJ mol−1 for the tumbling motion of 1H in (NH4)2ZnBr4 at high temperature. This value is very similar to that for 1H in (NH4)2ZnCl4, and is the same within the error range. And, the Ea for (NH4)2ZnCl4 and (NH4)2ZnBr4 at low temperature is 0.32 ± 0.30 kJ mol−1 and 2.25 ± 0.37 kJ mol−1, respectively.
On the other hand, the 1H spin-lattice relaxation time T1 in the laboratory frame in (NH4)2ZnCl4 previously reported was obtained as a function of temperature, as shown in Fig. 5.23–25 In the high temperature region, T1 increases monotonically with temperature, and T1 was continuous at the phase transition temperatures. However, the T1 undergoes a change in slope near TC4. 1H T1 passes through a minimum value in the vicinity of 220 K, and the presence of this minimum was attributed to the effects of molecular motion. The relaxation process from the 1H T1 curve was affected by molecular motion, as described by the BPP theory.33 The activation energy in the low and high temperatures was reported 29.95 ± 0.85 kJ mol−1 and 10.99 ± 0.37 kJ mol−1, respectively.
3.3 Structural changes near phase transition temperatures from 14N NMR
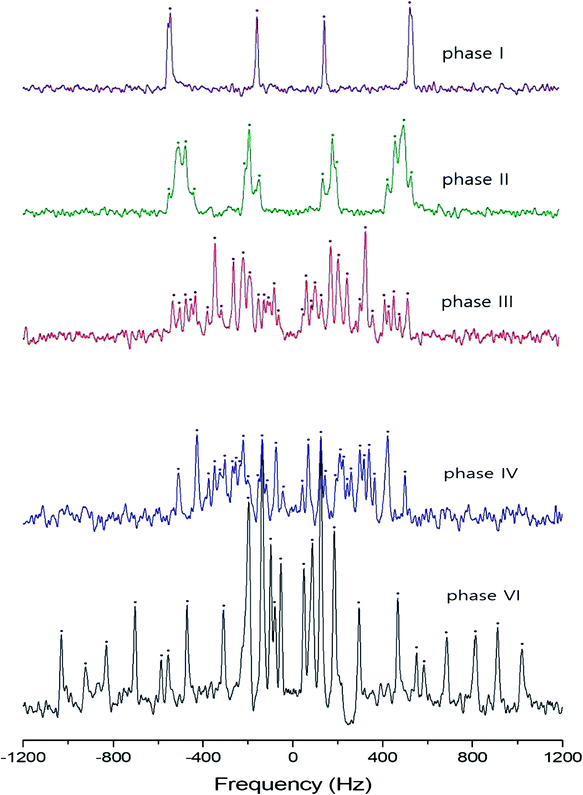
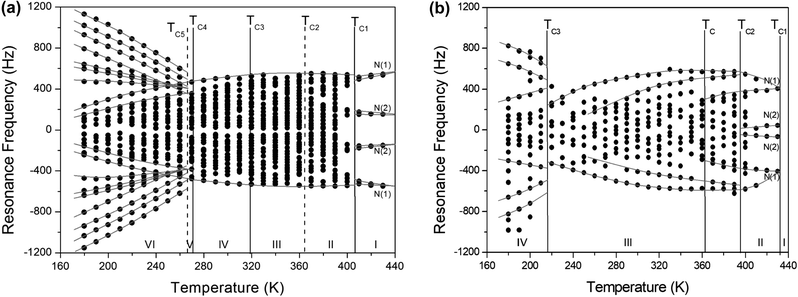
In order to investigate local phenomena related to successive phase transitions, the NMR spectra of 14N (I = 1) was obtained as a function of temperature using static NMR at a Larmor frequency of ω0/2π = 43.342 MHz. 14N (I = 1) NMR is a sensitive method for probing local structural properties in each phase. The 14N NMR spectra consisted of pairs of lines at frequencies corresponding to the transitions Δm = ±1 ↔ Δm = 0. The crystal was oriented such that the magnetic field was aligned with the crystallographic c-axis. Temperature-dependent changes in the 14N resonance frequency are generally attributed to changes in the structural geometry, indicating a change in the quadrupole coupling constant of the 14N nuclei. The 14N NMR spectra at phase I, II, III, IV, and VI in (NH4)2ZnCl4 crystals were plotted in Fig. 6. Here, the 14N peaks positions were denoted by close circles. Two resonance lines were expected because of the quadrupole interaction of the 14N nucleus. However, many resonance lines were observed, and they were much narrower in line width.The resonance frequencies of 14N signals in (NH4)2ZnCl4 and (NH4)2ZnBr4 single crystals are respectively plotted in Fig. 7(a) and (b) as a function of temperature. In the case of (NH4)2ZnCl4, the phase transitions occurring at TC1, TC3, and TC4 were observed from our DSC results, whereas those at TC2 and TC5 were not observed. Therefore, TC1, TC3, and TC4 are denoted by solid lines, and TC2 and TC5 are denoted dotted lines in Fig. 7(a). The resonance frequencies near TC1, TC4, and TC5 changed, whereas those near TC2 and TC3 did not change. In phase I, each unit cell contains four formula units, and there are also two different kinds of 14N nuclei, termed N(1) and N(2). Therefore, the 14N NMR spectra exhibited eight resonance lines in four pairs. Here, the two inequivalent sites N(1) and N(2) are distinguished by the quadrupole coupling constant previously reported: e2qQ/h = 105.5 kHz and η = 0.96 for N(1), and e2qQ/h = 48.2 kHz and η = 0.087 for N(2).27 Additional lines in phases II, III, and IV were obtained, although they exhibited very small intensities compared with phase I. In phases III and IV, the unit cell is quadrupoled along the c-direction of phase I. The unit cell of phases III and IV contains 16 formula units, and thus 32 resonance lines of 16 pairs are expected. According to the crystallography results shown in Fig. 1(b), eight atoms N(11), N(21), N(31), and N(41) are surrounded by five Cl atoms, while the other atoms N(12), N(22), N(32), and N(42), which are located between the layers created by the ZnCl4 tetrahedra, are surrounded by eight Cl atoms. From the NMR spectra results of 16 pairs of 14N, the approximately 32 resonance lines in phases III and IV were measured, as shown in Fig. 7(a). The 32 resonance lines from the 16 pairs of 14N in the NH4 ion were consistent with the previously reported crystallography structure.12,16,17 In addition, phase VI, below TC5, contains Z = 12 formula units, N(11), N(12), N(21), N(22), N(31), and N(32), as shown in Fig. 1(c). Therefore, approximately 24 resonance lines in 12 pairs were obtained. In these results, the splitting of the 14N resonance lines for seven of the pairs slightly decreased with increasing temperature, whereas those of the 14N resonance lines for the other five pairs slightly increased with increasing temperature. On the other hand, the resonance frequencies in phases I, II, III, and IV for the case of (NH4)2ZnBr4 are shown in Fig. 7(b). The 14N NMR spectra from (NH4)2ZnBr4 could not be easily observed in detail because of their very low intensity. However, the resonance frequencies near TC2 and TC3 changed discontinuously.
As mentioned above, in the case of (NH4)2ZnCl4, four pairs of lines ascribed to N(1) and N(2) nuclei appeared in phase I, above 406 K. Because the frequency distributions in phase II discontinuously emerged from these high-temperature lines, the notations N(1) and N(2) were not retained. Based on this temperature dependence, the assignment of the resonance lines in phases III and IV are also not denoted. The resonance frequency from phase V cannot be distinguished because of the much narrower temperature range. The resonance frequencies in phase VI, below TC4, changed discontinuously from those of phases V and IV. The changes in the resonance lines near TC4 for (NH4)2ZnCl4 and TC3 for (NH4)2ZnBr4 also indicated a phase transition where the new phase exhibited orthorhombic symmetry, which equates to a higher degree of symmetry compared with monoclinic symmetry. Abrupt changes in the resonance frequencies for 14N near the phase transition temperatures are generally attributed to structural phase transitions.
4. Conclusion
Data on structural geometries near successive phase transition temperatures of (NH4)2ZnX4 (X = Cl, Br) were obtained by 1H MAS NMR and 14N NMR as a function of temperature. We studied the molecular motions in (NH4)2ZnX4, based on the 1H chemical shifts and spin-lattice relaxation time, T1ρ, in the rotating frame. The 1H chemical shifts near the phase transition temperatures for the two materials did not show any drastic change, and this result might be related to proton ordering near the phase transition temperatures. From the 1H T1ρ results, the activation energies for the tumbling motion of 1H had very similar values, and the tumbling motion of NH4+ ions occurred within the high-temperature range.We compared the 1H MAS NMR in the rotating frame measured here and the previously reported 1H static NMR results in the laboratory frame23–25 for (NH4)2ZnCl4. The trends in T1ρ values for 1H in (NH4)2ZnCl4 are different from the trends in the T1 values. The molecular motion by T1ρ in the rotating frame was dominant at high temperature, whereas that by T1 in the laboratory frame was dominant at low temperature. The activation energy values extracted from T1ρ and T1 measurements are different for the molecular motions in the kHz and MHz ranges.
The 14N NMR spectra exhibited a sudden shift in the 14N peak positions and number of peaks at the phase transition temperatures. The electric field gradient (EFG) tensors at the N sites varied, reflecting the changing atomic configurations around the 14N nuclei. This is because the phase transition temperature strongly affect the 14N number of symmetry related nitrogen centers within the unit cell. Therefore, 14N NMR provides insight into changes in crystal symmetry and cation reorientation rates induced by heating and phase transitions.
The two crystals have different phase transition temperatures, but seemingly similar phase transition mechanisms. Although (NH4)2ZnX4 has different bond lengths in the Zn–X (X = Cl, Br) structure, and different X atomic radii, the different halide ions (X = Cl, Br) do not appear to significantly influence the 1H relaxation time.
Conflicts of interest
There are no conflicts to declare.Acknowledgements
This research was supported by the Basic Science Research Program through the National Research Foundation of Korea (NRF), funded by the Ministry of Education, Science, and Technology (2016R1A6A1A03012069 and 2015R1A1A3A04001077).References
- C. Griset, S. Head, J. Alices and O. A. Starykh, Phys. Rev. B, 2011, 84, 245108 CrossRef.
- T. Ono, H. Tanaka, Y. Shirata, A. Kindo, F. Ishikawa, O. Kolomiyets, H. Mitamura, T. Goto, N. Nakano, N. A. Fortune, S. T. Hannahs, Y. Yoshida and Y. Takano, J. Phys.: Conf. Ser., 2011, 302, 12003 CrossRef.
- M. Vachon, G. Koutroulakis, V. F. Mitrovic, O. Ma, J. B. Marston, A. P. Reyes, P. Kuhns, R. Coldea and Z. Tylczynski, New J. Phys., 2011, 13, 93029 CrossRef.
- K. Foyevtsova, I. Opahle, Y.-Z. Ahang, H. O. Jeschke and R. Valenti, Phys. Rev. B, 2011, 83, 125126 CrossRef.
- T. Coletta, M. E. Zhitomirsky and F. Mila, Phys. Rev. B, 2013, 87, 60407 CrossRef.
- S. A. Zvyagin, D. Kamenskyi, M. Ozerov, J. Wosnitza, M. Ikeda, T. Fujita, M. Hagiwara, A. I. Smirnov, T. A. Soldatov, A. Ya Shapiro, J. Krzystek, R. Hu, H. Ryu, C. Petrovic and M. E. Zhitomirsky, Phys. Rev. B, 2014, 112, 77206 CAS.
- A. Yamada, Phys. Rev. B, 2014, 90, 235138 CrossRef.
- J. Merino, Phys. Rev. B, 2014, 89, 245112 CrossRef.
- S. A. Zvyagin, M. Ozerov, D. Kamenskyi, J. Wosnitza, J. Krzystek, D. Yoshizawa, W. Hagiwara, R. Hu, H. Ryu, C. Petrovic and M. E. Zhitomirsky, New J. Phys., 2015, 17, 113059 CrossRef.
- B. Schmidt and P. Thalmeier, New J. Phys., 2015, 17, 73025 CrossRef.
- D. J. Kubicki, D. Prochowicz, A. Hofstetter, P. Pechy, S. M. Zakeeruddin, M. Gratzel and L. Emsley, J. Am. Chem. Soc., 2017, 139, 10055 CrossRef CAS PubMed.
- H. Matsunaga, J. Phys. Soc. Jpn., 1982, 51, 864 CrossRef CAS.
- H. Matsunaga and E. Nakamura, J. Phys. Soc. Jpn., 1981, 50, 2789 CrossRef CAS.
- T. Sata, T. Osaka and Y. Makita, J. Phys. Soc. Jpn., 1984, 53, 1907 CrossRef.
- A. K. Moskalev, I. A. Belobrova, L. I. Zherebtsova and I. P. Aleksandrova, Phys. Status Solidi A, 1982, 72, k19 CrossRef CAS.
- I. Mikhail, Acta Crystallogr., Sect. B: Struct. Crystallogr. Cryst. Chem., 1980, 36, 2126 CrossRef.
- H. Matsunaga, K. Ithoh and E. Nakamura, Acta Crystallogr., Sect. B: Struct. Crystallogr. Cryst. Chem., 1982, 38, 898 CrossRef.
- T. Osaka, M. Komukae and Y. Makita, J. Phys. Soc. Jpn., 1982, 51, 3409 CrossRef CAS.
- H. V. Koningsveld, Acta Crystallogr., Sect. C: Cryst. Struct. Commun., 1983, 39, 15 CrossRef.
- T. Sato, T. Osaka and Y. Makita, J. Phys. Soc. Jpn., 1983, 52, 3297 CrossRef CAS.
- W. J. Asker, D. E. Scaife and J. A. Watts, Aust. J. Chem., 1972, 25, 2301 CrossRef CAS.
- H. Shigematsu, H. Kasano and H. Mashiyama, J. Phys. Soc. Jpn., 1993, 62, 3929 CrossRef CAS.
- A. R. Lim, Solid State Commun., 2011, 151, 1631 CrossRef CAS.
- A. R. Lim and K.-Y. Lim, J. Solid State Chem., 2013, 200, 227 CrossRef CAS.
- A. R. Lim, Chem. Phys., 2012, 400, 39 CrossRef CAS.
- K. P. Ramesh, N. Devaraj, D. Vijayaraghavan and J. Ramakrishna, Phase Transitions, 1992, 37, 203 CrossRef CAS.
- D. Michel, B. Muller, J. Petersson, A. Trampert and R. Walisch, Phys. Rev. B, 1991, 43, 7507 CrossRef CAS.
- J. L. Koenig, Spectroscopy of Polymers, Elsevier, New York, 1999 Search PubMed.
- Z. Tylczynski and P. Piskunowicz, Phys. Status Solidi A, 1990, 118, 441 CrossRef CAS.
- J. P. Strivastava and A. Kulshreshtha, J. Opt. Soc. Am. B, 1991, 8, 2379 CrossRef.
- A. Agarwal, M. B. Patel, M. Pal and H. D. Bist, Spectrochim. Acta, Part A, 1984, 40, 1063 CrossRef.
- A. M. Gillet, Y. Luspin and G. Hauret, Solid State Commun., 1987, 64, 797 CrossRef CAS.
- N. Bloembergen, E. M. Purcell and R. V. Pound, Phys. Rev., 1948, 73, 679 CrossRef CAS.
- A. R. Lim, AIP Adv., 2016, 6, 35307 CrossRef.
- A. Abragam, The Principles of Nuclear Magnetism, Oxford University Press, 1961 Search PubMed.
| This journal is © The Royal Society of Chemistry 2018 |

