DOI:
10.1039/C8RA01363B
(Paper)
RSC Adv., 2018,
8, 12420-12427
Photoreduction route for Cu2O/TiO2 nanotubes junction for enhanced photocatalytic activity†
Received
12th February 2018
, Accepted 23rd March 2018
First published on 3rd April 2018
Abstract
Here, we synthesized copper(I) oxide and titanium dioxide nanotubes (TNTs) heterojunctions (HJs) by a photoreduction method using a low-power UV lamp without involving any additional steps, such as chemical reduction, surfactant, or protection agents. Transmission electron microscopy, X-ray diffraction, Raman scattering, X-ray photoelectron spectroscopy, diffuse reflectance spectra, and photoluminescence spectroscopy were carried out to verify the formation of a HJ between the Cu2O nanoparticles (Cu2O NPs) and TNTs. The efficiency and the rate of methylene blue photo-degradation over the Cu2O/TNTs HJ were found to be nearly double and triple compared to the isolated TNTs. The enhanced efficiency is attributed to the narrow band gap and defect states caused by the oxygen vacancies in the vicinity of HJs. Moreover, the type II band alignment of Cu2O NPs and TNTs naturally separates the photo-generated carriers and constrains the recombination process owing to the internal electric field across the Cu2O/TNTs interface.
Introduction
Titanium dioxide nanotubes (TNTs) have attracted tremendous scientific and technological interest owing to their peculiar properties for diverse applications.1 However, the photocatalytic efficiency of pure TNTs is low because of their wide band gap and fast recombination of photo-generated electron and hole pairs.1,2 In order to achieve these desired performances, the formation of homojunctions and heterojunctions of TNTs is preferred.3–5 Recently, heterojunctions (HJs) among n-type TNTs and various narrow band gap p-type semiconducting materials with a well aligned band structure is proven to be an effective way of overcoming the drawbacks of TNTs.6–10 This combination also provides a strong driving force for charge carrier separation owing to the strong internal electric field.7,8 Among various p-type semiconducting materials, cuprous oxide (Cu2O) possesses a direct energy gap (Eg ≈ 2.17 eV). The conduction band (CB) and valence band (VB) of Cu2O lie higher than those of TiO2, which is favorable for the efficient separation of photogenerated charge carriers. Moreover, Cu2O is abundant as well as nontoxic in nature, which render it for the photocatalytic activity of TNTs.9,11–17 The idea have motivated many research groups to investigate the photocatalytic activity of loaded Cu2O nanoparticles (NPs) on the surface of TiO2 nanotube array (TNA) synthesized from titanium foils via anodization method.6,12,18–20 Although the direct deposition of Cu2O NPs on TNA is comparatively easier owing to their self-organized orientation, however, Cu2O NPs should be loaded on above the side or on the internal walls of the TNA to enhance its photocatalytic activity.12 Furthermore, the synthesis of TNAs depends on many synthetic parameters (anodizing voltage, reaction time, electrolyte, annealing temperature, etc.) and so far it has been only prepared on titanium surface having a small area, which limits its industrial scale applications.21–23 Meanwhile, there are limited reports available on the direct loading of Cu2O NPs over the entire surface of hydrothermally synthesized-TNTs, which have a high specific surface area.13
Cu2O NPs can be loaded onto TNTs via several approaches. Photoreduction method is one of the low cost as well as high reaction efficiency method that can be applied to practical applications.24,25 Recently, the photoreduction approach was applied to fabricate Cu2O/TiO2 composite.12,18,26–28 For instance, the TNA has been synthesized by anodization Ti foil and the photoreduction approach was applied to load Cu2O NPs over TNA using aqueous Cu2+ ions and by exposing it to a 300 W UV lamp under slightly acidic conditions.12,18 Also, TiO2 nanosheets have been synthesized via hydrothermal method. After mixing these sheets with an aqueous Cu2+ solution in a vacuum pumped quartz conical flask under UV irradiation in argon environment results in Cu2O/TiO2 composite.27
Here, we present the direct loading of Cu2O NPs on hydrothermally synthesized TNTs via a photoreduction method using a low-power UV lamp (low-pressure mercury lamp; λ = 254 nm, 18 W) to form Cu2O/TNTs junction. This process does not involve any additional assistant or chemical reducing agent. The experiments were conducted at ambient conditions and free of pH adjustment with alkali or acid. In addition, we thoroughly discuss the root of the narrowed band gap, broaden absorption region, and enhanced photo-degradation of Cu2O/TNTs. Moreover, the formation of HJ and its photocatalytic mechanisms are also investigated.
Experiment
Chemicals and materials
Commercial TiO2 powder (Merck, 99.99%), sodium hydroxide (NaOH, Merck, 99%), hydrochloric acid at a 37% concentration (HCl, Merck, 99.99%), acetone (C3H6O, ChemSol, 99%), ethanol (C2H6O, ChemSol, 99%), Cu(NO3)2 (Xilong Chemical Co., 99%), methylene blue (MB, JHD Fine Chemicals, 99%), and deionized (DI) water (Puris-Evo water system) were used as received.
Preparation of TNTs by hydrothermal method
The TNTs were prepared by the hydrothermal method reported elsewhere.29 Initially, 1.7 g of TiO2 powder was dissolved in 157 mL of 10 M NaOH. The mixture was then transferred to a stainless autoclave and heated to 135 °C for 24 h. The resulting product was treated with HCl and later washed with deionized water (DI) until an unchanged pH value was achieved. Finally, the product was dried at 100 °C for 5 h.
The preparation of Cu2O/TNTs
The Cu2O/TNTs synthesis procedure is summarized as follows; a 7.53 g of TNT powder was dispersed in 125 mL of 0.02 M Cu(NO3)2 for 45 min. The pH of the mixture was found to be 5 using a portable pH meter (Hanna, Romania). The mixture was then magnetically stirred continuously and exposed to UV light (low-pressure mercury lamp, 18 W, λ = 254 nm) for 24 h. The pH at this step was approximately 6. Subsequently, the product was washed repeatedly with DI water and dried at 100 °C for 5 h.
Material characterization
The phase, chemical composition, and crystal structure of Cu2O/TNTs were examined by X-ray diffraction (XRD; Bruker, D8-Advance 5005) using Cu Kα radiation (λ = 0.154064 nm) and Raman scattering spectroscopy (Jobin Yvon – Labram 300 spectrometer, excitation source; He–Ar laser with λ = 514.5 nm). The morphology of the samples was examined by transmission electron microscopy (TEM; JEOL, JEM 1400). Energy dispersive X-ray spectroscopy (EDS; JEOL, JSM-7401F) was used to determine the weight and atomic percentage of the elements. The chemical states of copper, titanium, and oxygen in the materials were analyzed by X-ray photoelectron spectroscopy (XPS; Leybold, ESCALAB250, Theta Probe XPS system) using an Al Kα monochromatic beam (1486.6 eV). The optical characterization was analyzed by diffuse reflectance spectroscopy (DRS) over the wavelength range of 200–800 nm using an UV-Vis spectrometer (JASCO-V550). Photoluminescence (PL; Horiba Jobin-Yvon Nanolog) analysis with 325 nm excitation source (Xe lamp) was performed at the room temperature to examine the optical and photochemical properties.
Evaluation of the photocatalytic activity
The photocatalytic activity of the materials was evaluated by measuring the level of methylene blue (MB) photodegradation under simulated sunlight irradiation. Initially, 60 mL of MB solution with an initial concentration of 6.25 × 10⁻⁵ (mol L−1) and 0.02 g of catalyst were stirred magnetically for 60 min to reach the adsorption/desorption equilibrium in the dark. The mixture was then irradiated with a simulated Xenon lamp (ABET 230 V, 150 W, 300 nm ≤ λ ≤ 1800 nm) for 150 min. The absorption spectra of MB were recorded at regular intervals (30 min) of irradiation. The experiments to determine the photocatalytic activity were repeated three times. The photocatalytic efficiency was determined using the following formula, η[%] = (C0 − Ct)/C0 × 100, where η is the degradation efficiency, C0 is the absorption intensity of the MB solution after the adsorption/desorption reached the equilibrium, and Ct is the absorption intensity of the MB solution at time t.
Reaction kinetic model
The Langmuir–Hinshelwood model has been used to determine the reaction rate constant for the photocatalytic reaction in gas-phase or in liquid-phase.30 To fit the experimental data, the adsorption can be reduced and the following linear form of Langmuir–Hinshelwood equation (eqn (1)) for the first-order reaction is used31| |
 | (1) |
where C represents the concentration in solution of MB being degraded (mg L−1), C0 is the initial concentration of MB, k is apparent reaction rate constant of ideal first order equation (min−1) and t is photocatalytic reaction time (min).
Results and discussion
Crystallinity and morphology
Fig. 1a shows the X-ray diffraction (XRD) patterns of the TNTs (black) and Cu2O/TNTs (red). The observed XRD peaks of TNTs at 2θ = 25.34°, 37.79°, 48.08°, 55.01°, 62.78°, 68.84°, 70.37°, and 75.11°, corresponding to the (101), (004), (200), (211), (204), (116), (220), and (301) planes, respectively, of the anatase phase of TiO2 (JCPDS no. 21-1272). In addition, other peaks at 2θ = 27.50°, 36.08°, 41.30°, and 54.35° were assigned to the (110), (101), (111), and (211) planes, respectively, of the rutile phase of TiO2 (JCPDS no. 21-1276). The XRD pattern of the Cu2O/TNTs reveals the existence of an additional XRD peak at 29.12°, corresponding to the (110) plane of Cu2O (JCPDS no. 05-0667). Furthermore, the decreasing intensity of the crystal peak of the TNTs can be attributed to the coverage of Cu2O NPs on the TNT surface or be caused by the soak in water and the effect of UV light during the photoreduction process.32
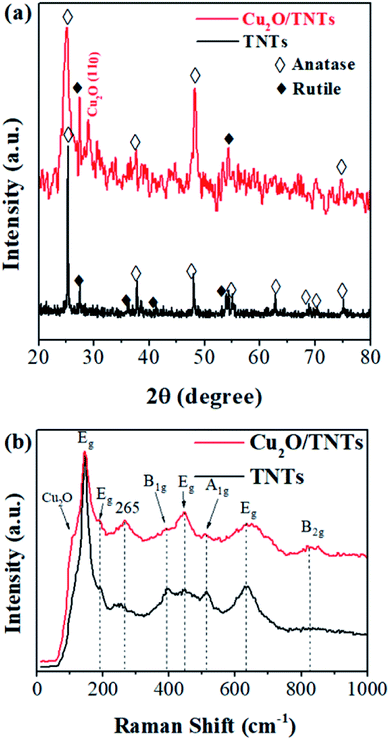 |
| | Fig. 1 (a) XRD patterns and (b) Raman spectra of TNTs and Cu2O/TNTs. | |
Raman scattering was used to further elaborate the phases and individual components in the Cu2O/TNTs composite. The spectrum was taken in 100–1000 cm−1 range. Raman spectrum (Fig. 1b) of isolated TNTs (black) shows six active modes of the anatase phase i.e. Eg (142, 195, and 639 cm−1), B1g (399 cm−1) and A1g + B1g (513 cm−1). Moreover, it also shows two peaks Eg (447 cm−1) and B2g (826 cm−1) corresponding to the rutile phase of TNTs.33–35 The Raman spectrum (red) of the Cu2O/TNTs in the rutile phase revealed a peak at 447 cm−1 (Eg) with higher intensity and an additional peak at 826 cm−1 (B2g). The peak at 110 cm−1 corresponds Cu2O in the composite.36 In addition, the peak at 265 cm−1 can be attributed to the Ti–OH bonds in the TNT tubular structure. The comparatively higher intensity of this peak could be caused by the water absorption by the Ti–O bonds during the photoreduction process.37 The Raman results further confirm the existence of Cu2O in the product.
Fig. 2 shows TEM images of the TNTs and Cu2O/TNTs at different magnifications. The morphology of the TNTs shows typical tubular structure consists of uniform nanotubes (Fig. 2a and c). The outer and inner diameter were found to 8 ± 2 nm and 4 ± 2 nm, respectively. The lengths of TNTs ranged from 200 to 400 nm. Fig. 2b and d exhibit the TEM images of the Cu2O/TNTs, spherical Cu2O NPs (diameter: 6–8 nm) over TNTs, as also confirmed by XRD and Raman results. The Cu2O NPs are evenly showing rather a rough surface owing to the accumulation of small particles distributed over the entire surface of TNTs, which have high specific surface area providing a large number of active sites. Moreover, the tubular morphology of the TNTs is still preserved, as evident in the Fig. 2b and d, respectively. This observation shows that the loading of Cu2O NPs does not induce any change in the TNT morphology after the photoreduction process. Therefore, the Cu2O NPs have been successfully loaded on the TNT surface and the HJ is formed. The chemical composition was analyzed by EDS, as shown in Fig. 2f. The energy dispersive X-ray spectroscopy (EDS) results revealed the presence of Ti, O, and Cu with atomic percentages of 19.67%, 60.46%, and 0.95%, respectively.
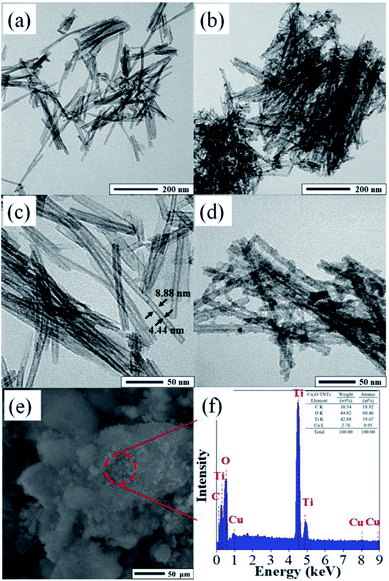 |
| | Fig. 2 TEM images of TNTs (a and c) and Cu2O/TNTs (b and d); (e and f) SEM image and EDS pattern of Cu2O/TNTs. | |
The elemental oxidation states were investigated by high-resolution XPS (HR-XPS). Fig. 3a reveals two peaks at 464.3 eV and 458.6 eV corresponding to the Ti 2p1/2 and Ti 2p3/2 of Ti4+ states in TiO2, respectively.38 Moreover, the percentage of Ti 2p1/2 and Ti 2p3/2 of Ti4+ states in the TNTs are found to be 31.3% and 68.7%, respectively. No significant change in these states was observed in the Cu2O/TNTs (see Table 1) indicating that the loading of Cu2O NPs onto TNTs does not affect the Ti 2p oxidation states of the TNTs. The peaks correspond to O 1s states of O2− species in the lattice (OL), surface hydroxyl oxygen (O–OH) in TNTs was found to be at 530.3 eV and 532.5 eV, respectively (Fig. 3b).39 Moreover, after loading Cu2O NPs, the binding energy of lattice oxygen slightly shifts from 530.3 eV to 530.1 eV and also increase of surface hydroxyl oxygen, indicating the formation of oxygen vacancies (VO), as shown in Table S1†.40 In particular, Table 2 shows that the percentage of OL decreases and that of O–OH increases when Cu2O NPs loaded onto the TNT surface. Aforementioned, the increase of O–OH is derived from photoreduction process as has been confirmed by the increase of the Ti–OH peak at 265 cm−1 in Raman analysis. The increase of O–OH indicates the formation of VO leading to the higher photocatalytic performance.39,40 Furthermore, Fig. 3c shows Cu 2p XPS spectrum of Cu2O/TNTs with Cu 2p1/2 and 2p3/2 lines at the binding energy of about 932.5 eV and 952.5 eV, respectively, which demonstrates the existence of Cu2O on the surface of TNTs.38
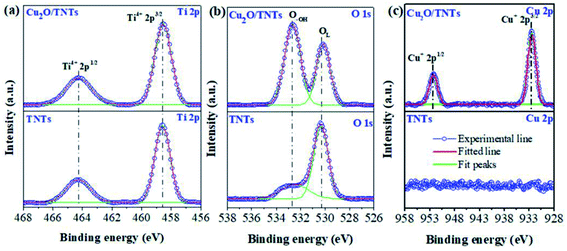 |
| | Fig. 3 High-resolution XPS analysis of Ti 2p (a), O 1s (b), and Cu 2p (c) of TNTs and Cu2O/TNTs. | |
Table 1 Ti content and binding energy of Ti 2p state for TNTs and Cu2O/TNTs samples
| Sample |
Ti4+ 2p1/2 |
Ti4+ 2p3/2 |
| BE (eV) |
Ti content (%) |
BE (eV) |
Ti content (%) |
| TNTs |
464.3 |
31.3 |
458.6 |
68.7 |
| Cu2O/TNTs |
464.3 |
33.9 |
458.6 |
66.1 |
Table 2 O content and binding energy of Ti 2p state for TNTs and Cu2O/TNTs samples
| Sample |
Ti–OH |
TiO2 |
| BE (eV) |
O content (%) |
BE (eV) |
O content (%) |
| TNTs |
532.5 |
48.8 |
530.3 |
51.2 |
| Cu2O/TNTs |
532.6 |
60.9 |
530.1 |
39.1 |
The formation of Cu2O NPs during the photoreduction process can be explained as follows: when the TNTs are excited by UV light, electrons from the valance band (VB) transfer to the conduction band (CB) and form an electron–hole (e–h) pairs. It is well known that Cu2+ can be photoreduced if Cu2+ couple possesses a redox potential more positive than the flat band potential of the CB. The reductions of Cu2+ as following (eqn (2)–(4)).
| |
 | (2) |
| |
 | (3) |
| |
 | (4) |
Therefore, the formation of Cu2O NPs on TNTs can be interpreted as follows;  is more positive than the flat band potential of the CB that is about −0.56 V, and therefore, Cu2+ can be photoreduced to Cu+. The redox potentials of two other copper couples are more negative than the flat band potential of the CB, so Cu2+ cannot be photoreduced to Cu, and Cu+ cannot be photoreduced to Cu.41,42 The stability of Cu2O is shown in Fig. S2–4.†
Optical characterization
Fig. 4 shows the DRS results of the TNTs (black) and Cu2O/TNTs (red), respectively. The energy band structure of TNTs suggests strong optical absorption at the short wavelength range compared to long wavelength. The absorption edge at 402 nm is attributed mainly to the electron transitions from the VB to CB (band-to-band transition, O 2p → Ti 3d orbital). In contrast, the Cu2O/TNTs shows three absorption features. The absorption edge corresponds to an interband transition significantly red shifts to 441 nm. The absorption at wavelengths than 650 nm is consistent with the intraband absorption of Cu2O NPs.43
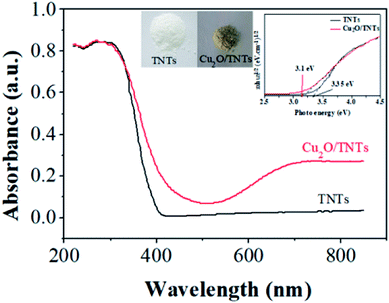 |
| | Fig. 4 UV-Vis diffuse reflectance spectra of the TNTs and Cu2O/TNTs. | |
The increase in optical absorption observed in the 700–800 nm range can be understood in terms of d–d transition of copper ions.44–47 It does not enhance the number of photogenerated carriers but rather increase the carrier lifetime.48 Clearly, the appearance of an optical absorption shoulder in the visible region leads to two-phase absorption i.e. UV and visible. Additionally, the inserted digital photographs (Fig. S3†) of the TNTs and Cu2O/TNTs samples show that after the photoreduction process, the color of the resulting powder changes from white for TNTs to light yellow for Cu2O/TNTs. The observation shows a striking contrast to the white color of pure TNTs. This result indicates that the photoreduction process affected the surface properties of TNTs. As a result, this change of the color could be induced an enhanced photo-absorption.
The band gap energy of the materials can be approximated using the following equation:
where
α,
ν,
A and
Eg are absorption coefficient, Plank's constant, light frequency, a constant, and band gap energy, respectively.
49
It is clear from eqn (5) that the band gap Eg can be obtained by extrapolating to zero a linear fit to a plot of (αhν)2 against hν (often referred to as a Tauc plot). The estimated optical band gaps of the TNTs and Cu2O/TNTs were found to be 3.35 eV and 3.1 eV, respectively. The extended photoactive wavelength up to 441 nm is the result of the band gap reduction of the Cu2O/TNTs HJ caused by hybridization of the O 2p and Ti 3d orbital and/or also the presence of the mid-gap energy states (defect states).50–52 The DRS result of Cu2O/TNTs show this reduction of TNTs band edge structure and the presence of Cu2O NPs allowing intraband transition, which induces a higher lifetime of photogenerated carriers, as well as extending of the HJ absorption region.
The PL spectrum acquired from TNTs shows three emission peaks at 438 nm (2.83 eV), 532 nm (2.33 eV), and 632 nm (1.96 eV) respectively, as depicted in bottom part of Fig. 5a. These peaks can be attributed to the excitonic transitions from TiO2 intrinsic defects as the self-trapped exciton (STE) and surface defect states including oxygen vacancies (VO,S), O− vacancies  , as schematically shown in Fig. 5b.53–55 Therein, the STE is caused by the interaction of electrons in the CB localized on the Ti3d orbital with holes in the O2p orbital of TNTs.56 The existence of
  defects can be explained in terms of holes in the VB reacting with O2− in the TNT structure to produce ˙O− (eqn (6)), which then immediately react with each other to release O2 on the surface (eqn (7)).57 The peak located at ∼1.96 eV corresponding to the range of wavelength in the visible light region is suggested to be VO,S defects.58 The presence of these defects was derived by reactions in the hydrothermal environment, which is well known to cause defects in the material structure. The percentages of the PL peaks at 2.83 eV, 2.33 eV, and 1.96 eV were 26.84%, 42.01%, and 31.15% (see Table 3), respectively.
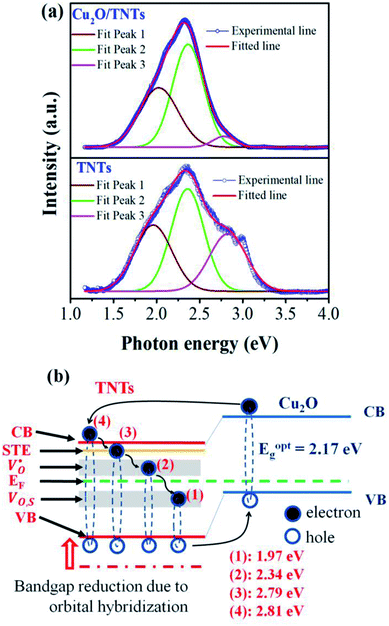 |
| | Fig. 5 Photoluminescence spectra of the TNTs and Cu2O/TNTs (a); schematic illustration of the change of the band gap of heterojunction structure of Cu2O/TNTs (b). | |
Table 3 Energy and relative portion of the electron–hole recombination transitions in the TNTs and Cu2O/TNTs samples
| TNTs |
Cu2O/TNTs |
| Position |
Area |
% |
Position |
Area |
% |
| 2.83 |
886.91 |
26.84 |
2.79 |
645.49 |
4.13 |
| 2.36 |
1388.14 |
42.01 |
2.37 |
8716.06 |
55.77 |
| 1.96 |
1029.11 |
31.15 |
1.97 |
6267.51 |
40.10 |
The PL spectrum from Cu2O/TNTs (up part of Fig. 5a) is the superposition of three similar emissions at 446 nm (2.79 eV), 529 nm (2.34 eV), and 629 nm (1.97 eV), respectively. However, the peak arising at 1.97 eV, corresponds to VO,S defects, is substantially higher than that of the TNTs after loading Cu2O NPs. The increase of VO,S defects provides trap sites for charge carriers and contributes to the reduction of the band gap, as be shown in DRS result.51 Moreover, the radiative combination of the e–h pair in STE is not favorable, leading to the relatively high photocatalytic activity of TNTs.59
Photocatalytic activity of TNTs and Cu2O/TNTs
The photocatalytic activity of the TNTs and Cu2O/TNTs were evaluated through the methylene blue (MB) degradation ability for 150 min under sunlight, as shown in Fig. 6a. It shows that the photodegradation of MB on the Cu2O/TNTs is very fast for the initial 30 min and then gradually decreases, and almost completely decomposes the MB after 150 min of the sunlight irradiation. The MB photodegradation efficiency of Cu2O/TNTs is nearly double compared to isolated TNTs after 150 min of exposure (81.70% and 43.73% for Cu2O/TNTs and TNTs, respectively). Moreover, the phenol photodegradation by materials was observed to confirm the photocatalytic performance of materials with non-color pollutant (Fig. S1†). For a quantitative comparison, we used the Langmuir–Hinshelwood model to describe the rates of the MB photodegradation over the materials. Notably, the initial MB photodegradation was recognized to follow mass transfer controlled first-order kinetics comparatively as a result of low-concentration target pollutants, as evidenced by the linear plot of ln(C/C0) versus photocatalytic reaction time t. Fig. 6b shows that the initial rate constant of MB degradation over Cu2O/TNTs for the first 30 min under sunlight irradiation was estimated as 0.0329 min−1, which was three times faster than that over TNTs (0.0128 min−1). Fig. 6c and d exhibit that the absorption spectrum of MB negligibly changed after 150 min under sunlight irradiation, while the absorption spectrum of MB over Cu2O/TNTs drastically changed, particularly, the typical absorption peak of MB at 664 nm strongly decreased after 150 min. These results confirmed that the abasement of MB absorption peak intensity was caused by the photodegradation of catalyst not by photolysis of MB. These observations indicate that the HJ formation significantly affected the photocatalytic activity of the material because of its influences on the photocatalyst microstructure and band structure as evidenced by XRD, TEM, XPS, DRS, and PL characterizations.
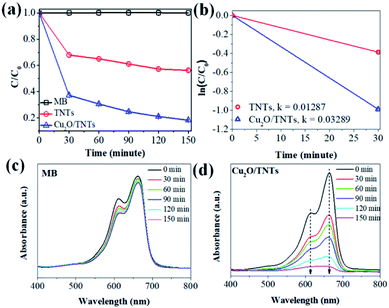 |
| | Fig. 6 (a) Photocatalytic activity of the TNTs and Cu2O/TNTs under sunlight irradiation, (b) plots of the dependence of concentration on irradiation time for the first 30 m, (c and d) the absorption spectra of MB and MB over Cu2O/TNTs for 150 minutes under sunlight irradiation. | |
Fig. 7 schematically explain the mechanism of photocatalysis of Cu2O/TNTs p–n junction under sunlight irradiation. When a visible light ray interacts with Cu2O/TNTs, it excites the narrow gap Cu2O NPs and generates e–h pairs in respective CB and VB, respectively (eqn (8)). The photo-induced electrons in the CB of p-type Cu2O NPs easily transfer to n-type TNTs due to the energy gradient owing to the type-II band alignment (eqn (9)) and creates an internal electric field across the interface. The induced electric field across the interface limits the charge recombination. Similarly, under UV irradiation excites TNTs (eqn (10)). The holes in the VB of TNTs migrate to the VB of the Cu2O NPs (eqn (11)) also contribute to the charge separation. The charge separation phenomenon produces enough electrons and holes for the redox reaction, which provides enough active radicals for the photocatalytic activity, such as ˙O−2 and ˙OH (eqn (12)–(15)). The active radicals continuously react with H2O and also with each other to further form the active radicals for decomposition (eqn (16) and (17)). The ˙OH radical is a strong oxidizing agent that can decompose the organic dye (eqn (18)). Moreover, the defects at the Cu2O/TNTs HJ also play a vital role in the enhancement of photocatalytic activity by reducing the band edge and inducing new defect levels, which serve as traps sites for the photo-induced charges and constrain the e–h recombination.60 Furthermore, the one-dimensional TNTs act as a directional charge transport channel enhancing transport properties.
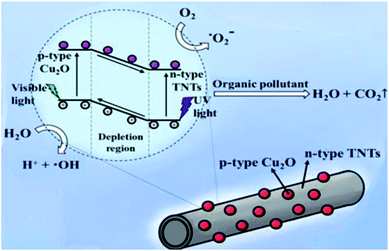 |
| | Fig. 7 Schematic diagram of the mechanism of the photocatalytic activity of the Cu2O/TNTs heterojunction structure under sunlight irradiation. | |
The following detailed reactions are proposed for the photocatalytic activity of Cu2O/TNTs against MB:
| |
 | (8) |
| | |
Cu2O (eCB−) + TNTs → Cu2O + TNTs(eCB−)
| (9) |
| |
 | (10) |
| | |
TNTs(hVB+) + Cu2O → TNTs + Cu2O(hCB+)
| (11) |
| | |
Cu2O(eCB−) + O2 → Cu2O + ˙O−2
| (12) |
| | |
TNTs(eCB−) + O2 → TNTs + ˙O−2
| (13) |
| | |
Cu2O(hVB+) + H2O → Cu2O + H+ + ˙OH
| (14) |
| | |
TNTs(hVB+) + H2O → TNTs + H+ + ˙OH
| (15) |
| | |
˙OH + H2O → ˙HO2 + OH−
| (16) |
| | |
˙HO2 + H2O → H2O2 + ˙OH
| (17) |
| | |
˙OH + MB → CO2 + H2O
| (18) |
Conclusions
A Cu2O/TNTs heterojunction showing approximately double photocatalytic efficiency compared to the isolated TNTs prepared by a simple surfactant-free photoreduction method. The significant enhancement in the photocatalytic efficiency can simply be understood in terms of the narrowed band gap and improved light absorbance by the induction of additional low energy states (below the CB edge) due to the oxygen vacancies. Additionally, owing to the type II band alignment between the n-type TNTs and p-type Cu2O NPs produce internal electric field across the interface and consequently constrain the charge recombination process across the interface. This phenomenon produces significant number of electrons and holes for the redox reaction beneficial for photocatalytic activity. Moreover, our synthetic approach of Cu2O/TNTs junction by the photoreduction method could pave the way of removing organic dyes on an industrial scale.
Conflicts of interest
There are no conflicts to declare.
Acknowledgements
V. V. Pham would like to thank Prof. Bach Thang Phan (University of Science, VNU-HCM, Vietnam) and BK21 Plus Program for supporting this study. Y. S. Kim acknowledges support from the Priority Research Centers Program (2009-0093818), the Basic Science Research Programs (2017R1E1A1A01075350), and the Basic Research Lab Program (2014R1A4A1071686) through the National Research Foundation of Korea (NRF), funded by the Korean government.
Notes and references
- X. Chen and S. S. Mao, Chem. Rev., 2007, 107, 2891–2959 CrossRef CAS PubMed.
- J. Schneider, M. Matsuoka, M. Takeuchi, J. Zhang, Y. Horiuchi, M. Anpo and D. W. Bahnemann, Chem. Rev., 2014, 114, 9919–9986 CrossRef CAS PubMed.
- L. Pan, S. Wang, J. Xie, L. Wang, X. Zhang and J.-J. Zou, Nano Energy, 2016, 28, 296–303 CrossRef CAS.
- P. V. Viet, T. H. Huy, N. X. Sang, C. M. Thi and L. V. Hieu, J. Mater. Sci., 2018, 53, 3364–3374 CrossRef CAS.
- P. V. Viet, B. T. Phan, D. Mott, S. Maenosono, T. T. Sang, C. M. Thi and L. V. Hieu, J. Photochem. Photobiol., A, 2018, 352, 106–112 CrossRef CAS.
- M. Wang, L. Sun, Z. Lin, J. Cai, K. Xie and C. Lin, Energy Environ. Sci., 2013, 6, 1211 CAS.
- H. Wang, L. Zhang, Z. Chen, J. Hu, S. Li, Z. Wang, J. Liu and X. Wang, Chem. Soc. Rev., 2014, 43, 5234–5244 RSC.
- M. Reza Gholipour, C. T. Dinh, F. Beland and T. O. Do, Nanoscale, 2015, 7, 8187–8208 RSC.
- J. Fu, S. Cao and J. Yu, J. Materiomics, 2015, 1, 124–133 CrossRef.
- G. Dai, J. Yu and G. Liu, J. Phys. Chem. C, 2011, 115, 7339–7346 CAS.
- L. Liu, W. Yang, Q. Li, S. Gao and J. K. Shang, ACS Appl. Mater. Interfaces, 2014, 6, 5629–5639 CAS.
- Y. Hou, X. Y. Li, Q. D. Zhao, X. Quan and G. H. Chen, Appl. Phys. Lett., 2009, 95, 093108 CrossRef.
- T. Han, D. Zhou and H. Wang, Powder Technol., 2016, 301, 959–965 CrossRef CAS.
- Z. Wang, Y. Liu, D. J. Martin, W. Wang, J. Tang and W. Huang, Phys. Chem. Chem. Phys., 2013, 15, 14956–14960 RSC.
- W.-Y. Cheng, T.-H. Yu, K.-J. Chao and S.-Y. Lu, ChemCatChem, 2014, 6, 293–300 CrossRef CAS.
- S. Wang, X. Zhang, L. Pan, F.-M. Zhao, J.-J. Zou, T. Zhang and L. Wang, Appl. Catal., B, 2015, 164, 234–240 CrossRef CAS.
- L. Pan, J.-J. Zou, T. Zhang, S. Wang, Z. Li, L. Wang and X. Zhang, J. Phys. Chem. C, 2013, 118, 16335–16343 Search PubMed.
- Y. Hou, X. Li, X. Zou, X. Quan and G. Chen, Environ. Sci. Technol., 2009, 43, 858–863 CrossRef CAS PubMed.
- L. Xiang, J. Ya, F. Hu, L. Li and Z. Liu, Appl. Phys. A: Mater. Sci. Process., 2017, 123(3), 60 CrossRef.
- S. Zhang, C. Liu, X. Liu, H. Zhang, P. Liu, S. Zhang, F. Peng and H. Zhao, Appl. Microbiol. Biotechnol., 2012, 96, 1201–1207 CrossRef CAS PubMed.
- H. Li, L. Cao, W. Liu, G. Su and B. Dong, Ceram. Int., 2012, 38, 5791–5797 CrossRef CAS.
- G. K. Mor, O. K. Varghese, M. Paulose, N. Mukherjee and C. A. Grimes, J. Mater. Res., 2011, 18, 2588–2593 CrossRef.
- H. P. Quiroz and A. Dussan, J. Appl. Phys., 2016, 120, 051703 CrossRef.
- Y. Zhou, C. Y. Wang, Y. R. Zhu and Z. Y. Chen, Chem. Mater., 1999, 11, 2310–2312 CrossRef CAS.
- M. K. Abyaneh, D. Paramanik, S. Varma, S. W. Gosavi and S. K. Kulkarni, J. Phys. D: Appl. Phys., 2007, 40, 3771–3779 CrossRef CAS.
- M. K. I. Senevirathna, P. K. D. D. P. Pitigala and K. Tennakone, J. Photochem. Photobiol., A, 2005, 171, 257–259 CrossRef CAS.
- K. Dong, J. He, J. Liu, F. Li, L. Yu, Y. Zhang, X. Zhou and H. Ma, J. Mater. Sci., 2017, 52, 6754–6766 CrossRef CAS PubMed.
- X. An, H. Liu, J. Qu, S. J. A. Moniz and J. Tang, New J. Chem., 2015, 39, 314–320 RSC.
- P. V. Viet, B. T. Phan, L. V. Hieu and C. M. Thi, J. Nanosci. Nanotechnol., 2015, 15, 5202–5206 CrossRef CAS PubMed.
- H. Wang, Z. Wu, W. Zhao and B. Guan, Chemosphere, 2007, 66, 185–190 CrossRef CAS PubMed.
- H. S. Son, S. J. Lee, I. H. Cho and K. D. Zoh, Chemosphere, 2004, 57, 309–317 CrossRef CAS PubMed.
- Y. Li, B. Wang, S. Liu, X. Duan and Z. Hu, Appl. Surf. Sci., 2015, 324, 736–744 CrossRef CAS.
- T. Ohsaka, F. Izumi and Y. Fujiki, J. Raman Spectrosc., 1978, 7, 321–324 CrossRef.
- D. Georgescu, L. Baia, O. Ersen, M. Baia and S. Simon, J. Raman Spectrosc., 2012, 43, 876–883 CrossRef CAS.
- S. P. S. Porto, P. A. Fleury and T. C. Damen, Phys. Rev., 1967, 154, 522–526 CrossRef CAS.
- Y. Liu, F. Ren, S. Shen, Y. Fu, C. Chen, C. Liu, Z. Xing, D. Liu, X. Xiao, W. Wu, X. Zheng, Y. Liu and C. Jiang, Appl. Phys. Lett., 2015, 106, 123901 CrossRef.
- L. Qian, Z.-L. Du, S.-Y. Yang and Z.-S. Jin, J. Mol. Struct., 2005, 749, 103–107 CrossRef CAS.
- J. E. Moulder, W. F. Stickle, P. E. Sobol and K. D. Bomben, in Handbook of X-Ray Photoelectron Spectroscopy, ed. J. Chastain and R. C. Eing Jr, Physical Electronics Inc., Minnesota, USA, 1995, vol. 93. Search PubMed.
- B. Xin, D. Ding, Y. Gao, X. Jin, H. Fu and P. Wang, Appl. Surf. Sci., 2009, 255, 5896–5901 CrossRef CAS.
- B. Bharti, S. Kumar, H. N. Lee and R. Kumar, Sci. Rep., 2016, 6, 32355 CrossRef CAS PubMed.
- S. Sakthivel, M. C. Hidalgo, D. W. Bahnemann, S. U. Geissen, V. Murugesan and A. Vogelpohl, Appl. Catal., B, 2006, 63, 31–40 CrossRef CAS.
- Y.-h. Xu, D.-h. Liang, M.-l. Liu and D.-z. Liu, Mater. Res. Bull., 2008, 43, 3474–3482 CrossRef CAS.
- D. Wang, X. Pan, G. Wang and Z. Yi, RSC Adv., 2015, 5, 22038–22043 RSC.
- Z. Luo, H. Jiang, D. Li, L. Hu, W. Geng, P. Wei and P. Ouyang, RSC Adv., 2014, 4, 17797 RSC.
- M. Arai, S. Nishiyama, S. Tsuruya and M. Masai, J. Chem. Soc., Faraday Trans., 1996, 92, 2631 RSC.
- J. Yu and J. Ran, Energy Environ. Sci., 2011, 4, 1364 CAS.
- M. Liu, X. Qiu, K. Hashimoto and M. Miyauchi, J. Mater. Chem. A, 2014, 2, 13571–13579 CAS.
- T. Morikawa, Y. Irokawa and T. Ohwaki, Appl. Catal., A, 2006, 314, 123–127 CrossRef.
- A. Murphy, Sol. Energy Mater. Sol. Cells, 2007, 91, 1326–1337 CrossRef CAS.
- H. Yin, X. Wang, L. Wang, Q. N. and H. Zhao, J. Alloys Compd., 2015, 640, 68–74 CrossRef CAS.
- J. Li, X. Xu, X. Liu, C. Yu, D. Yan, Z. Sun and L. Pan, J. Alloys Compd., 2016, 679, 454–462 CrossRef CAS.
- X. Chen, L. Liu, P. Y. Yu and S. S. Mao, Science, 2011, 331, 746–750 CrossRef CAS PubMed.
- Y. Lei, L. D. Zhang, G. W. Meng, G. H. Li, X. Y. Zhang, C. H. Liang, W. Chen and S. X. Wang, Appl. Phys. Lett., 2001, 78, 1125–1127 CrossRef CAS.
- Y. Du, W. L. Cai, C. M. Mo, J. Chen, L. D. Zhang and X. G. Zhu, Appl. Phys. Lett., 1999, 74, 2951–2953 CrossRef CAS.
- W. Chen, H. Tang, C. Shi, J. Deng, J. Shi, Y. Zhou, S. Xia, Y. Wang and S. Yin, Appl. Phys. Lett., 1995, 67, 317–319 CrossRef CAS.
- A. Aronne, M. Fantauzzi, C. Imparato, D. Atzei, L. De Stefano, G. D'Errico, F. Sannino, I. Rea, D. Pirozzi, B. Elsener, P. Pernice and A. Rossi, RSC Adv., 2017, 7, 2373–2381 RSC.
- L.-B. Xiong, J.-L. Li, B. Yang and Y. Yu, J. Nanomater., 2012, 2012, 1–13 CrossRef.
- L. Z. Liu, J. Q. Xu, X. L. Wu, T. H. Li, J. C. Shen and P. K. Chu, Appl. Phys. Lett., 2013, 102, 031916 CrossRef.
- J. Liqiang, Q. Yichun, W. Baiqi, L. Shudan, J. Baojiang, Y. Libin, F. Wei, F. Honggang and S. Jiazhong, Sol. Energy Mater. Sol. Cells, 2006, 90, 1773–1787 CrossRef.
- J. Liu, J. Ke, D. Li, H. Sun, P. Liang, X. Duan, W. Tian, M. O. Tade, S. Liu and S. Wang, ACS Appl. Mater. Interfaces, 2017, 9, 11678–11688 CAS.
Footnote |
| † Electronic supplementary information (ESI) available. See DOI: 10.1039/c8ra01363b |
|
| This journal is © The Royal Society of Chemistry 2018 |
Click here to see how this site uses Cookies. View our privacy policy here.  Open Access Article
 *a,
Dai Phat Bui
 a,
Hong Huy Tran
 a,
Minh Thi Caob,
Tri Khoa Nguyenc,
Yong Soo Kim
 *c and
Van Hieu Lea


 is more positive than the flat band potential of the CB that is about −0.56 V, and therefore, Cu2+ can be photoreduced to Cu+. The redox potentials of two other copper couples are more negative than the flat band potential of the CB, so Cu2+ cannot be photoreduced to Cu, and Cu+ cannot be photoreduced to Cu.41,42 The stability of Cu2O is shown in Fig. S2–4.†
 , as schematically shown in Fig. 5b.53–55 Therein, the STE is caused by the interaction of electrons in the CB localized on the Ti3d orbital with holes in the O2p orbital of TNTs.56 The existence of
  defects can be explained in terms of holes in the VB reacting with O2− in the TNT structure to produce ˙O− (eqn (6)), which then immediately react with each other to release O2 on the surface (eqn (7)).57 The peak located at ∼1.96 eV corresponding to the range of wavelength in the visible light region is suggested to be VO,S defects.58 The presence of these defects was derived by reactions in the hydrothermal environment, which is well known to cause defects in the material structure. The percentages of the PL peaks at 2.83 eV, 2.33 eV, and 1.96 eV were 26.84%, 42.01%, and 31.15% (see Table 3), respectively.


