 Open Access Article
Fabrication and characterization of a novel self-assembling micelle based on chitosan cross-linked pectin–doxorubicin conjugates macromolecular pro-drug for targeted cancer therapy
Zhi-Ping Li†
a,
Ming-Chao Jiang†a,
Bo Chen†ac,
Pei Gaod,
Sa Yanga,
Yu-Feng Liua,
Peng-Ju Yea,
Dong-Xiu He ab,
Hong-Lin Huangab and
Cui-Yun Yu
 *ab
*ab
aHunan Province Cooperative Innovation Center for Molecular Target New Drug Study, University of South China, Hengyang, 421001, China. E-mail: yucuiyunusc@hotmail.com; Fax: +86 734 8282914; Tel: +86 734 8282614
bLearning Key Laboratory for Pharmacoproteomics of Hunan Province, Institute of Pharmacy & Pharmacology, University of South China, Hengyang, China
cHengyang Hospital of Traditional Chinese Medicine, Hengyang, China
dChemistry Department, Eastern Kentucky University, Richmond, KY, USA
First published on 28th March 2018
Abstract
Cancer is one of the leading causes of morbidity and mortality worldwide. Doxorubicin is one of the most effective anticancer drugs approved by FDA. However, like all the other anticancer drugs, the efficacy of DOX is associated with high systemic toxicity to healthy tissues. In this study, chitosan cross-linked pectin–doxorubicin conjugates macromolecular pro-drug (CS-PDC-M) was prepared to enhance the therapeutic effects on liver cancer. CS-PDC-M was characterized in terms of size, size distribution, zeta potential, scanning electron microscope (SEM) and drug loading content. The CS-PDC-M achieved prolonged releasing ability was demonstrated by the in vitro drug release and in vitro cellular uptake assay. Biocompatibility of CS-PDC-M was screened by hemolysis activity examination, BSA adsorption test and cell viability evaluation in endothelial cells and LO2 cells. The CS-PDC-M achieved significantly high antitumor efficiency and targeting efficiency, which was demonstrated by the in vitro MTT assay and cellular targeting assay toward HepG2 cells, MCF-7 cells and A549 cells. The in vivo antitumor efficacy of CS-PDC-M was studied in athymic BALB/c nude mice bearing HepG2 cell xenografts. The organ damage assays of CS-PDC-M was studied in SD rats. Compared with that of free DOX and PDC-M, the CS-PDC-M exhibited higher antitumor efficacy and lower toxicity, implying that CS-PDC-M is a highly promising drug delivery system for hepatocellular carcinoma treatment.
Introduction
According to the United States Cancer Statistics Incidence and Mortality Web-based Report, cancer is a worldwide public health threat, and one of the leading causes of death.1 To date, the conventional treatment on cancers is the removal of the tumor followed by extensive chemotherapy, radiotherapy, and immunotherapy. Chemotherapy remains the mainstay of treatment, and systemic chemotherapeutic agents include doxorubicin (DOX),2–4 5-fluorouracil,5,6 paclitaxel,7–9 and camptothecin.10DOX, an important anthracycline derivative11 and a broad spectrum anticancer drug12 approved by FDA, is widely used in oncology.13–15 Intracellularly, DOX intercalates into the DNA duplex and disrupts the replication and transcription process in cancer cells, leading to cell apoptosis.16,17 Although highly effective in cancer therapy, DOX is strictly limited in its clinical use due to its poor target selectivity, and serious side effects such as cardiotoxicity and cytotoxicity to normal tissues.18,19 Various polymer-based drug delivery systems with good biocompatibility and biodegradability have been developed in order to reduce side effects and improve the therapeutic.3,16 There are several types of polymer-based drug delivery systems that could be exploited for the relevant purposes, including polymer–drug conjugates,20–22 micelles,23,24 and vesicles.25–27
Pectin-doxorubicin conjugated macromolecule prodrug (PDC-M) nanoparticles, a novel amphiphilic core–shell micelle, was successfully synthesized. The PDC-M demonstrated a longer half-life, better hydrophilicity and lower toxicity compared to DOX.28 The surface charge of PDC-M is negative because the pectin contained multiple negatively charged saccharides carboxylic.29 The incorporation of positive charge onto the surface of polymer materials can effectively improve the cell attachment capacity of the polymer materials without a negative effect on cell viability instead. Moreover, the adhesion of cell properties can be significantly promoted with the positive charge modifications on the surface of polymer-based drug delivery systems.30,31 It is necessary to find a material to modify the surface of PDC-M.
Chitosan (CS), generally used as biomaterial in pharmaceuticals, is a natural positively charged polysaccharide.32,33 Under acidic condition, the amino groups of CS are protonated and become positively charged species.34 In addition, CS is widely used in pharmaceutical and biomedical applications because of its favorable properties: biocompatibility, biodegradability, non-toxicity, antibacterial activity35,36 and low-immunogenicity.37
In this work, CS-PDC-M was synthesized and prepared through incorporating the positively charged chitosan onto the PDC-M surface with negatively charged pectin. The physicochemical properties and characteristics of CS-PDC-M, including morphology, particle size, zeta potential, in vitro drug release were investigated in this paper. Biocompatibility of CS-PDC-M was screened by hemolysis activity examination, BSA adsorption test and cell viability evaluation in endothelial cells and LO2 cells. The in vitro antitumor effects of CS-PDC-M were evaluated by the MTT assay, cellular targeting assay toward HepG2 cells, MCF-7 cells and A549 cells. Cellular uptake was evaluated in HepG2 cells. Finally, in vivo tumor growth inhibition was analyzed in tumor-bearing athymic BALB/c nude mice bearing HepG2 cell xenografts. The organ damage assays of CS-PDC-M was studied in SD rats.
Materials and methods
Materials
Chitosan (CS, Biomedical Grade, Mw = 5 × 10⁵, degree of deacetylation is 91%) were supplied by Golden-Shell Pharmaceutical Co., LTD, Zhejiang, China. Low methoxyl pectin (pectin from citrus peel, esterification degree less than 50%, galacturonic acid 75.0%, Mw = 1.18 × 10⁵) and doxorubicin (DOX) were obtained from the Milky Way Chemical Co., Ltd. Hubei. Dulbecco's modified Eagle's medium (DMEM) and Fetal Bovine Serum (FBS) were obtained from Gibco (America). [3-4,5-Dimethylthiazol-2-yl]-2,5-diphenyltetrazolium bromide (MTT) was purchased from Amresco (Solon, OH). Human Umbilical Vein Endothelial Cells (HUVEC), LO2 cells, HepG2 cells, MCF-7 cells and A549 cells were obtained from Shanghai Life Sciences Academe, Shanghai, China. BALB/c nude mice were obtained from Beijing Vital River Laboratory Animal Technology Co., Ltd. Sprague-Dawley (SD) rats were supplied by Laboratory Animal Center, University of South China, China. All animals were kept in a pathogen-free environment and fed ad lib. The procedures for care and use of animals were approved by the Ethics Committee of the University of South China and all applicable institutional and governmental regulations concerning the ethical use of animals were followed. Human fresh blood is supplied by the Hengyang Hospital of Traditional Chinese Medicine. The research adhered to the tenets of The Declaration of Helsinki. The Ethics Committee of Hengyang Hospital of Traditional Chinese approved this study. Informed consent was obtained from all subjects before study. All other reagents were of analytical grade. All solutions were freshly prepared using Millipore-Q water, Billerica, MA, USA.Fabrication of chitosan cross-linked PDC-M
According to our previous research,28 the synthesis of PDC macromolecular pro-drug has been described by using the condensation reaction of the amide. Briefly, 50 mL low-methoxylated pectin solution (2 mg mL−1; pH 5.0) and 50 mL DOX solution (1 mg mL−1) was mixed. Then a mixture of EDC (100 mg) and NHS (30 mg) was added and maintained for 8 h at 50 °C under magnetic stirring at 600 rpm. The core–shell PDC was fabricated during this process. Then the obtained PDC were washed with dehydrated alcohol and dialyzed in water for purified. To cross-link the PDC-M with chitosan, 1 mL chitosan solution (1 mg mL−1) was added dropwise to 10 mL PDC, at an average rate of 2 mL min−1, using a nozzle with a 0.8 mm inner diameter. The CS-PDC-M was fabricated with magnetic stirred for 8 h. The resulting viscous suspension was centrifuged at 4000 rpm for 10 min to separate the chitosan-coated nanoparticles. Then the obtained CS-PDC-M was lyophilized.Drug loading content and encapsulation efficiency
The drug loading content (LC) and encapsulation efficiency (EE) of CS-PDC-M were evaluated by spectrometer method. Briefly, CS-PDC-M contained dehydrated alcohol was centrifuged at 12![[thin space (1/6-em)]](https://www.rsc.org/images/entities/char_2009.gif) 000 rpm for 15 min. In the preparation of the CS-PDC-M, all of the supernatants and washings were collected and combined. The amount of drug in the supernatant was determined by UV-vis spectrophotometer (UV-1750, Shimadzu, Japan) at 480 nm. The concentration of the remaining DOX in the solution could be calculated through a calibration curve. The LC (%) and EE (%) of the CS-PDC-M were calculated on the basis of the following equation:
000 rpm for 15 min. In the preparation of the CS-PDC-M, all of the supernatants and washings were collected and combined. The amount of drug in the supernatant was determined by UV-vis spectrophotometer (UV-1750, Shimadzu, Japan) at 480 nm. The concentration of the remaining DOX in the solution could be calculated through a calibration curve. The LC (%) and EE (%) of the CS-PDC-M were calculated on the basis of the following equation:
 | (1) |
 | (2) |
In vitro characterization
The zeta potential and particle size distribution of CS-PDC-M in the aqueous solution before drug release were analysed using dynamic light scattering technique by a Zetasizer nanoparticle analyser (Nano ZS-90, Malvern Instruments). The morphologies of CS-PDC-M were screened by field emission scanning electron microscopy (FE-SEM, Hitachi S-4800, Hitachi Limited, Japan). The physical stability of CS-PDC-M in the aqueous solution was monitored for 5 days in terms of the size.In vitro drug release study
The drug release from the CS-PDC-M in vitro was evaluated using the dialysis method. During the process, CS-PDC-M (2 mL) was put into a dialysis bag. Then, the dialysis tubes were immersed into 30 mL of aqueous medias with different pH values (Tris–HCl buffer with a pH of 5.0, 6.8 and 7.4), and stirred at 200 rpm at 37 °C for 240 h. At the predetermined time points, the entire buffer solutions in the outer tube were drawn out and replaced with 30 mL of fresh buffer solution. The DOX concentration in the removed buffer solution was subsequently detected using a UV-vis spectrophotometer by recording the optical density at 480 nm. Finally, the cumulative percentage of drug release at a specific time interval was calculated on the basis of the total amount of DOX loading measured at the beginning of this study.Hemolysis activity examinations
Human fresh blood was first centrifuged at 5000 rpm for 10 min to remove the supernatant and then was successively rinsed with 0.9% NaCl and diluted to 2% (v/v). Different concentrations of PDC-M and CS-PDC-M (19–304 μg mL−1) which have been adjusted to isotonic were mixed with 0.5 mL of 2% red blood cell suspensions. The deionized water was used as a positive control and 0.9% NaCl was used as a negative one. The mixtures were incubated at 37 °C for 4 h and then were centrifuged at 3000 rpm for 5 min. The absorbance of the supernatants was recorded using a microplate reader (Labsystems Multiskan, Biochromatic Labsystem, Osaka, Japan) at 540 nm. The hemolysis ratio (HR) was calculated according to the eqn (3):
 | (3) |
In eqn (3), Asample, Anegative control and Apositive control were denoted as the absorbance of CS-PDC-M, negative and positive controls, respectively.
Bovine serum albumin (BSA) adsorption
To evaluate the adsorption of bovine serum albumin (BSA), 0.5 mL of PDC-M, CS-PDC-M and free DOX were mixed with 5 mL of BSA (0.5 mg mL−1) at room temperature. At specified time intervals, a small portion of this solution was removed and measured using the Bradford assay by UV-vis spectrophotometer at a wavelength of 595 nm. The amount of BSA adsorbed in samples was calculated from a standard calibration curve. All experiments were performed in triplicate at room temperature.Cell viability assay
The in vitro cytotoxicity of PDC-M and CS-PDC-M were assessed using MTT assays in human umbilical vein endothelial cells, LO2 cells, HepG2 cells, MCF-7 cells and A549 cells. Typically, adherent cells (6 × 10³ cells per well) were evenly planted into 96-well plates and incubated overnight. Then cells were exposed to serial dilutions of free DOX, PDC-M and CS-PDC-M followed by 24 h incubation. Thereafter the plates were centrifuged to collect the cells, which were then washed three times with phosphate-buffered saline (PBS) and incubated for another 4 h with fresh medium containing 5 mg mL−1 MTT. Finally, dimethyl sulfoxide (DMSO) was used to dissolve the formazan crystals. The absorbance was determined at 570 nm with a microplate reader (Labsystems Multiskan, Bio-chromatic Labsystem, Osaka, Japan). Cell viability was calculated according to the eqn (4):
 | (4) |
In eqn (4), Asample and Acontrol represent the absorbance of sample and control wells, respectively.
Cellular uptake
The cellular uptake was investigated by treating the HepG2 cells, MCF-7 cells and A549 cells with free DOX, PDC-M and CS-PDC-M. The cells were seeded in 6-well plates at 2.0 × 10⁵ cells per well in 2.0 mL of complete Dulbecco's modified Eagle's medium (DMEM) and cultured for 24 h, and then incubated at 37 °C for additional 2 h with free DOX, PDC-M and CS-PDC-M in complete DMEM in the absence or presence of galactose. Then, the culture medium was removed and cells were washed with PBS thrice. Thereafter, the cells were fixed with 4% (w/v) paraformaldehyde for 10 min at 25 °C, and the cells were then washed three times in PBS and stained with DAPI for another 10 min. After that, the cells were washed with cold PBS three times to remove free DAPI and visualized under fluorescence microscope (Olympus, Tokyo, Japan) with the following channels: red channel (DOX) excited at 488 nm, blue channel (DAPI) excited at 358 nm.Quantitative analysis was performed by flow cytometry. HepG2 cells were cultured in six-well plates at a density of 1 × 10⁵ cells for 24 h. After incubation with free DOX and CS-PDC-M for 2 h, 4 h and 6 h at 37 °C, the untouched free DOX and CS-PDC-M were removed by sufficient PBS washing. Then, the cells were trypsinized and collected by centrifugation as a cell pellet. Finally, the cells were suspended in PBS and observed by a flow cytometer (Beckman, California, USA) at an excitation wavelength of 488 nm and emission wavelength of 590 nm.
In vivo antitumor efficacy
The antitumor efficacy of free DOX, PDC-M and CS-PDC-M were evaluated in athymic BALB/c nude mice inoculated subcutaneously in the flank of the right fore leg with 0.2 mL of PBS containing 2 × 10⁶ HepG2 cells. The tumor volumes were monitored at predetermined intervals using a digital caliper. When the tumors grew to approximately 200 mm3 (15 days after tumor implantation), the mice were randomly divided into four groups (5 mice per group): saline (control), free DOX, PDC-M and CS-PDC-M. The mice were injected intravenously once every 2 days via the tail vein with saline (control), free DOX, PDC-M and CS-PDC-M at 5 mg kg−1 of DOX equivalents. Antitumor activity was evaluated in terms of tumor volume, which was calculated using the following formula: V = 0.5 × A × B2, where V is the tumor volume, A is the length of the major axis and B is the length of the minor axis. The body weight was measured simultaneously as an indicator of systemic toxicity. The antitumor activity was evaluated via tumor growth and terminal tumor weight. Heart and tumor were collected 23 days after treatment. Tissue slices were subjected to hematoxylin and eosin (H&E) staining.Organ damage assays
The organ damage assays were performed by evaluating corresponding functional enzymes with fully automatic clinical chemistry and immunoturbidimetric analyzer (Liasys, AMS Alliance). The SD rats were weighed and randomly divided into 4 groups (6 mice per group): saline (blank control), free DOX, PDC-M and CS-PDC-M. The tail-vein injections of free DOX and nanomedicines with equivalent DOX (2.4 mg kg−1) in 1 mL of PBS or 1 mL of PBS alone were performed on days 0, 3 and 5 respectively. The blood of each SD rats was collected 7 days after the treatment. Afterwards, the blood was centrifuged at 4000 rpm for 10 min to obtain plasma for measuring clinical parameter measurement, including alanine aminotransferase (ALT), aspartate aminotransferase (AST), blood urea nitrogen (BUN), creatinine (Cr), creatine kinase (CK), creatine kinase-MB (CK-MB) and lactate dehydrogenase (LDH).Statistical analysis
Statistical comparisons were performed with one way ANOVA. p < 0.05 was considered to be statistically significant. All values were expressed as mean value ± standard error (S.E.) of three separated experiments. *p < 0.05 or less was considered statistically significant.Results and discussion
The preparation of CS-PDC-M
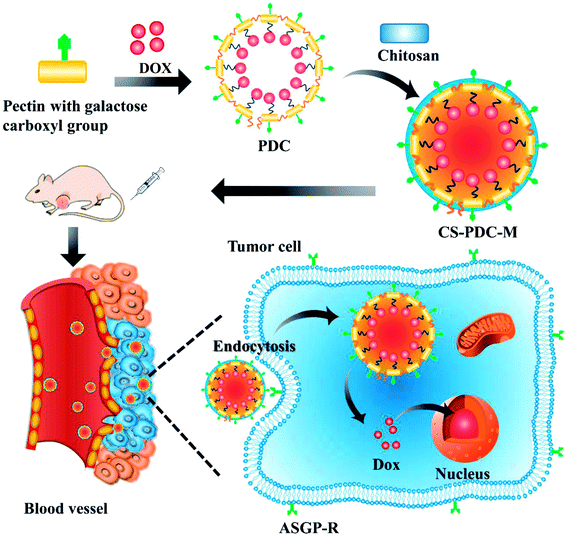
As shown in Scheme 1, pectin and DOX were bound by amide condensation to form PDC macromolecular pro-drug. Given that chitosan exhibits a strong positive charges while pectin has negative charges, the PDC-M was cross-linked with chitosan through electrostatic interaction. The incorporation of chitosan onto the PDC-M could further improve the cell adhesion of the CS-PDC-M. Furthermore, the systems could be more stable after the crosslinking with chitosan.Characterization of CS-PDC-M
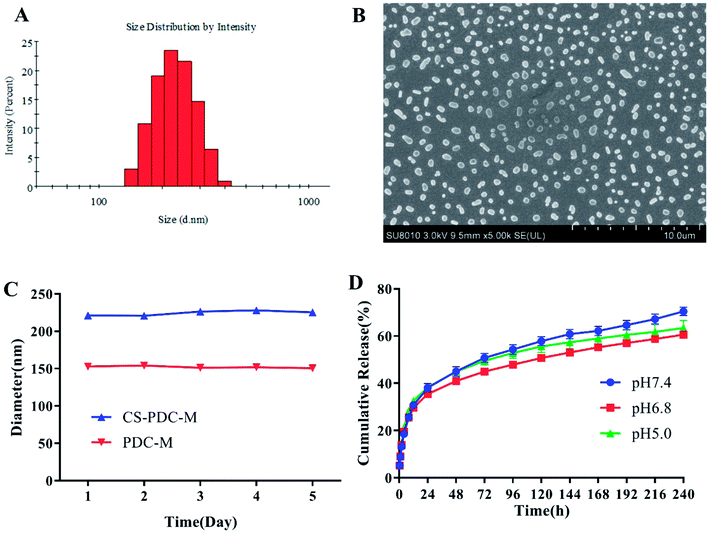
The CS-PDC-M was characterized in terms of size, size distribution, zeta potential, scanning electron microscope (SEM) and drug loading content. As shown in Fig. 1A and Table 1, the average particle sizes of CS-PDC-M and PDC-M from Zetasizer are 221.2 nm and 140.6 nm. The particle size of CS-PDC-M was dramatically increased compared to PDC-M. Additionally, the polydispersity index (PDI) of all the nanoparticles was near or less than 0.2, indicating that the nanoparticles were homogeneous. The zeta potential of CS-PDC-M is −14.4 mV, while that of PDC-M is −29.5 mV. The larger diameter and smaller negatively charged surface of CS-PDC-M demonstrated its efficient crosslinking with chitosan and the stimulated structural reconstruction. As a result, the encapsulation efficiency and drug loading for CS-PDC-M were 55.28% ± 3.14% and 22.24% ± 1.62% as shown in Table 1.| Sample | EE (%) | LC (%) | Size d (nm) | PDI | Zeta (mV) |
|---|---|---|---|---|---|
| PDC-M | 57.82 ± 3.70 | 23.85 ± 2.30 | 140.6 ± 2.4 | 0.237 ± 0.047 | −28.1 ± 1.4 |
| CS-PDC-M | 55.28 ± 3.14 | 22.24 ± 1.62 | 221.2 ± 2.2 | 0.185 ± 0.009 | −14.1 ± 1.0 |
The morphologies of CS-PDC-M were observed by SEM (Fig. 1B). The SEM images revealed that most CS-PDC-M were spherical in shape and relatively homogeneous in size distribution. The study assumes that ideal nanoparticles were able to accumulate in tumors through a leaky tumor vasculature by the enhanced permeability and retention effect (EPR), control drug release inside the tumors, and this will eventually improve therapeutic efficacy while reducing off-target toxicity. Therefore, these desirable properties indicated that CS-PDC-M could be a suitable candidate for the delivery of drugs.
The stability in biological milieu is of significant importance when choosing an appropriate drug carrier. The particle size of CS-PDC-M was measured to evaluate the stability of nanomedicines under physiological pHs. As shown in Fig. 1C, the particle size of the nanomedicines did not show significant change during the time of investigation. All the results have demonstrated that the CS-PDC-M and PDC-M have good stability in biological milieu and could form a stable suspension in biological fluids with various pHs and tonicity. All these properties are highly desired for a drug nanocarrier.
In vitro drug release profiles
The maximum absorption of free DOX at 480 nm was identified by the UV-vis absorption spectroscopy. This information was set as the foundation for the following estimation of the cumulative release of DOX. Fig. 1D shows an in vitro cumulative release profile of a suspension of CS-PDC-M. Generally, CS-PDC-M showed a prolonged releasing ability in different pHs. After 168 h, the release rate at pH 5.0 reached 58.96% while the release rate at pH 7.4 achieved approximately 62.15%. According to the release rate of PDC-M reached about 70% at pH 7.0, the drug release from the CS-PDC-M was slower than that from the PDC-M.28 These results strongly indicated that the CS-PDC-M system processed a prolonged slow release effect. This release pattern was even lower than DOX release from PDC-M in our previous report. The rate decrease of drug release could be explained by the coating of carrier by chitosan.Biocompatibility of CS-PDC-M
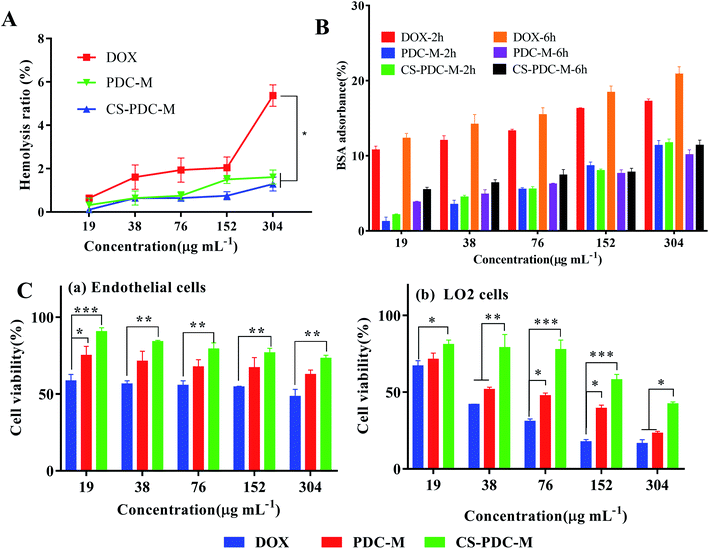
Hemolysis of the blood is the problem associated with bioincompatibility. Hemolysis rates (HR) of human fresh blood with PDC-M and CS-PDC-M were shown in Fig. 2A. Hemolytic activity of PDC-M and CS-PDC-M slightly increased with particle concentration. HR (%) of PDC-M and CS-PDC-M at different concentration was below 5, respectively, which was regarded as non-toxic effect level according to Ma, et al.38 This result revealed that CS-PDC-M possesses low haemolytic toxicity, good hemocompatibility and good suitability for intravenous injection.The BSA adsorption of the free DOX, PDC-M and CS-PDC-M at different concentrations for 2 h and 6 h have been summarized in Fig. 2B. It showed that the BSA absorbance of PDC-M and CS-PDC-M were obviously lower than that of free DOX at different time and concentrations. Therefore, PDC-M and CS-PDC-M exhibited lower BSA absorbance and could be a biocompatible delivery carrier given its with good biocompatibility.
In order to evaluate the biocompatibility of PDC-M and CS-PDC-M, the endothelial cells and LO2 cells were employed for cytotoxicity research. Both PDC-M and CS-PDC-M exhibited a negligible cytotoxicity against endothelial cells and LO2 cells in 24 h (Fig. 2C). However, the cytotoxicity of DOX surpassed that of PDC-M and CS-PDC-M. These results suggested that the PDC-M and CS-PDC-M are basically nontoxic, highly biocompatible and safe.
Cell viability assay
MTT assay was used to evaluate the cell viability of the CS-PDC-M compared to the free DOX and PDC-M against HepG2 cells, MCF-7 cells and A549 cells. As shown in Fig. 3, both CS-PDC-M and PDC-M solution inhibited the growth of these tumor cells in a dose-dependent and time-dependent manner. The half maximal inhibitory concentration (IC50) values of CS-PDC-M were listed in Table 2. According to the IC50 values, CS-PDC-M against HepG2 cells were more effective than CS-PDC-M against MCF-7 cells and A549 cells. The enhanced in vitro cytotoxicity of CS-PDC-M against HepG2 cells may be attributed to galactose acid of pectin that can combine with asialoglycoprotein receptor (ASGP-R) of mammalian hepatoma cells.39,40 Besides, CS-PDC-M exhibited better in vitro inhibition of cell growth than that of PDC-M. This is probably because the incorporation of chitosan onto the PDC-M could further improve the cell adhesion of the CS-PDC-M.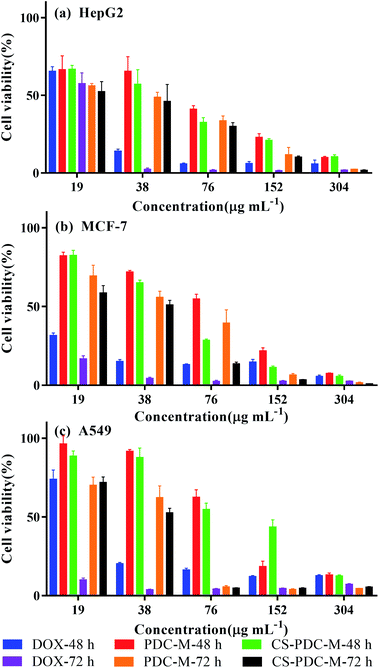 | ||
| Fig. 3 Cell viability of (a) HepG2 cells, (b) MCF-7 cells and (c) A549 cells incubated with free DOX, PDC-M and CS-PDC-M with various DOX concentrations for 48 h and 72 h. | ||
| Time (hours) | IC50 (μg mL−1) | |||
|---|---|---|---|---|
| HepG2 | MCF-7 | A549 | ||
| 48 | DOX | 22.88 ± 0.73 | 4.47 ± 1.56 | 26.46 ± 2.12 |
| PDC-M | 54.67 ± 4.82 | 72.86 ± 3.53 | 92.33 ± 1.09 | |
| CS-PDC-M | 42.03 ± 1.06 | 49.40 ± 1.31 | 105.1 ± 7.44 | |
| 72 | DOX | 20.03 ± 0.30 | 7.19 ± 1.20 | — |
| PDC-M | 30.20 ± 2.77 | 43.43 ± 3.64 | 37.18 ± 3.26 | |
| CS-PDC-M | 26.1 ± 3.15 | 29.05 ± 2.32 | 33.96 ± 2.07 | |
We found that DOX displayed better in vitro antitumor efficacy than that of PDC-M and CS-PDC-M. However, free DOX can cause severe side effects such as cardiotoxicity and is susceptible to metabolism by the liver. In contrast, PDC-M and CS-PDC-M can effectively reduce the side effect of chemotherapeutic agents due to the sustained release of anticancer drugs and active targeting.
Cellular uptake
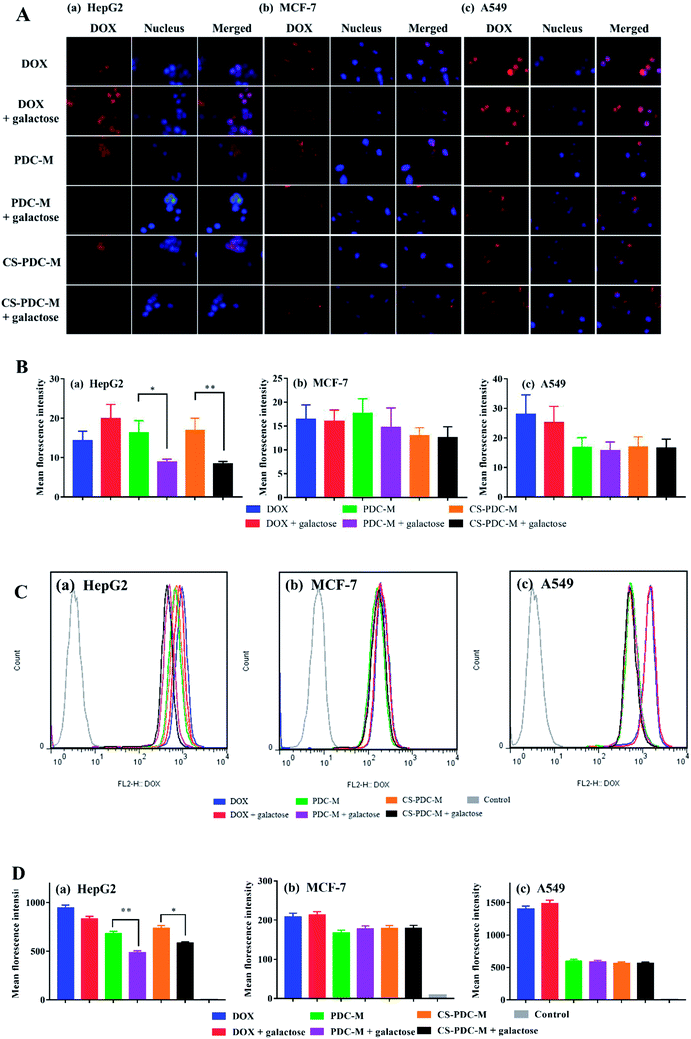
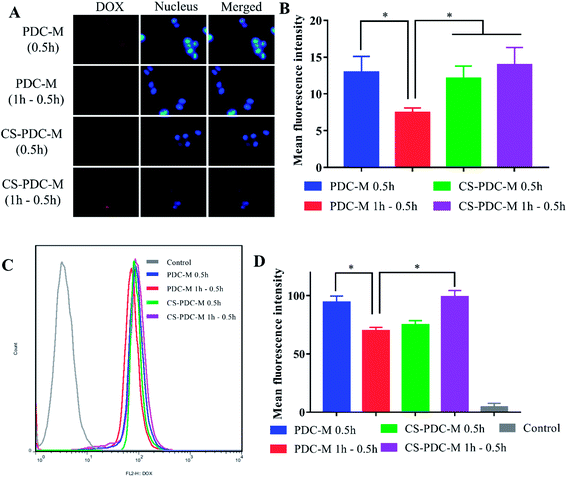
The extent of the internalization of free DOX, PDC-M and CS-PDC-M into HepG2 cells, MCF-7 cells and A549 cells was investigated qualitatively by fluorescence microscopy. The ASGP-R is a recycling endocytotic receptor on the surface of mammalian hepatoma cells (e.g. HepG2 cells), which can recognize galactose- and N-acetylgalactosamine-terminaled glycoproteins.41,42 To investigate the important role of galactose acid in the cellular uptake of PDC-M and CS-PDC-M, we conducted a receptor competition assay by selecting galactose acid as the competitive reagent. Consistent with our hypothesis, when PDC-M and galactose were added to the wells simultaneously, the fluorescence intensity of HepG2 cells significantly decreased. As shown in Fig. 4A and B, the presence of galactose significantly inhibited the uptake of CS-PDC-M and PDC-M into HepG2 cells, while the presence of galactose almost did not affect the endocytosis of nanomedicines into MCF-7 cells and A549 cells. As a comparison, the presence of galactose never affected the cellular uptake of free DOX. It suggested that the cellular uptake of galactosylated nanomedicine was mediated by the ASGP-R. Quantitative analysis of flow cytometric (Fig. 4C and D) indicated that CS-PDC-M exhibited a 1.3-fold higher uptake by HepG2 cells than that of CS-PDC-M + galactose, confirming that galactose can enhance the endocytosis of nanomedicines through the specific interactions with HepG2 cancer cells.The incorporation of positive charge onto the surface of polymer materials can effectively improve the cell attachment capacity of the polymer materials. To demonstrate the enhanced cell attachment capacity of CS-PDC-M to HepG2 cells, the cellular uptake and intracellular DOX release behaviors of nanomedicines were evaluated by fluorescence microscopy toward HepG2 cells. It can be seen from Fig. 5A that a week intensity of fluorescence could be detected after incubation for 30 min, suggesting that the PDC-M and CS-PDC-M can enter HepG2 cells in as short a time as 0.5 h. Furthermore, it can be observed from Fig. 5A–D that the fluorescence intensity in the HepG2 cells incubated with CS-PDC-M for 1 h withdrawal 0.5 h was higher than that of the cells incubated with PDC-M, confirming that the presence of CS significantly retained the uptake of CS-PDC-M into HepG2 cells after withdrawal 0.5 h. It suggested that the incorporation of chitosan onto the PDC-M could further improve the cell adhesion of the CS-PDC-M.
The endocytosis of free DOX and CS-PDC-M was confirmed by flow cytometry. Fig. 6A and B showed the cellular uptake efficiency of the CS-PDC-M and the free DOX by HepG2 cells in 2 h, 4 h and 6 h. Quantitative analysis indicated that free DOX exhibited 2.58-, 1.83-, 1.23-fold higher uptake by HepG2 cells than that to CS-PDC-M after the same time culture. These results strongly suggested that the CS-PDC-M had sustained and prolonged release, in consistence with the results from the in vitro drug release profiles.
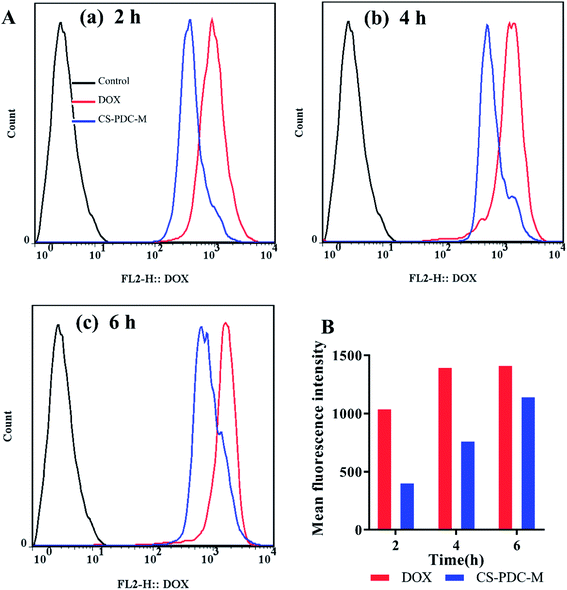 | ||
| Fig. 6 (A) Flow cytometric and (B) quantification of HepG2 cells after incubation with free DOX and CS-PDC-M for (a) 2 h, (b) 4 h and (c) 6 h. | ||
In vivo antitumor efficacy
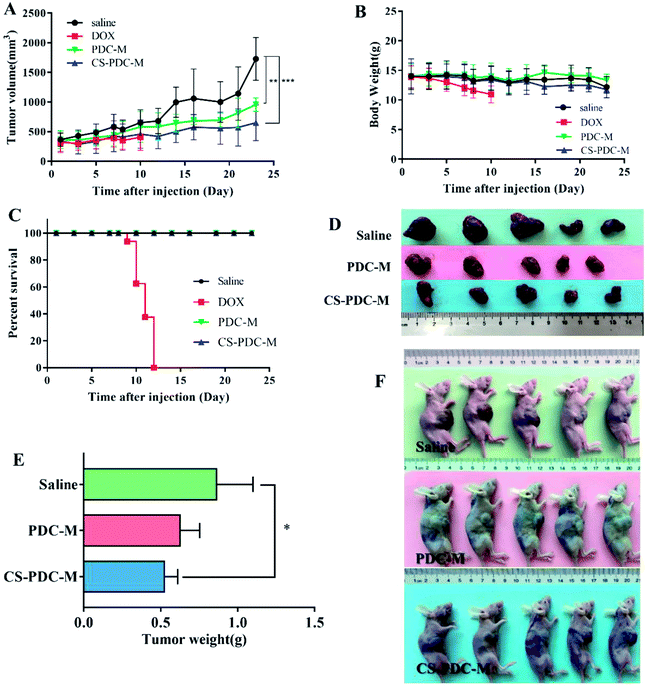
The antitumor efficacy of PDC-M and CS-PDC-M was studied in athymic BALB/c nude mice bearing HepG2 cell xenografts. Fig. 7A–C shows the change of tumor volume, body weight, and survival rate of the mice treated with free DOX, PDC-M and CS-PDC-M. The tumor volumes in the control group (saline) and the group treated with PDC-M and CS-PDC-M slowly increased to 1728.6 ± 361.1 mm3, 957.0 ± 114.6 mm3 and 650.5 ± 302.4 mm3 within 23 days, respectively (Fig. 7A). It revealed that the treated groups had significantly lower mean tumor volume (p < 0.01) than that of the control groups. In addition, compared to the initial tumor volume (approximately 200 mm3), the tumor volume barely increased in the PDC-M and CS-PDC-M treated mice, indicating that the PDC-M and CS-PDC-M effectively suppressed tumor's growth. All mice were sacrificed and tumors were excised after 23 days of treatment of PDC-M and CS-PDC-M. Although the tumor growth was inhibited by free DOX treatment, the body weight of this group dramatically decreased compared to other groups (Fig. 7B). It suggested that severe toxicity was induced by free DOX. Eventually, all the animals in the free DOX group in a dose of 5 mg kg−1 had to be terminated for humanitarian reasons on day 12. The terminated animals in the free DOX group in dose of 6 mg kg−1 at day 7 or 10 mg kg−1 at day 12 post-treatment due to serious systemic toxicity caused by free DOX has also been shown by other researchers, such as Kiziltepe et al.43 and Gou et al.13 On the contrary, the treatment with PDC-M and CS-PDC-M appeared to be well-tolerated, the animals exhibited unobvious weight loss but higher survival rate compared to that of the control and free DOX groups. The result demonstrated the significant decrease of the toxicity of DOX when DOX incorporated into the PDC-M and CS-PDC-M. Fig. 7D and E showed the tumor morphology and average weight of each group at the end of the experiment. The tumor size of the control group was obviously larger than that of the treated groups, which is a straight evidence to the tumor-inhibiting effect of the PDC-M and CS-PDC-M. Compared to PDC-M, CS-PDC-M had higher in vivo safety and therapeutic activity in animal models.To further evaluate the in vivo anticancer activity and toxicity of PDC-M and CS-PDC-M, histology analysis was also employed. The tumors and the hearts of the rats were collected and sectioned for hematoxylin and eosin (H&E) staining. As shown in Fig. 8A and B, treatments with PDC-M and CS-PDC-M for 12 days have not caused any significant morphological changes in heart compared to the saline group. However, it is worth noting that the free DOX treated group (after treatment for 12 days) had noticeable damage in both heart and tumor. After treatment with PDC-M and CS-PDC-M for 23 days, most of the tumor tissue cells were destroyed and became necrotic, whereas the heart retained unchanged for the control treated groups. Therefore, these results proposed that the PDC-M and CS-PDC-M were less susceptible to side effects and had the best antitumor effects on liver cancer.
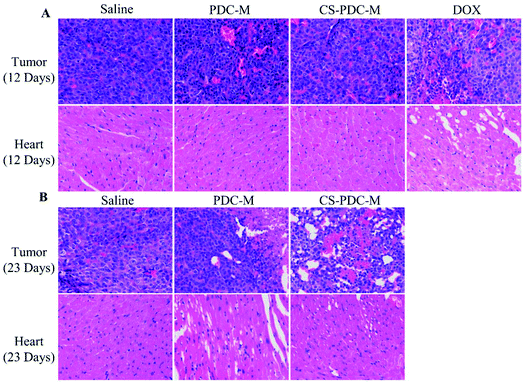 | ||
| Fig. 8 H&E analyses of tumors and hearts of nude mice bearing HepG2 cell xenograft after treatments with saline, free DOX, PDC-M and CS-PDC-M for (A) 12 days, and (B) 23 days. | ||
Organ damage assays
In order to compare the systematic toxicities of free DOX, PDC-M and CS-PDC-M after all treatments, alterations of clinical chemical parameters in SD rates after drug treatment were determined, including ALT, AST, AST/ALT, CK-MB, CK, LDH, BUN and Cr. It is well known that these parameters are associated with the function or certain damage of liver (ALT, AST, AST/ALT), heart (CK-MB, CK and LDH) and kidney (BUN and Cr). As shown in Fig. 9, SD rates treated with free DOX showed increased ALT values (mean value 146.0 ± 20.59 U L−1) and CK-MB values (mean value 2644.4 ± 731.997 U L−1) in plasma, which is indicative of early signs of liver and heart damage. Besides, when the dose of DOX dropped from 5 mg kg−1 to 2.4 mg kg−1, according to Tran et al.44 mice still died before the end of the experiment in free DOX group owing to the toxicities of DOX. On the contrary, the parameters of PDC-M and CS-PDC-M groups substantially maintained at normal levels, indicating that both PDC-M and CS-PDC-M did not lead to serious damage in liver, kidney and heart of mice in the treatment duration.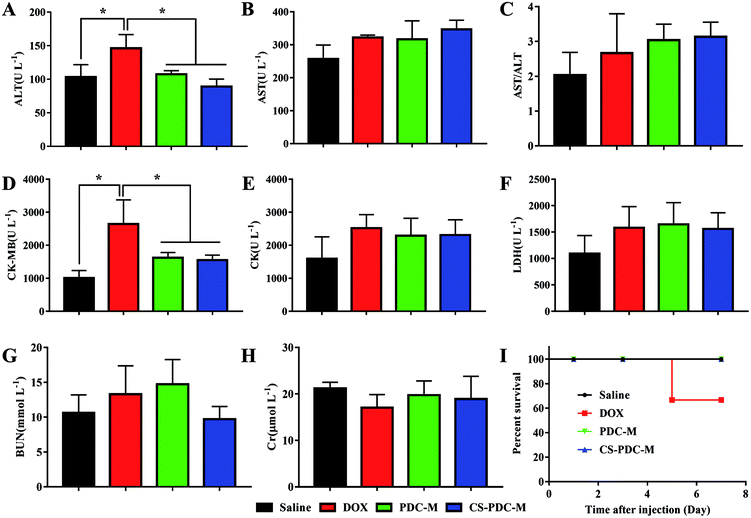 | ||
| Fig. 9 Evaluation of (A) ALT, (B) AST, (C) AST/ALT, (D) CK-MB, (E) CK, (F) LDH, (G) BUN, (H) Cr plasma levels and (I) survival rate after all the treatments of saline, free DOX, PDC-M and CS-PDC-M. | ||
Conclusions
In this study, we successfully synthesized a novel micelle based on the cross-link of chitosan and PDC macromolecular pro-drug (CS-PDC-M) for targeted liver cancer therapy. The DOX gave a sustained and controlled delivery in the CS-PDC-M. CS-PDC-M and PDC-M had a suitable size of 221.2 nm for passive targeting to tumor tissues by the EPR effect. It was clearly observed that CS-PDC-M is spherical shape via SEM. The in vitro drug release profiles and cellular uptake assays indicated that CS-PDC-M had a prolonged releasing ability. The hemocompatibilities, BSA adsorption test, cell viability evaluation and tissue compatibilities of CS-PDC-M and PDC-M were revealed to be excellent, which rendered their potential for delivering bioactive substance in vivo. The in vitro cellular targeting assay demonstrated that CS-PDC-M and PDC-M managed to target HepG2 cells specifically with higher efficacy. The in vitro cellular uptake assay indicated the incorporation of chitosan onto the PDC-M could further improve the cell adhesion of the CS-PDC-M. Both in vitro cell experiments and in vivo animal studies showed that CS-PDC-M exhibited higher antitumor efficiency compared to the PDC-M solution, while reduces systemic toxicity of DOX during the treatment. Therefore, CS-PDC-M is a potentially versatile drug delivery system for targeted liver cancer therapy. Next, we will construct the co-delivery system on the basis of CS-PDC-M for co-delivery of doxorubicin and miRNA-122 to treat cancer.Conflicts of interest
The authors report no declarations of interest.Acknowledgements
This work was supported by the National Natural Science Foundation of China (81471777, 81102409) and the Outstanding Youth Fund of Natural Science Foundation of Hunan province (2017JJ1024), the Innovation Team of Antitumor Drugs of the University of South China (NHCXTD05), the Chuanshan Talent Program of the University of South China, Outstanding Youth Fund of Natural Science Foundation of Hunan province ( 2017JJ1024), Chuanshan Talent Program of the University of South China. All supports are gratefully acknowledged.References
- R. L. Siegel, K. D. Miller and A. Jemal, Ca-Cancer J. Clin., 2017, 67, 7 CrossRef PubMed.
- Y. Tian, X. Jiang, X. Chen, Z. Shao and W. Yang, Adv. Mater., 2014, 26, 7393 CrossRef CAS PubMed.
- N. U. Khaliq, F. C. Sandra, D. Y. Park, J. Y. Lee, K. S. Oh, D. Kim, Y. Byun, I. S. Kim, I. C. Kwon, S. Y. Kim and S. H. Yuk, Biomaterials, 2016, 101, 131 CrossRef CAS PubMed.
- Y. Duo, Y. Li, C. Chen, B. Liu, X. Wang, X. Zeng and H. Chen, RSC Adv., 2017, 7, 39641 RSC.
- C. Y. Yu, N. M. Li, S. Yang, Q. Ning, C. Huang, W. Huang, Z. N. He, D. X. He, X. W. Tan and L. C. Sun, J. Appl. Polym. Sci., 2015, 132 Search PubMed.
- X. Wang, J. Hu, G. Cao, X. Zhu, Y. Cui, X. Ji, X. Li, R. Yang, H. Chen, H. Xu, P. Liu, J. Li, J. Li, C. Hao, B. Xing and L. Shen, Radiology, 2016, 283, 160572 Search PubMed.
- G. Sun, L. V. Mackey, D. H. Coy, C. Y. Yu and L. Sun, J. Cancer, 2015, 6, 996 CrossRef CAS PubMed.
- L. Sun, Q. Qian, G. Sun, L. V. Mackey, J. A. Fuselier, D. H. Coy and C. Y. Yu, J. Drug Targeting, 2016, 24, 169 CrossRef CAS PubMed.
- S. Guillot, F. Méducin, K. Poljak, V. Malard, A. Foucault-Collet, S. Serieye and C. Pichon, Int. J. Pharm., 2017, 523, 142 CrossRef CAS PubMed.
- W. Ma, H. Su, A. G. Cheetham, W. Zhang, Y. Wang, Q. Kan and H. Cui, J. Controlled Release, 2017, 263, 102 CrossRef CAS PubMed.
- L. Rochette, C. Guenancia, A. Gudjoncik, O. Hachet, M. Zeller, Y. Cottin and C. Vergely, Trends Pharmacol. Sci., 2015, 36, 326 CrossRef CAS PubMed.
- T. Efferth, V. B. Konkimalla, Y. F. Wang, A. Sauerbrey, S. Meinhardt, F. Zintl, J. Mattern and M. Volm, Clin. Cancer Res., 2008, 14, 2405 CrossRef CAS PubMed.
- P. Gou, W. Liu, W. Mao, J. Tang, Y. Shen and M. Sui, J. Mater. Chem. B, 2012, 1, 284 RSC.
- K. Piska, P. Koczurkiewicz, A. Bucki, K. Wójcik-Pszczoła, M. Kołaczkowski and E. Pękala, Invest. New Drugs, 2017, 35, 375–385 CrossRef CAS PubMed.
- S. L. Tang, M. Y. Bai, J. Y. Wang and P. D. Hong, Colloids Surf., B, 2017, 151, 304 CrossRef CAS PubMed.
- J. K. Oh, D. J. Siegwart, H. I. Lee, G. Sherwood, L. Peteanu, J. O. Hollinger, K. Kataoka and K. Matyjaszewski, J. Am. Chem. Soc., 2007, 129, 5939 CrossRef CAS PubMed.
- M. Rui, Y. Xin, R. Li, Y. Ge, C. Feng and X. Xu, Mol. Pharm., 2017, 14, 107 CrossRef CAS PubMed.
- M. L. Tan, P. F. Choong and C. R. Dass, J. Pharm. Pharmacol., 2009, 61, 131 CrossRef CAS PubMed.
- L. Huang, K. Tao, J. Liu, C. Qi, L. Xu, P. Chang, J. Gao, X. Shuai, G. Wang, Z. Wang and L. Wang, ACS Appl. Mater. Interfaces, 2016, 8, 6577 CAS.
- J. Kopeček, Adv. Drug Delivery Rev., 2013, 65, 49 CrossRef PubMed.
- L. Sivak, V. Subr, J. Tomala, B. Rihova, J. Strohalm, T. Etrych and M. Kovar, Biomaterials, 2017, 115, 65 CrossRef CAS PubMed.
- O. Y. Zolotarskaya, L. Xu, K. Valerie and H. Yang, RSC Adv., 2015, 5, 58600 RSC.
- H. Wei, S. X. Cheng, X. Z. Zhang and R. X. Zhuo, Prog. Polym. Sci., 2009, 34, 893 CrossRef CAS.
- C. Chang, H. Wei, D. Q. Wu, B. Yang, N. Chen, S. X. Cheng, X. Z. Zhang and R. X. Zhuo, Int. J. Pharm., 2011, 420, 333 CrossRef CAS PubMed.
- C. Y. Yu, H. Cao, X. C. Zhang, F. Z. Zhou, S. X. Cheng, X. Z. Zhang and R. X. Zhuo, Langmuir, 2009, 25, 11720 CrossRef CAS PubMed.
- P. Baumann, M. Spulber, O. Fischer, A. Car and W. Meier, Small, 2017, 1603943 CrossRef PubMed.
- M. Rajan, P. Krishnan, P. Pradeepkumar, M. Jeyanthinath, M. Jeyaraj, M. P. Ling, P. Arulselvan, A. Higuchi, M. A. Munusamy and R. Arumugam, RSC Adv., 2017, 7, 46271 RSC.
- C. Y. Yu, S. Yang, Z. P. Li, C. Huang, Q. Ning, W. Huang, W. T. Yang, D. He and L. Sun, Curr. Pharm. Des., 2016, 22, 506 CrossRef CAS PubMed.
- C. Mollea, F. Chiampo and R. Conti, Food Chem., 2008, 107, 1353 CAS.
- F. Tan, X. Xu, T. Deng, M. Yin, X. Zhang and J. Wang, Biomed. Mater., 2012, 7, 055009 CrossRef PubMed.
- A. K. Chowdhury, A. Tavangar, B. Tan and K. Venkatakrishnan, Sci. Rep., 2017, 7, 44250 CrossRef PubMed.
- J. Qi, P. Yao, F. He, C. Yu and C. Huang, Int. J. Pharm., 2010, 393, 176 CrossRef CAS PubMed.
- N. Mahattanadul, P. Sunintaboon, P. Sirithip and P. Tuchinda, J. Microencapsulation, 2016, 33, 563 CrossRef CAS PubMed.
- M. H. Casimiro, M. H. Gil and J. P. Leal, Int. J. Pharm., 2010, 395, 142 CrossRef CAS PubMed.
- Y. Hu, Y. Du, J. Yang, J. F. Kennedy, X. Wang and L. Wang, Carbohydr. Polym., 2007, 67, 66 CrossRef CAS.
- C. Huang, N. M. Li, P. Gao, S. Yang, Q. Ning, W. Huang, Z. P. Li, P. J. Ye, L. Xiang, D. X. He, X. W. Tan and C. Y. Yu, Drug Delivery, 2017, 24, 459 CrossRef CAS PubMed.
- J. H. Park, G. Saravanakumar, K. Kim and I. C. Kwon, Adv. Drug Delivery Rev., 2010, 62, 28 CrossRef CAS PubMed.
- Z. Ma, J. Bai, Y. Wang and X. Jiang, ACS Appl. Mater. Interfaces, 2014, 6, 2431 CAS.
- R. Rohilla, T. Garg, A. K. Goyal and G. Rath, Drug Delivery, 2016, 23, 1645 CAS.
- Y. Cao, C. Wang, J. F. Mukerabigwi, S. Luo, Y. Zhang, X. Xie, W. Xiao and X. Huang, RSC Adv., 2016, 6, 107800 RSC.
- E. Korin, T. Bejerano and S. Cohen, J. Controlled Release, 2017, 266, 310 CrossRef CAS PubMed.
- C. Y. Yu, Y. M. Wang, N. M. Li, G. S. Liu, S. Yang, G. T. Tang, D. X. He, X. W. Tan and H. Wei, Mol. Pharm., 2014, 11, 638 CrossRef CAS PubMed.
- T. Kiziltepe, J. D. Ashley, J. F. Stefanick, Y. M. Qi, N. J. Alves, M. W. Handlogten, M. A. Suckow, R. M. Navari and B. Bilgicer, Blood Cancer J., 2012, 2, e64 CrossRef CAS PubMed.
- T. H. Tran, C. T. Nguyen, L. Gonzalez-Fajardo, D. Hargrove, D. Song, P. Deshmukh, L. Mahajan, D. Ndaya, L. Lai, R. M. Kasi and X. Lu, Biomacromolecules, 2014, 15, 4363 CrossRef CAS PubMed.
Footnote |
| † These authors contributed equally to this work. |
| This journal is © The Royal Society of Chemistry 2018 |

