 Open Access Article
Dynamic sessile micro-droplet evaporation monitored by electric impedance sensing†
Xinwu Xie‡
 abd,
Feng Tian‡
 a,
Xiao Huac,
Tongxin Chenb and
Xinxi Xu*a
aInstitute of Medical Equipment, Academy of Military Medical Sciences, Tianjin 300161, China. E-mail: xuxx1@sohu.com; Fax: +86-20-84656705; Tel: +86-20-84656705
bDepartment of Biomedical Engineering, School of Medicine, Tsinghua University, Beijing 100084, China
cTianjin Key Laboratory for Prevention and Control of Occupational and Environmental Hazards, Logistics University of Chinese People's Armed Police Forces, China
dNational Bio-protection Engineering Center, Tianjin 300161, China
First published on 12th April 2018
Abstract
Studies of liquid evaporation on a solid surface are useful for wettability phenomena-related research, and can be applied in a series of scientific and industrial areas. However, traditional methods are not easy to be intergrated into small size to monitor evaporation process of a micro-droplet. In this paper, a micro-electrode array was used to measure the impedance of an electrolyte droplet, indicating the dynamic process of evaporation. This method uses the relationship between concentration and conductivity of the water solution to dynamically monitor the evaporation process. The dynamic impedance results were compared to weight and imaging data of droplet evaporation and demonstrate high correlation coefficient of the earlier 90% part of the sodium chloride droplet evaporation process (R2 = 0.99). Our study proved that the height of the droplet will affect the impedance sensing result, and the solution used for droplet evaporation can be expanded to mixture of strong electrolyte solution such as phosphate buffered solution. Then the “impedance imaging” of the array monitored the evaporating speed differences of different sites of a sessile droplet. As the electrode array can be integrated into small size, this method is compatible for many other experimental systems and can be further used for evaporation studies and corresponding application areas.
1 Introduction
Studies of liquid evaporation on a solid surface are useful for wettability phenomena-related research, such as two-phase heat transfers1,2 and electrowetting droplet manipulation,3,4 and can be applied in a series of scientific areas (biological,5 climate,6 etc.) and industrial areas (printing,7 pharmacology, glass industry, automotive, textile, etc.).8,9 Thus, being able to dynamically monitor the evaporation process is important for these studies. Commonly used methods include droplet height, contact diameter and contact angle10 and gravity11 measurements, or imaging via microscopy.12 However, none of these methods can monitor the whole evaporation process to deliver quantitative, real-time, and sensitive results.On the other hand, microfluidic micro-droplets have been widely studied recently for physical, chemical and biological applications.13 The low volume, isolation from one another, size, and position controllability of the droplets make them excellent carriers and containers for chemical or biological reactions, especially low amount/concentration sample reactions such as digital polymerase chain reaction (PCR).14 Further, droplet-related cell culture is used for drug screening, cytotoxicity assessment, and so on.15
However, the imaging- and weighing-based evaporation monitoring methods are too complicated for some applications,16 and can not be integrated into microfluidic chips. Thus, it is necessary to find a new dynamically evaporation monitoring method that is easy to operate, small in size, and compatible to microfluidic systems. Recently, several new methods have been reported to dynamically measure the evaporation of a droplet. Preter et al. developed a new method to measure droplets by optical fiber,17,18 and Schuszter et al. measure the impedance change of wet buckypaper to monitor the evaporation process.19 Ino et al. monitor the dynamic process of different parts of a droplet using electrochemistry.20 This method is a possible solution, but the authors monitor the evaporation process by measuring the electric current of a specific chemical reaction, and thus, the application is limited. Impedance sensing of a micro-droplet can fulfill these needs, and Hjelt et al. developed a silicon micro-well array to measure liquid evaporation.21 However, this device can only measure the liquid in the wells, which is physically different from a sessile droplet on a solid surface, and the evaporation process is also rather different.
In this paper, an electrode array was integrated on a glass chip using microelectronic fabrication methods, and this chip was used to study the evaporation process of a sessile micro-droplet. The device is flat, and the electrodes can be designed into different sizes forming an array. The theoretical model was deduced, and the evaporation process of droplets with different sizes and contents was monitored by measuring impedance of a pair of electrodes, and compared to weighing and imaging results to investigate the feasibility of this method. Then the dynamic evaporation process of different sites of a droplet was monitored using the electrode array. This device is compatible and easy to be integrated for many other experimental systems for different applications of droplet evaporation, such as heat transfers studies, microfluidic systems, high throughput screening systems in biomedical applications, and so on.
2 Materials and methods
2.1 Reagents and experimental platform
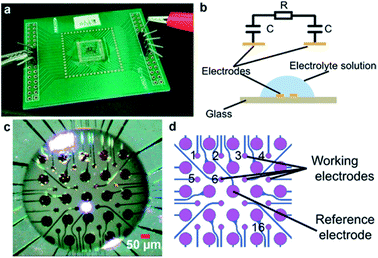
Minimum Eagle's Medium (MEM, type α) was purchased from HyClone Laboratories, Inc. (South Logan, Utah). Sodium chloride (NaCl) and phosphate buffered solution (PBS) were supplied by Sigma-Aldrich (St. Louis, MO). Deionized (DI) water was produced using a Milli-Q Advantage A10 (Merck Millipore, Darmstadt, Ger.).The electrode array (Fig. 1) was fabricated using standard microelectronic fabrication techniques. Briefly, a conductive layer of Ti/Au (Ti 20 nm and Au 200 nm) was sputtered onto a cleaned pyrex glass wafer. Then, an insulation layer, consisting of SiO2/Si3N4/SiO2 (400 nm/100 nm/500 nm) was deposited onto the substrate using plasma enhanced chemical vapor deposition (PECVD). Finally, the insulation layer on the electrodes and bonding pads was removed by reactive ion etching.
The glass chip was bonded to a PCB board and connected to an impedance analyzer (HEWLETT PACKARD 4192A LF). The droplet was placed on the glass chip covering the electrodes (Fig. 1c). Any pair of electrodes can be used to measure impedance value. To measure a single droplet with a single curve, a pair of electrodes in the center of the droplet should be chosen for measurement. To investigate the difference of evaporation speed at different areas of droplet, an array of electrodes covered by the droplet was used. The smaller pads were used as working electrodes, and a single larger pad in the center of the droplet was used as the reference electrode for all working electrodes. Then, the impedance value (10 kHz, 10 mV) was measured by the impedance analyzer. The time resolution of the sensing system can be set to less than 100 ms and 2 s for single channel sensing and the sensing array, respectively. The data were collected and analyzed using the software controlling the impedance analyzer. The weight was measured by an analytical balance (METTLER TOLEDO-ME55, accuracy: 0.01 mg), and the imaging of a droplet on the chip was measured using the image acquisition system mentioned in a previous publication.16
2.2 Theoretical modeling of the impedance–evaporation relationship
See Fig. 1b, the impedance (Z) of the droplet can be modeled as the electrical double-layer capacitors (C) at the electrodes–solution interface and the solution resistance (R) between the electrodes.
 | (1) |
Based on previous publications, the double-layer capacitance can be considered as Helmholtz model, Gouy–Chapman model or Gouy–Chapman–Stern model.22–24 The Gouy–Chapman–Stern model combined the Helmholtz capacitance (Stern layer) and Gouy–Chapman diffuse layer. And the single time dielectric constant (ε) can be described by Debye equation:
 | (2) |
 is the permittivity of free space (=8.854 × 10⁻¹² F m−1), σ is the ionic conductivity of the water. Then the dielectric constant can be written as the real part (ε′) and imaginary part (ε′′):
| ε = ε′ + jε′′ | (3) |
 | (4) |
 | (5) |
And the imaginary part (ε′′) can be considered as part of conductivity:
 | (6) |
Assuming the electrodes are relatively small enough compared to the size of droplet, most part of the current occurs at the base of the droplet and between the electrodes. Then the electrolyte solution can be considered as a size-constant conductive material between the electrodes, the resistance (R) is determined by conductivity (ρ) of the droplet:
 | (7) |
| ρ = k0c | (8) |
For the evaporation process, the volume of a droplet keeps decreasing. When the droplet is a water solution of electrolyte, and assuming the electrolyte is non-volatile, then the concentration of the electrolyte increases according to the water evaporation. Thus, the conductivity and the impedance (Z) value change with time lapse. The conductivity and impedance can be written as:
 | (9) |
 | (10) |
The capacitance (C) at the electrodes–solution interface can be deduced by:
 | (11) |
As the imaginary part of ε is considered as part of conductivity, the capacitance part can be written as:
 | (12) |
The ε∞ is a constant, and ε0 can be deduced as:24
| ε0 = ε0w(1 − 0.2551c + 0.05151c2 − 0.006889c3) ≈ ε0w(1 − 0.2551c) | (13) |
Thus, the real part of the dielectric constant decreases when the concentration increased by evaporation. Plug (10), (12) and (13) into formula (1), and the impedance can be written as:
 | (14) |
 is a constant.
Thus, when V(t) ≫ 0.2551β, the imaginary part of Z(t) equals k1 and changes a little that can be neglected, the most changes comes from the real part:
 | (15) |
At the late stage of evaporation, when V(t) decreased and 0.2551β can not be neglected, the imaginary part changes will affect the impedance changes, the impedance changes will decrease faster. Then the concentration is too high, conductivity will decrease accordingly, the electrolyte can be crystallized, separated out, and at last deposited on the electrodes by the evaporation and the eqn (9) and (14) does not valid. The deposited solid materials can block the current and increase the impedance. When the solution is nearly dry up, the equivalent cross-sectional area (S) decreases quickly, and the impedance increased accordingly. These make the impedance turn to increase at the last stage of the evaporation.
On the other hand, the evaporation occurs at the surface of the droplet, while the impedance sensing electrodes are on the base of the chip. It is possible that when the droplet is too high, the impedance sensing result can not reflect the concentration changes at the top surface of the droplet in real time.
2.3 Theory validation using NaCl solutions
The NaCl solutions were used to verify the above theory. To investigate the concentration–impedance relationship, the impedance (10 kHz, 10 mV) of a droplet (20 μL) with different concentrations (1, 0.1, 0.01, 0.001, 0.0001, 0.00001, 0.0000001 mol L−1) of NaCl was measured by a pair of electrodes on the chip. Then, the time-lapse impedance of droplets (0.001 mol L−1 NaCl) with different volume (5, 2, 1, 0.5, 0.1 μL) were measured to evaluate the effect of droplet height. The glass chip was plasma treated for 40 s (FEMTO, Diener electronic, GER) to gain a hydrophilic surface, then a 5 μL droplet was added on the chip and measured by the electrodes again. The contact angles of the hydrophilic (plasma-treated, 5 μL droplet) and hydrophobic (untreated, 1 and 5 μL droplet) surface were measured (POWEREACH, Shanghai Zhongchen Digital Technology Apparatus Co. Ltd), separately. For comparison, the evaporation process of droplets (5 μL droplet on hydrophilic surface, 1 and 5 μL droplet on hydrophobic surface) were measured by impedance and the analytical balance under the same circumstance temperature and humidity.2.4 Theory validation using other solutions
To further study the theory, the evaporation of different solutions (deionized (DI) water, 0.01× PBS (PBS diluted 100 times), MEM droplets (1 μL) were measured by the electrodes on the chip and the analytical balance. The impedance values were compared to the weight data.2.5 Monitoring the dynamic evaporation process of different parts of a droplet using a micro-electrode array and comparing to imaging
Because the micro-electrodes and the intervals can be fabricated into small sizes of ∼10 μm, the electrode array can be used to monitor different parts of a droplet that cover the array. An array of 4 × 4 = 16 microelectrodes of Φ10 μm (Fig. 1c and d) was used to measure the evaporation process of a droplet (PBS, volume = 1 μL). The droplet was generated by a micro-needle and place on the electrode array, which was placed into the observing plate of the image acquisition system referenced in the previous publication.16 The entire evaporation process was monitored by the side and upper CCDs, and thus, the side view and top view of the droplet were imaged by this system. The contact angles at different time were calculated from images through software of the contact angle measurement machine. The contact diameter and the height of the droplet were measured by Photoshop (Adobe, San Jose, CA).To better differentiate the differences between electrodes, the impedance values were normalized by:
 | (16) |
![[Z with combining macron]](https://www.rsc.org/images/entities/i_char_005a_0304.gif) , Z, Zmin, Zmax represent the normalized impedance value, the original impedance value, the minimum impedance value during the evaporation, the impedance value at the beginning of the evaporation, respectively. Further, the impedance values were transformed into gray value (G) linearity such that G = 255 ×
, Z, Zmin, Zmax represent the normalized impedance value, the original impedance value, the minimum impedance value during the evaporation, the impedance value at the beginning of the evaporation, respectively. Further, the impedance values were transformed into gray value (G) linearity such that G = 255 × ![[Z with combining macron]](https://www.rsc.org/images/entities/i_char_005a_0304.gif) . Thus, the evaporation process could be recorded as a dynamic movie.
. Thus, the evaporation process could be recorded as a dynamic movie.
3 Results and discussion
3.1 Impedance sensing of NaCl solution and droplets
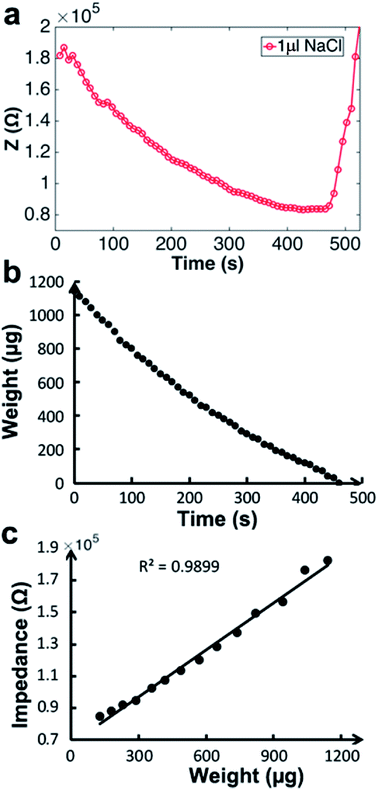
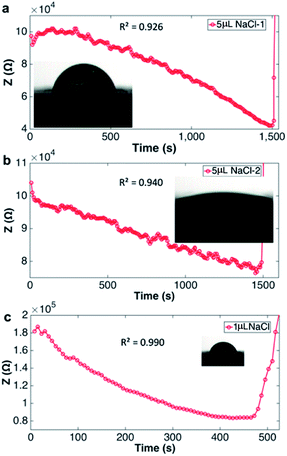
Fig. 2 shows evaporation of a droplet of 1 μL NaCl solution (0.001 mol L−1, Fig. S3†) monitored by impedance sensing using the electrodes on the chip. The same volume of NaCl droplet evaporation process was monitored by measuring the weight using an analytical balance under the same circumstance temperature and humidity. The impedance-time and weight-time result (Fig. 2a and b) show the similar pattern during most part of the evaporation process (0–420 s). The correlation of impedance and weight value (Fig. 2c) in this time range is high (R2 = 0.9899), which means the impedance value can reflect the droplet weight changing very well. The weight value (80 μg) indicates that the droplet has lost >90% water at 420 s. When the evaporation approaches the last stage, the concentration is too high that the impedance will increase sharply till the droplet is dry. The rapid increase of the impedance value can be a pre-indication of the droplet dry up.According to the theory, the droplet size and shape can affect the sensing result. Thus evaporation of droplets with different volume monitored by impedance were investigated. Fig. 3 shows that when volume is less than 2 μL, the impedance curves demonstrate concave function pattern, which is similar to weight changing curve; when volume is 5 or 10 μL, the impedance curves demonstrate convex function pattern. It seems that the height of the droplet affects the sensing. To further study the impact of droplet height, the chip was plasma treated to gain a hydrophilic surface, and the 5 μL droplet was placed on the chip and its evaporation was monitored through impedance. The impedance curves and original droplet shape were compared in Fig. 4. The impedance curve of the droplet on hydrophilic surface shows a concave function pattern (Fig. 4b), and the correlation coefficient with weight improved than that of droplet on normal (untreated, hydrophobic) surface (R2 = 0.926 to R2 = 0.940). The contact angle of droplet on the plasma treated surface is less than 10°, while that on the hydrophobic surface is 84°. The height estimation of them are <0.5 mm and ∼1.34 mm. Table 1 listed the height estimation of the droplets when the contact angle = 90°. For the hydrophobic surface, the height data approximate to these in Table 1. As the 5 μL droplet on the plasma-treated (hydrophilic) surface (height < 0.5 mm) demonstrate concave function pattern, it is obvious that the height is the main factor influence the impedance sensing of evaporation, and the possible threshold for the chip is ∼1 mm. When the droplet's height < 1 mm, the impedance curve will show better correlation with weight loss. Thus the height of the droplet can affect the impedance sensing, the evaporation of lower droplets can be better monitored by the electrode chip.
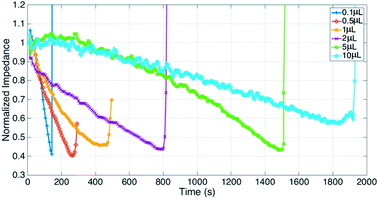 | ||
| Fig. 3 Droplets of different volume (0.1, 0.5, 1, 2, 5, 10 μL) evaporation monitored by impedance sensing, impedance were normalized by the initial value of each droplet. | ||
| Volume (μL) | 0.1 | 0.5 | 1 | 2 | 5 | 10 | 5 (contact angle < 10°) |
| Height (mm) | 0.36 | 0.62 | 0.78 | 0.98 | 1.34 | 1.68 | <0.5 |
The impedance changing process demonstrates the evaporation process and thus can be used to study the evaporation itself. Fig. S4† shows the impedance curve can monitor the humidity of different circumstances in real-time. Meanwhile, because the electrodes can be fabricated into several micro-meters, much smaller droplet can be measured by the micro-electrodes. If the width and interval of electrodes are 2 μm, a pair of electrodes can be covered by a droplet of Φ10 μm, with a volume < 0.05 pL. Thus, the micro-electrodes chip can monitor the evaporation of small droplets (<1 pL) using the impedance method. As the electrodes chip is compatible to microfluidic systems, this method can be used in microfluidic droplet studies.
3.2 DI water and mixture solution sessile droplets evaporation monitored by impedance
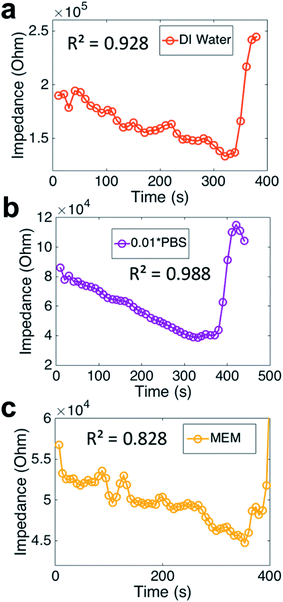
The evaporation monitored by impedance sensing method can be expanded. Droplets of 1 μL DI water, 0.01× PBS and MEM were studied using our method (Fig. 5). The impedance curves demonstrate similar tendency, but show different fluctuations. Compared to weight, the correlation coefficient of them are rather different. The DI water's correlation coefficient (R2 = 0.928) is not high enough for an accurate sensing. The reason could be the extremely low ion concentration increased the impedance sensing noise. The PBS results gain a high correlation coefficient (R2 = 0.988), which means the PBS droplet evaporation can be well monitored by impedance. It seems that the impedance sensing method is not proper for the MEM droplet evaporation, as the correlation coefficient is rather low (R2 = 0.828). PBS is a mixture of different strong electrolytes, such as NaCl, KCl and other phosphates. So most part of the components of PBS fulfill the request for the electrolyte. Compared to PBS, the components of MEM include amino acids and glucose, which can not be considered as strong electrolyte and thus not fulfil the basic condition of our theory.3.3 Impedance sensing vs. imaging during droplet evaporation
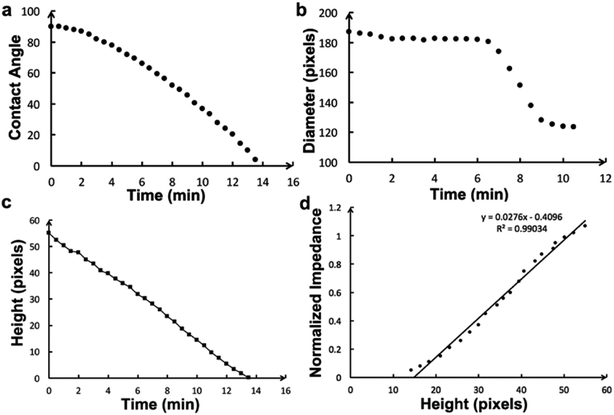
The contact diameter, contact angle and height during the droplet evaporation was calculated through the images of the 1 μL droplet evaporation (Fig. 6). The contact diameter changes a little at early stage of evaporation. The contact angle is a convex function of time, which is different to weight curve. The height change is similar to weight and impedance, with a high relative coefficient (R2 = 0.99) with impedance value.Because the impedance method demonstrates similar performance to traditional methods in monitoring evaporation, and the micro-electrodes can be fabricated into a small array, the micro-electrode array can be used to monitor evaporation of different parts of a single droplet. Imaging is usually used to monitor droplet evaporation, providing morphology results, and can quantitatively record the dynamic evaporation process. Thus, the impedance method was compared to the imaging method. Fig. 7a demonstrates the impedance changes of a PBS droplet evaporation; the 16 curves represent normalized results detected by the 4 × 4 electrode array. Fig. 7b shows the side view imaging results of the 1 μL droplet. The droplet morphology recorded qualitative results of the whole droplet, while the impedance method provided quantitative results of different parts of the droplet.
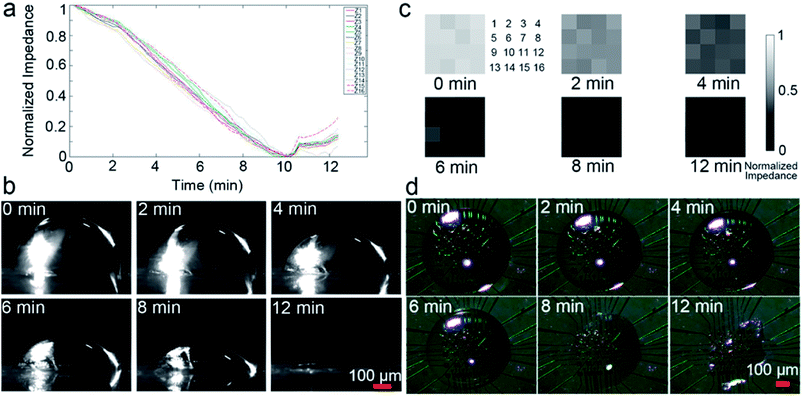 | ||
| Fig. 7 Impedance sensing vs. imaging during droplet evaporation. (a) The 16 impedance curves of different sites of the droplet showed in Fig. 1d. (b) Morphology of the droplet. Impedance imaging (c) vs. traditional imaging (d) during droplet evaporation. The array (4 × 4) numbers (c) are the same as in Fig. 1d and correspond to the same electrodes in (d). | ||
Fig. 7c shows the normalized impedance imaging results of a 16-electrode array (4 × 4) covered by a droplet. Fig. 7d is the top view images of the droplet at different time points. The impedance imaging results demonstrated that different part of the droplet have different evaporation speeds, while the traditional imaging result cannot discriminate such details. Video S1† was composed by the impedance images demonstrating the dynamic process of impedance changes, with a time resolution of 2 s per frame. Generally, the outer ring of the droplet evaporated faster than the central portion, which is consistent with previous studies.26
4 Conclusions
This paper proposed an impedance measurement method for dynamic sessile droplet evaporation studies using an electrolyte solution and a micro-electrode array. The basic theory was deduced and validated. The suitable range and limitation of this method was studied and discussed. For strong electrolyte and mixture of different strong electrolytes solution, the monitoring performance was similar to traditional weighing and imaging methods. However, when the solution has few ion, or too much non-strong electrolyte, the impedance sensing will not be stable enough for accurate measurement. The dynamic evaporation process of different parts of a 1 μL droplet was also quantitatively measured by the micro-electrode array. As the electrodes can be fabricated into small sizes and form an array, the impedance method can be used to monitor dynamic evaporation process of a droplet <1 pL or to scan different parts of a single droplet. The impedance imaging can possibly be used for investigating evaporation of different parts of a droplet with a better space resolution, while the single impedance sensing can be used for dynamic monitoring fast droplet evaporation, with a better time resolution (<100 ms, comparable to other methods). Although this method uses an electrolyte solution and its composition is limited, the chemical reaction on the electrodes is not needed. Further, the surface of the electrode array was rather flat, which is suitable for sessile droplet evaporation experiments. The electro-wetting studies are compatible with this device, too. Thus, this method and micro-electrode array can be used for small sessile droplet evaporation monitoring and is suitable for evaporation measurements under some conditions such as droplet cell culture and other biological applications based on microfluidic systems.Conflicts of interest
There are no conflicts to declare.Acknowledgements
This work was supported by National Science and Technology Major Project (2017ZX10304403-003-004) and the Natural Science Foundation of Tianjin (17JCYBJC24500). We thank Dr Youchun Xu's help of chip design, CapitalBio Corporation's help of chip fabrication, and Shengtai Bian's help of droplet evaporation imaging.References
- S. A. Putnam, A. M. Briones, L. W. Byrd, J. S. Ervin, M. S. Hanchak, A. White and J. G. Jones, Int. J. Heat Mass Transfer, 2012, 55, 5793–5807 CrossRef CAS.
- O. Herman and B. Martine, J. Electron. Cool. Therm. Control, 2006, 12, 16–20 Search PubMed.
- K. H. Kang, Langmuir, 2002, 18, 10318–10322 CrossRef CAS.
- F. Mugele, Soft Matter, 2009, 5, 3377–3384 RSC.
- J. Wu, I. Wheeldon, Y. Guo, T. Lu, Y. Du, B. Wang, J. He, Y. Hu and A. Khademhosseini, Biomaterials, 2011, 32, 841–848 CrossRef CAS PubMed.
- T. L. Delworth and S. Manabe, J. Clim., 1988, 1, 523–547 Search PubMed.
- A. v. d. Bos, M.-J. v. d. Meulen, T. Driessen, M. v. d. Berg, H. Reinten, H. Wijshoff, M. Versluis and D. Lohse, Phys. Rev. Appl., 2014, 1, 014004 CrossRef.
- R. Hołyst, M. Litniewski, D. Jakubczyk, K. Kolwas, M. Kolwas, K. Kowalski, S. Migacz, S. Palesa and M. Zientara, Rep. Prog. Phys., 2013, 76, 034601 CrossRef PubMed.
- S. Cioulachtjian, S. Launay, S. Boddaert and M. Lallemand, Int. J. Therm. Sci., 2010, 49, 859–866 CrossRef CAS.
- C. Bourgks-Monnier and M. E. R. Shanahan, Langmuir, 1995, 11, 2820–2829 CrossRef.
- S. David, K. Sefiane and L. Tadrist, Colloids Surf., A, 2007, 298, 108–114 CrossRef CAS.
- S. J. Gokhale, J. L. Plawsky and P. C. Wayner Jr, J. Colloid Interface Sci., 2003, 259, 354–366 CrossRef CAS PubMed.
- T. Nisisako, T. Torii and T. Higuchi, Lab Chip, 2002, 2, 24–26 RSC.
- A. L. Markey, S. Mohr and P. J. R. Day, Methods, 2010, 50, 277–281 CrossRef CAS PubMed.
- H. Hufnagel, A. Huebner, C. Gülch, K. Güse, C. Abell and F. Hollfelder, Lab Chip, 2009, 9, 1576–1582 RSC.
- P. Zhang, J. Zhang, S. Bian, Z. Chen, Y. Hu, R. Hu, J. Li, Y. Cheng, X. Zhang, Y. Zhou, X. Chen and P. Liu, Lab Chip, 2016, 16, 2996–3006 RSC.
- E. Preter, V. Artel, D. Donlagic, C. Sukenik and A. Zadok, Optical Sensors, 2013 Search PubMed.
- G. Verma and K. P. Singh, Appl. Phys. Lett., 2014, 104, 244106 CrossRef.
- G. Schuszter, E.-S. Bogy, D. Horváth, Á. Tóth, H. Haspel and Á. Kukovecz, Microporous Mesoporous Mater., 2015, 209, 105–112 CrossRef CAS.
- K. Ino, Y. Kanno, T. Nishijo, T. Goto, T. Arai, Y. Takahashi, H. Shiku and T. Matsue, Chem. Commun., 2012, 48, 8505–8507 RSC.
- K. T. Hjelt, R. v. d. Doel, W. Lubking and M. J. Vellekoop, Sens. Actuators, A, 2000, 85, 384–389 CrossRef CAS.
- H. Wang and L. Pilon, J. Phys. Chem. C, 2011, 115, 16711–16719 CAS.
- W. Kuang and S. O. Nelson, Trans. ASAE, 1998, 41, 173–184 CrossRef.
- A. Stogryn, IEEE Trans. Microwave Theory Tech., 1971, 19, 733–736 CrossRef.
- R. A. Robinson and R. H. Stokes, Electrolyte solutions, Courier Corporation, 2002 Search PubMed.
- K. S. Lee, C. Y. Cheah, R. J. Copleston, V. M. Starov and K. Sefiane, Colloids Surf., A, 2008, 323, 63–72 CrossRef CAS.
Footnotes |
| † Electronic supplementary information (ESI) available. See DOI: 10.1039/c8ra01451e |
| ‡ These authors contribute equally to this work. |
| This journal is © The Royal Society of Chemistry 2018 |

