 Open Access Article
Thermoelectric properties of polycrystalline palladium sulfide
Liu-Cheng Chen abc,
Bin-Bin Jiangde,
Hao Yuc,
Hong-Jie Pangc,
Lei Su
 f,
Xun Shi
 d,
Li-Dong Chend and
Xiao-Jia Chen*c
aKey Laboratory of Materials Physics, Institute of Solid State Physics, Chinese Academy of Sciences, Hefei 230000, China
bUniversity of Science and Technology of China, Hefei 230026, China
cCenter for High Pressure Science and Technology Advanced Research, Shanghai 201203, China. E-mail: xjchen@hpstar.ac.cn
dState Key Laboratory of High Performance Ceramics and Superfine Microstructure, Shanghai Institute of Ceramics, Chinese Academy of Science, Shanghai 200050, China
eUniversity of Chinese Academy of Sciences, Beijing 100049, China
fKey Laboratory of Photochemistry, Institute of Chemistry, University of Chinese Academy of Sciences, Chinese Academy of Sciences, Beijing 100190, China
First published on 9th April 2018
Abstract
Measurement of the electrical, thermal, and structural properties of palladium sulfide (PdS) has been conducted in order to investigate its thermoelectric performance. A tetragonal structure with the space group P42/m for PdS was determined from X-ray diffraction measurement. The obtained power factor of 27 μW cm−1 K−2 at 800 K is the largest value obtained for the transition metal sulfides studied so far. The maximum value of the dimensionless figure of merit is 0.33 at 800 K. These results indicate that binary bulk PdS has promising potential for good thermoelectric performance.
1 Introduction
Thermoelectric materials, which can directly convert heat to electrical power, have been of interest for many years because of their potential applications and environmentally friendly properties. The efficiency of thermoelectric materials is determined using the dimensionless figure of merit (zT), defined as where S is the Seebeck coefficient, σ is the electrical conductivity, T is the absolute temperature and κ is the thermal conductivity. For thermoelectric devices, a conversion efficiency of 15% (zT ≥ 1) is needed and this can be achieved by obtaining large S, high σ, and low κ values.1,2 Many strategies for enhancing zT have been proven to be effective, including the use of phonon-liquid electron-crystal materials, nanostructure engineering and band structure engineering.3–5 Among these strategies, the reduction of thermal conductivity by microstructure modification is the most promising strategy. Therefore, searching for thermoelectric materials with intrinsic large power factors, PFs (PF = S2σ), and then modifying them through nanostructuring while maintaining the original electrical properties will be a good method for obtaining superior performance in thermoelectric materials.
Recently, transition metal sulfides have attracted much attention because sulfide is cheaper and more earth abundant than telluride or selenium.6,7 Many transition metal sulfides have shown good thermoelectric performance, mainly because of their relatively low thermal conductivities. For instance, the highest zT for PbS has been improved from 0.4 to ∼1 by obtaining a low thermal conductivity through microstructure modification.8–10 The reduction of thermal conductivity led to a high zT of 0.6 at 873 K for SnS through a doping method.11 Copper sulfide is an important thermoelectric material with high zTs (zTs = 1.4–1.7 at 1000 K). Ultra-low lattice thermal conductivities caused by liquid-like copper ions were proposed to account for such high zTs in CuxS.12 However, the PFs of those thermoelectric sulfides are not high enough to provide ideal zTs. For example, the best performing material, Cu1.97S, only has a PF of around 8 μW cm−1 K−2 at 1000 K. Thus, an interesting approach for obtaining a high zT value is to search for a thermoelectric sulfide with an intrinsically large PF. Palladium sulfide (PdS), which belongs to the transition metal sulfide group, has potential applications in semiconducting, photoelectrochemical and photovoltaic fields because of its ideal band gap of 1.6 eV.13–15 Furthermore, it also has several potential device applications in catalysis and acid resistant and high temperature electrodes.16–18 In a study of thermoelectric properties,19 the Seebeck coefficient of PdS thin film was reported to have a large value (about 280 μV K−1) at room temperature. Therefore in this study, it is highly desirable to investigate the bulk thermoelectric properties of PdS, with the purpose of exploring the viability of the sample as a potentially useful thermoelectric material. In addition, it is interesting to gain some insight into the physical mechanisms involved in enhancing the zTs of thermoelectric materials.
In this work, polycrystalline PdS was successfully fabricated using a melt quenching and spark plasma sintering technique. Its thermoelectric properties were investigated using measurement of the electrical conductivity, Seebeck coefficient and thermal conductivity. We found that the power factor was very large (PF = 27 μW cm−1 K−2), due to the high values of σ and S. The highest zT value achieved in this paper was 0.33 at 800 K. Our results highlight that polycrystalline PdS is a promising potential thermoelectric material after overcoming the high κ value with microstructure modification.
2 Experimental details
High purity raw elements, Pd (powder, 99.99%, Alfa Aesar) and S (powder, 99.999%, Alfa Aesar), were weighed out in stoichiometric proportions and then mixed well in an agate mortar. The mixture was pressed into pellets and sealed in quartz tubes under vacuum. Then, the tubes were heated at a rate of 1 °C min−1 to 1373 K. They remained at this temperature for 12 hours before quenching in cold water. Next, the quenched tubes were annealed at 873 K for 7 days. Finally, the products were ground into fine powders and sintered by Spark Plasma Sintering (Sumitomo SPS-2040) at 923 K under a pressure of 65 MPa for 5 min. High-density samples (>99% of the theoretical density) were obtained.The powders were characterized using X-ray diffraction (XRD) (Rigaku, Rint 2000) under Cu Kα radiation (λ = 1.5405 Å) at room temperature. Measurements were obtained between 20° and 70° with a scan width of 0.02° and a rate of 2° min−1. The Seebeck coefficient and electrical and thermal conductivities were simultaneously measured between 3 K and 300 K in a thermal transport option (TTO) setup using a Physical Properties Measurement System (PPMS) by Quantum Design. The measurements were carried out in the residual vacuum of a He atmosphere, under a pressure of 10−5 Torr. The typical size of PdS used in the PPMS was 4.3 × 2.0 × 0.9 mm3, with four Cu wires attached with Ag paste. The Hall coefficient, RH, was also measured using a conventional four-probe technique by the PPMS, with a temperature range of 7 K to 300 K. The heat capacity, Cp, in a temperature range of 1.8 to 300 K was additionally measured by the PPMS in order to analyze the thermal conductivity data. The high temperature electrical conductivity and the Seebeck coefficient were measured using an Ulvac ZEM-3 from 300 to 800 K under a helium atmosphere. The high temperature thermal conductivity was calculated from κ = DCpρ, where the thermal diffusivity (D) was obtained using a laser flash method (Netzsch, LFA 457) under an argon atmosphere. The specific heat (Cp) was calculated using the Dulong–Petit law, and the density (ρ) was measured using the Archimedes method.
3 Results and discussion
3.1 Electrical transport properties
The XRD pattern and crystal structure of bulk PdS are shown in Fig. 1. The main diffraction peaks indicate a tetragonal structure (JCPDS no. 25-1234) with the space group P42/m (84) and no other phases were obviously detected from the XRD pattern. The lattice parameters are a = b = 6.441 Å and c = 6.619 Å.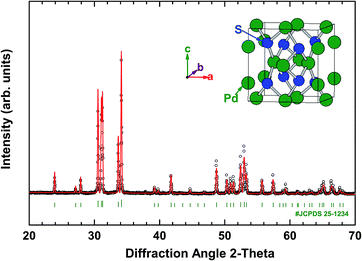 | ||
| Fig. 1 Powder XRD pattern of the PdS sample at room temperature. The inset illustrates the crystal structure of PdS. | ||
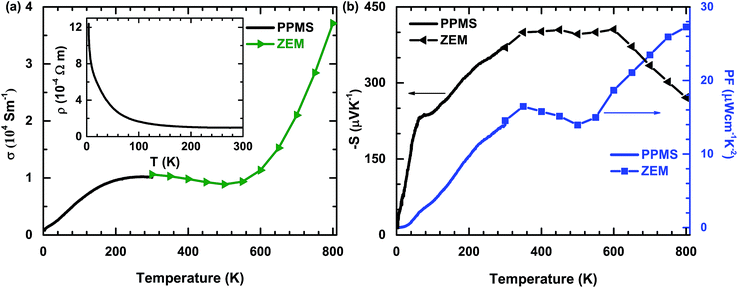
The temperature dependences of the σ, S, and PF of polycrystalline PdS are shown in Fig. 2. It can be seen that the values for σ, S and PF measured in different studies are consistent with each other. The small deviations of the data around room temperature could be caused by the different errors of the two systems. In Fig. 2(a), the behavior of σ with changing temperature is complex. At high temperatures, σ decreases sharply with decreasing temperature until around 500 K, which is probably caused by the thermal activation induced bipolar effect in semiconductors. However, in the temperature range of 200–500 K, σ behaves like a constant. It does not show an obvious increase with decreasing temperature. This behavior is consistent with that of a metal, which was not observed previously.14 Below 200 K, there is a significant decrease in the temperature dependence of σ, decreasing sharply as the sample is cooled. This reflects the nature of a typical semiconductor. This behavior at low temperatures can be seen more obviously in the inset [Fig. 2(a)]. Therefore, these contrasting behaviors imply that bulk PdS may have semiconductor–metal and metal–semiconductor transitions around 200 K and 500 K, respectively.
In Fig. 2(b), the temperature dependences of S and PF are shown. The value of S is negative, indicating that the majority of the charge carriers are electrons. With increasing temperature, the absolute value of S increases to a very large value at approximately 400 μV K−1, without doping at around 350 K, and then reaches a plateau until about 600 K. Unfortunately, there is an obvious decrease above 600 K, which may be caused by the thermal excitation of the carriers. This behavior observed for σ and S at high temperatures has been observed in many other intrinsic semiconductor systems and may be ameliorated by doping.20 Notably, the PF value tends to increase over the entire temperature range, except the intermediate region. The maximum PF value is about 27 μW cm−1 K−2 at 800 K (the highest recorded temperature in this study). The PF value reported here is very large compared with values obtained for other thermoelectric sulfides. For example, it is about three times larger than the value of optimal Cu1.97S.12 From these electrical properties, it is obvious that PdS is a potentially useful thermoelectric material.
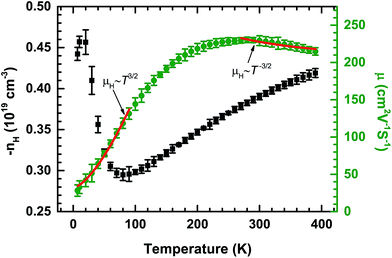
The Hall effect was measured to give insight into the electrical transport properties of PdS. The temperature dependences of the carrier concentration (nH) and Hall mobility (μH), evaluated from low temperature Hall measurements, are shown in Fig. 3. The Hall coefficient (RH) is negative over the entire temperature range, indicating that the majority of the charge carriers are electrons, which is consistent with the negative Seebeck coefficient. The temperature dependent μH gently increases until around 200 K and the maximum value is 230 cm2 V−1 s−1. This relatively high value of μH could be caused by the covalent bond characteristics of the tetragonal structure. Then, this value remains almost unchanged up to 300 K. This behavior is consistent with the temperature dependence of σ below 300 K, as shown in Fig. 2(a). At low temperatures, μH fits the curve μH ∼ T3/2 well, which indicates that ionized impurity scattering is the dominating carrier scattering process. However, at high temperatures, a T−3/2 dependence is observed in PdS, suggesting that the major carrier scattering process has changed to acoustic phonon scattering. The temperature dependence of nH is very complex and incredible, especially at low temperatures, which is most likely caused by some magnetic transitions. However, the carrier concentration of PdS changes in the same order, which indicates that the carrier concentration for PdS has a weak temperature dependence below 300 K, which has also been observed in lead chalcogenides.21
3.2 Heat transport properties
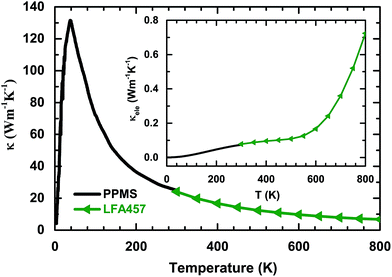
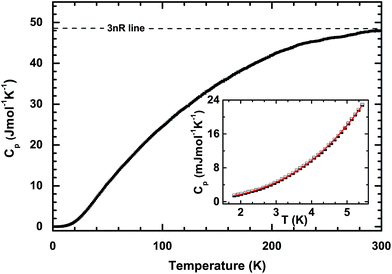
The temperature dependences of the thermal diffusivity and specific heat capacity used for the κ calculation are shown in Table 1. The obtained values for κ with changing temperatures are shown in Fig. 4. It can be seen that κ increases sharply with increasing temperature and evolves through a maximum (about 130 W m−1 K−1) at 38 K before finally decreasing roughly in a T−1 relation. This phenomenon indicates that bulk PdS is a normal crystal compound. Generally, κ consists of the electronic part, κele, and the lattice part, κlat. The electronic part κele is proportional to electrical conductivity σ through the Wiedemann–Franz relation:22 κele = LσT, where L is the Lorenz number (L = 2.44 × 10⁻⁸ W Ω K−2 in theory for semiconductors). Here, κele can be ignored below room temperature, as shown in the inset of Fig. 4. However, the contribution of κele to the total κ increases with increasing temperature and reaches about 12% at 800 K. The high κ of PdS probably comes from the light atomic mass of sulfur and the strong chemical bonds in the crystal. In order to elucidate the reasons for the high thermal conductivity of PdS, the heat capacity, Cp, was measured at low temperatures. The results are shown in Fig. 5. The measured Cp value at 300 K is 0.35 J g−1 K−1, which is close to the theoretical value (0.36 J g−1 K−1). The inset of Fig. 5 displays the heat capacity (Cp) vs. T. The solid red line is a fitted curve based on the Debye model by the relation:23 Cp = φT + βT3. The total Cp includes the carrier contribution, φT, and the phonon contribution, βT3. The fitted parameters are 0.34 mJ mol−1 K−2 for φ and 0.13 mJ mol−1 K−2 for β. The small value for φ indicates that the electronic density of states near the Fermi level is quite weak at low temperatures when compared with other thermoelectric materials (e.g. YbFe4Sb12, φ = 141.2 mJ mol−1 K−2).24 This finding is consistent with the low σ observed at low temperatures, as shown in Fig. 2(a).| T (K) | 300 | 350 | 400 | 450 | 500 | 550 | 600 | 650 | 700 | 750 | 800 |
| D (cm2 s−1) | 10.137 | 8.328 | 7.046 | 6.015 | 5.216 | 4.602 | 4.083 | 3.67 | 3.305 | 3.035 | 2.817 |
| Cp (J g−1 K−1) | 0.36 | 0.36 | 0.36 | 0.36 | 0.36 | 0.36 | 0.36 | 0.36 | 0.36 | 0.36 | 0.36 |
| d (g cm−3) | 6.6 |
3.3 The dimensionless figure of merit
Based on the measured temperature-dependent values for S, σ and κ, the dimensionless figure of merit (zT), which directly determines the energy conversion efficiency of a thermoelectric material, has been calculated. The results are shown in Fig. 6. The calculated value of zT has a positive temperature dependence over the entire measurement range, which is different from other thermoelectric materials which have maximum peaks at suitable temperatures. This phenomenon indicates that the thermoelectric properties of bulk PdS will be more efficient at higher temperatures. The value of zT reaches 0.33 at a temperature of 800 K (the highest recorded temperature in this study). This value is considerably high compared to that of many undoped thermoelectric sulfides at similar temperatures, such as Bi2S3 (zT ∼ 0.2 at 823 K).25 However, the thermoelectric conversion efficiency is still low compared to that of high performance thermoelectric materials, despite the obvious uptrend at higher temperatures. Thus, it is extremely urgent to improve the thermoelectric conversion efficiency of bulk PdS.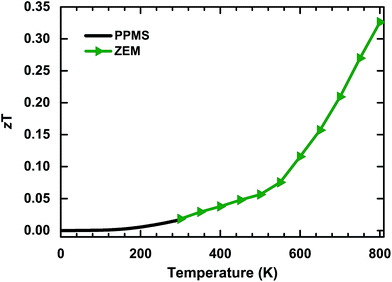 | ||
| Fig. 6 Temperature dependence of the dimensionless figure of merit (zT) from 2 K to 800 K. The maximum value of zT is 0.33 at 800 K. | ||
Based on our results, the intrinsic large PF is the most important feature for bulk PdS. Since only nominally undoped samples were studied in this initial report, it’s not hard to infer that further improvement of the PF through optimized doping should be a good method. This could change the density of states at the Fermi level depending on the relation:26  (q is the carrier charge and EF is the Fermi energy). Another way to improve the power factor of PdS is through band structure engineering, as many studies have explored in recent years. For example, the zT of PbTe reached 1.5 at 773 K by distortion of the electronic density of states,26 and a higher zT value of ∼1.8 was observed in PbTe1−xSex alloys by producing the convergence of many valleys at desired temperatures. Furthermore, a successful approach of rationally tuning crystal structures in non-cubic materials has been proposed, which has enhanced the zT values of a few carefully selected chalcopyrites.27 In addition, it can be expected that alloying between Pd and S will lead to a reduction in κlat due to the alloy scattering effect.
At the same time, the κ of bulk PdS is too large compared to that of other thermoelectric materials with low thermal conductivity (Fig. 4). Therefore, the reduction of κ appears to be very important and useful for the purpose of improving zT. Alloying and nanostructuring are both optional routes to increase phonon scattering for the purpose of reducing κ effectively.2 Many thermoelectric materials have been improved by these methods, such as the analogous binary PbS, where the zT value of the nanostructured PbS is about twice as high as previously reported (zT ∼ 0.4).9 SiGe is a well-known alloy for high temperature thermoelectric applications. Recently, by controlling their nanoscale structures, the zT values of both p- and n-type SiGe have been enhanced.28,29 More importantly, nanostructuring has been proven to be an efficient method for lowering thermal conductivities and will not change the electrical transport properties too much.4 Therefore, controlling the nanostructure of binary PdS will be a useful way to improve the zT value.
4 Conclusions
In summary, measurement of the electrical and thermal transport properties of binary PdS has been carried out in the temperature range of 2–800 K. The large value of the power factor (27 μW cm−1 K−2) and the maximum value of zT of 0.33 at about 800 K indicate the great potential thermoelectric performance of PdS as an undoped thermoelectric material. This study also predicts that κlat could be reduced through increased phonon scattering, which can be realized by nanostructuring, alloying or doping. These results suggest that binary bulk PdS has suitable properties to be a potential base thermoelectric material and many PdS based materials are expected to have good performance for thermoelectric applications.Conflicts of interest
There are no conflicts to declare.Acknowledgements
Lei Su acknowledges support from the Natural Science Foundation of China (No. 21273206). Xun Shi and Li-Dong Chen acknowledge support from the National Basic Research Program of China (973-program) under Project No. 2013CB632501, the Natural Science Foundation of China under No. 11234012 and the Shanghai Government (Grant No. 15JC1400301).Notes and references
- L. E. Bell, Science, 2008, 321, 1457–1461 CrossRef CAS PubMed.
- G. J. Snyder and E. S. Toberer, Nat. Mater., 2008, 7, 105–114 CrossRef CAS PubMed.
- B. C. Sales, D. Mandrus and R. K. Williams, Science, 1996, 272, 1325–1328 CAS.
- K. Biswas, J. He, I. D. Blum, C. I. Wu, T. P. Hogan, D. N. Seidman, V. P. Dravid and M. G. Kanatzidis, Nature, 2012, 489, 414–418 CrossRef CAS PubMed.
- Y. Z. Pei, X. Shi, A. Lalonde, H. Wang, L. D. Chen and G. J. Snyder, Nature, 2011, 473, 66–69 CrossRef CAS PubMed.
- X. Lu, D. T. Morelli, Y. Xia, F. Zhou, V. Ozolins, H. Chi, X. Y. Zhou and C. Uher, Adv. Energy Mater., 2013, 3, 342–348 CrossRef CAS.
- C. Wan, Y. Wang, N. Wang, W. Norimatsu, M. Kusunoki and K. Koumoto, Adv. Mater., 2010, 11, 044306 Search PubMed.
- L. D. Zhao, S. H. Lo, J. He, H. Li, K. Biswas, J. Androulakis, C. I. Wu, T. P. Hogan, D. Y. Chung and V. P. Dravid, J. Am. Chem. Soc., 2011, 133, 20476–20487 CrossRef CAS PubMed.
- S. Johnsen, J. He, J. Androulakis, V. P. Dravid, I. Todorov, D. Y. Chung and M. G. Kanatzidis, J. Am. Chem. Soc., 2011, 133, 3460–3470 CrossRef CAS PubMed.
- L. D. Zhao, J. He, S. Hao, C. I. Wu, T. P. Hogan, C. Wolverton, V. P. Dravid and M. G. Kanatzidis, J. Am. Chem. Soc., 2012, 134, 16327–16336 CrossRef CAS PubMed.
- Q. Tan, L. D. Zhao, J. F. Li, C. F. Wu, T. R. Wei, Z. B. Xing and M. G. Kanatzidis, J. Mater. Chem. A, 2014, 2, 17302–17306 CAS.
- Y. He, T. Day, T. Zhang, H. Liu, X. Shi, L. D. Chen and G. J. Snyder, Adv. Mater., 2014, 26, 3974–3978 CrossRef CAS PubMed.
- J. C. W. Folmer, J. A. Turner and B. A. Parkinson, J. Solid State Chem., 1987, 68, 28–37 CrossRef CAS.
- I. J. Ferrer, P. Díaz-Chao, A. Pascual and C. Sánchez, Thin Solid Films, 2007, 515, 5783–5786 CrossRef CAS.
- M. Barawi, I. J. Ferrer, J. R. Ares and C. Sánchez, ACS Appl. Mater. Interfaces, 2014, 6, 20544–20549 CAS.
- J. J. Bladon, J. Electrochem. Soc., 1996, 143, 1206–1213 CrossRef CAS.
- A. Zubkov, T. Fujino, N. Sato and K. Yamada, J. Chem. Thermodyn., 1998, 30, 571–581 CrossRef CAS.
- C. H. Yang, Y. Y. Wang, C. C. Wan and C. J. Chen, J. Electrochem. Soc., 1996, 143, 3521–3525 CrossRef CAS.
- A. Pascual, J. R. Ares, I. J. Ferrer, and C. R. Sanchez, in International Conference on – ICT, 2003, pp. 376–379 Search PubMed.
- Y. Z. Pei, J. Lensch Falk, E. S. Toberer, D. L. Medlin and G. J. Snyder, Adv. Funct. Mater., 2011, 21, 241–249 CrossRef CAS.
- W. W. Scanlon, Solid State Phys., 1959, 9, 83 CAS.
- G. S. Kumar, G. Prasad and R. O. Pohl, J. Mater. Sci., 1993, 28, 4261–4272 CrossRef CAS.
- K. Gofryk, D. Kaczorowski, T. Plackowski, J. Mucha, A. Leithejasper, W. Schnelle and Y. Grin, Phys. Rev. B: Condens. Matter Mater. Phys., 2007, 75, 1–10 CrossRef.
- N. R. Dilley, E. D. Bauer, M. B. Maple, S. Dordevic, D. N. Basov, F. Freibert, T. W. Darling, A. Migliori, B. C. Chakoumakos and B. C. Sales, Phys. Rev. B: Condens. Matter Mater. Phys., 2000, 61, 4608–4614 CrossRef CAS.
- Z. H. Ge, B. P. Zhang, Z. X. Yu and J. F. Li, J. Mater. Res., 2011, 26, 2711–2718 CrossRef CAS.
- J. P. Heremans, V. Jovovic, E. S. Toberer, A. Saramat, K. Kurosaki, A. Charoenphakdee, S. Yamanaka and G. J. Snyder, Science, 2008, 321, 554–557 CrossRef CAS PubMed.
- J. Zhang, R. Liu, N. Cheng, Y. Zhang, J. Yang, C. Uher, X. Shi, L. D. Chen and W. Zhang, Adv. Mater., 2014, 26, 3848–3853 CrossRef CAS PubMed.
- X. W. Wang, H. Lee, Y. C. Lan, G. H. Zhu, G. Joshi, D. Z. Wang, J. Yang, A. J. Muto, M. Y. Tang and J. Klatsky, Appl. Phys. Lett., 2008, 93, 193121 CrossRef.
- G. Joshi, H. Lee, Y. C. Lan, X. W. Wang, G. H. Zhu, D. Z. Wang, R. W. Gould, D. C. Cuff, M. Y. Tang and M. S. Dresselhaus, Nano Lett., 2008, 8, 4670–4674 CrossRef CAS PubMed.
| This journal is © The Royal Society of Chemistry 2018 |

