 Open Access Article
Production of Ti–Fe alloys via molten oxide electrolysis at a liquid iron cathode
Handong Jiao,
Donghua Tian,
Jiguo Tu and
Shuqiang Jiao
 *
*
State Key Laboratory of Advanced Metallurgy, University of Science and Technology Beijing, Beijing, 100083, P. R. China. E-mail: sjiao@ustb.edu.cn; Fax: +86-10-62333617; Tel: +86-10-62333617
First published on 14th May 2018
Abstract
This work studies the direct electrochemical preparation of Ti–Fe alloys through molten oxide electrolysis (MOE) at a liquid iron cathode. Cyclic voltammetry and potentiostatic electrolysis have been employed to study the cathodic process of titanium ions. The results show that cathodic behavior happens during the negative sweep at a potential range from −0.80 to −1.25 V (vs. QRE-Mo), corresponding to the electro-reduction of titanium ions. Importantly, Ti–Fe and titanium-rich Ti–Fe alloys have been successfully produced by galvanostatic electrolysis at different current densities of 0.15 and 0.30 A cm−2, respectively. The results show that it is feasible to directly prepare Ti–Fe alloys by the MOE method at a liquid iron cathode.
Introduction
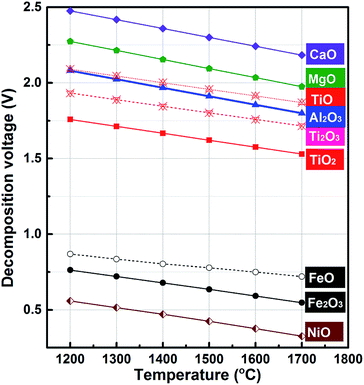
Ti–Fe alloys are one of the most important Ti-based alloys. They are the first generation of hydrogen storage materials.1–4 Meanwhile, as a deoxidizer and alloying addition agent, Ti–Fe alloys are widely used in steelmaking.5,6 Conventionally, Ti–Fe alloys are prepared by aluminothermic reduction or mechanical alloying of titanium and iron.7–10 However, the former is limited by the price of aluminum while the latter is restricted by issues with the production of titanium via the Kroll process which has high costs.11,12 Based on this background, the electrochemical extraction process has the potential to become an alternative method for Ti–Fe alloy preparation because aluminum and titanium, which are expensive, are unnecessary in this process and Ti–Fe alloys are synthesized by a one-step electro-reduction of metal oxides including ilmenite, rutile and even metallurgy slag. As far as we know, the FFC and SOM processes have been applied to the preparation of Ti–Fe alloys in chloride melts utilizing natural ilmenites or mixed (Ti, Fe) oxides as a solid cathode.13–15In addition, there is an alternative electrochemical method for the extraction of metals from metal oxides: molten oxide electrolysis (MOE).16,17Fundamentally, MOE is the direct electro-depositing of metals from molten oxide electrolytes. MOE is considered as a promising route for the production of metals without CO2 emission, and for the generation of oxygen by using an inter anode material that resists depletion in extreme conditions of high temperature.18–20 Our previous studies have reported the successful preparation of Fe and Fe–Ni alloys through the MOE method.21,22 Here, the decomposition potentials of metal oxides have been calculated at temperatures ranging from 1473 K to 1973 K and the corresponding results are shown in Fig. 1. The calculations indicate that the decomposition potential of TiO2 is far more than that of FeO. Furthermore, the decomposition potential of Ti2O3 is close to that of Al2O3. The value of TiO is even higher than that of Al2O3, which means that it is difficult to get pure titanium prior to the reduction of Al2O3 if TiO2 is reduced with a multi-step process. However, the cathodic process of TiO2 could be influenced by the composition of the electrolyte and the cathode metal activity. The published literature has reported that the cathodic process of Ti(III) ions will change from a two-step reduction (Ti3+ + e− = Ti2+ and Ti2+ + 2e− = Ti) to a one-step reduction (Ti3+ + 3e− = Ti) with an increase in fluoride ion concentration in molten chloride23,24 and the underpotential deposition of Ti(III) ions will occur at an active cathode, including liquid metal cathodes.25
Therefore, this work investigates the feasibility of the direct electrochemical preparation of Ti–Fe alloys by MOE at a liquid iron cathode in a CaO–Al2O3–MgO–TiO2 melt. Cyclic voltammetry is performed to investigate whether the titanium ions in the oxide melt will be electro-reduced, and galvanostatic electrolysis is carried out to confirm the feasibility of producing Ti–Fe alloys in such oxide melts.
Experimental section
The selected electrolyte was prepared from CaCO3, Al2O3, MgO and TiO2 (analytical reagent (AR) grade in purity, Sinopharm Chemical Reagent Co., Ltd.). CaO was obtained by calcination of CaCO3 powder at 1273 K for 6 h in a muffle furnace. The mixture with the composition of 47 wt% CaO, 44 wt% Al2O3 and 9 wt% MgO was initially calcined at 1273 K for 2 h to remove moisture. Subsequently, the mixture was placed in a silicon nitride crucible (60 mm in inner diameter, 120 mm in height) and then heated to melt at 1873 K in an argon atmosphere. Finally, the pre-melted CaO–Al2O3–MgO slag was cooled slowly to ambient temperature and then transferred into a glove box. A vertical resistance furnace with the protection of argon at a temperature of 1873 K was chosen for all experiments.A three-electrode setup was applied to investigate the electrochemical behavior of titanium ions. The working electrode was molybdenum wire (99.99%, Alfa Aesar) with a 1 mm diameter. The pseudo-reference and counter electrodes were molybdenum with a 3 mm diameter and a 6 mm diameter, respectively. The potential of the pseudo-reference (QRE-Mo) was satisfactorily stable over a period of 5 hours. Cyclic voltammetry was performed using an electrochemical workstation (Princeton potentiostat/galvanostat Model 263) connected to a computer with Powersuite software. 5 wt% TiO2 was directly added into the electrolyte during the testing.
Galvanostatic electrolysis was carried out to further investigate the deposition of titanium at a liquid iron cathode. The powders (300 g in total) were well mixed with the mass fraction 45 wt% CaO, 42 wt% Al2O3, 8 wt% MgO and 5 wt% TiO2 in the silicon nitride crucible, in which 150 g high purity iron powder (≥99.99%, particle size: 100 μm) was placed firstly at the bottom, and then heated to melt at 1873 K. A graphite rod (30 mm in diameter, 100 mm in height) was selected as a consumable anode and immersed in the molten slag in this work. Another graphite rod (3 mm in diameter, 150 mm in height) with a silicon nitride insulation layer was immersed in the liquid iron cathode and used as an electrically conducting rod. The vertical distance of the graphite anode from the liquid iron cathode was 10 mm. The galvanostatic electrolysis was operated using a DC power (PSM-3004, GW-INSTEK) at different cathodic current densities of 0.15, 0.30 and 0.45 A cm−2.
Characterization of the products was conducted using a scanning electron microscope (JSM6701F) equipped with an EDS probe (Thermo NS7). An X-ray diffractometer (AXIS Ultra, Kratos) was adopted to explore the crystalline structure of the cathodic products. An X-ray photoelectron spectrometer (XPS, Kratos AXIS Ultra DLD) was employed to produce the Ti 2p spectrum.
Results and discussion
For the cyclic voltammetry measurements, molybdenum wire (1 mm in diameter) was selected as the working electrode. The cyclic voltammogram demonstrated in a blank CaO–Al2O3–MgO melt at a scan rate of 50 mV s−1 is displayed by the blue dotted line in Fig. 2a. The potential was scanned from the open circuit potential (OCP) at about 0 V (vs. QRE-Mo) to the negative direction, reversed at −2.0 V (vs. QRE-Mo), and returned to the OCP after the position direction scanning at 0.2 V (vs. QRE-Mo). The results show that there is no obvious redox peak over the whole scan range. The shape of the voltammogram is similar to a straight line. In contrast, the red solid line representing the cyclic voltammogram of the melt containing 5 wt% TiO2 shows a reduction wave during the negative sweep at a potential between −0.80 and −1.25 V (vs. QRE-Mo), which is shown more clearly in the partial enlargement of the cyclic voltammogram (Fig. 2b). Combining the thermodynamic data shown in Fig. 1 and the previous results of the electrochemical reduction of iron oxide through the MOE method reported by Dihua Wang et al.,19 in which they showed that the electro-deposition potential of Fe(II) is about −0.05 V (vs. QRE-Mo) at the molybdenum electrode in molten CaO–SiO2–MgO–FeO slag at 1848 K, the reduction peaks of TiO2 and its suboxides should be around −0.8–1.25 V (vs. QRE-Mo), which is in agreement with the results shown in Fig. 2a. These results suggest that TiO2 can be electro-reduced at a solid molybdenum electrode by a multi-step process in molten oxide electrolytes.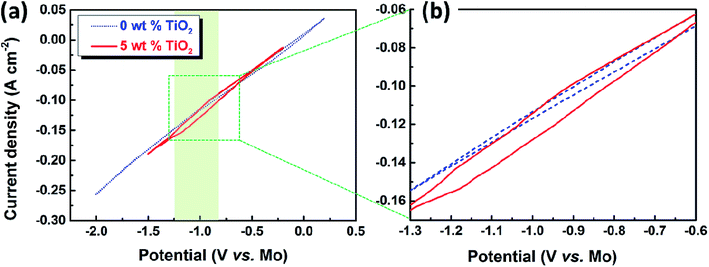 | ||
| Fig. 2 (a) Cyclic voltammogram of the CaO–Al2O3–MgO melt before and after dissolving 5 wt% TiO2, scan rate 50 mV s−1; (b) the partial enlargement of the cyclic voltammogram. | ||
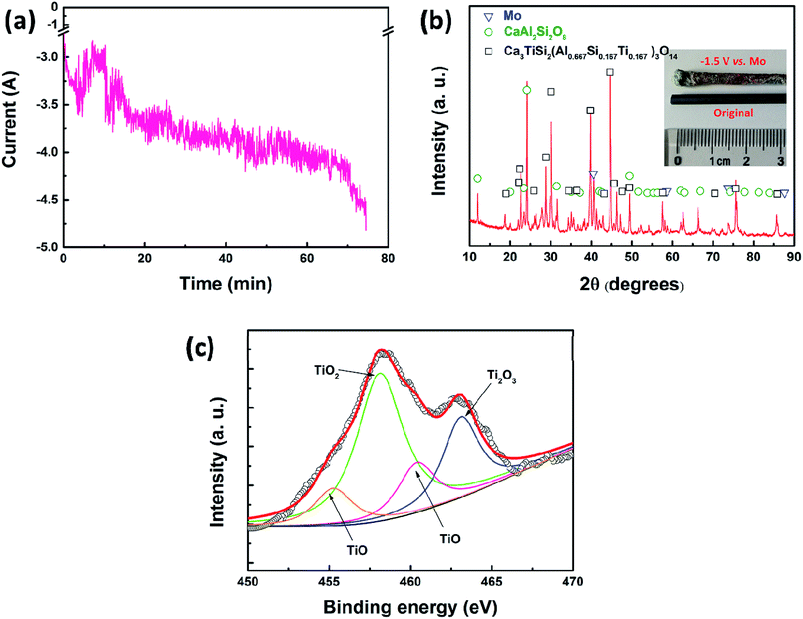
Subsequently, potentiostatic electrolysis was conducted to further study the reduction process of TiO2 in a molten oxide melt. In this section, molybdenum (3 mm in diameter) was selected as the working electrode and the reference electrode. Graphite (10 mm in diameter) was used as the counter electrode. The potential was set at −1.5 V (vs. QRE-Mo). The current–time curve is shown in Fig. 3a, which indicates that the current increases slowly during electrolysis. Fig. 3b is the XRD pattern of the cathodic product and the inset is the photograph of the molybdenum working electrode. The results show that the cathodic product consists of metal molybdenum and slag. No metal titanium is detected in this product. The Ti 2p spectrum of the molten oxide electrolyte after electrolysis is studied to further disclose the reduction process of TiO2 at a solid molybdenum electrode and the results are shown in Fig. 3c. It is clearly shown that there are TiO and Ti2O3, but no metal titanium.26–29 Therefore, the XRD and XPS results indicate that TiO2 can be reduced to Ti2O3 and TiO, but it may not be further reduced to metal titanium at a solid molybdenum electrode.
To address this issue, a liquid iron cathode was used to obtain the Ti–Fe alloys. For this, galvanostatic electrolysis was conducted on a liquid iron cathode (60 mm in diameter) at different cathodic current densities of 0.15 and 0.30 A cm−2 for a period of 210 min on the CaO–Al2O3–MgO melt containing 5 wt% TiO2. The cell voltage–time curves during galvanostatic electrolysis were recorded and are shown in Fig. 4a. The voltage obtained at a current density of 0.15 A cm−2 has a slight decrease at the initial stage between 0 and 60 min, followed by a steady value of around 1.7 V. In contrast, the voltage obtained at a current density of 0.30 A cm−2 has a slight increase between 0 and 30 min, which will be discussed below, and eventually stabilized at ∼2.1 V. Both of these are different from the results reported in our previous studies,21,22 where we demonstrated the preparation of Fe and Fe–Ni alloys. In those cases, the initial voltage decreases obviously owing to the nucleation of iron at the solid molybdenum electrode and the increase of the surface area of the cathode (as shown in Fig. 4b22). However, in this work, the cell voltage is relatively stable. This feature is attributed to the good stability of the surface of liquid iron electrode, supported by the phase diagram of Fe–Ti (Fig. 529), which indicates that there is a large liquid region ranging from 0 to ∼93 mol% Ti at 1873 K, preventing the effective formation of dendritic deposits at the iron electrode during electrolysis. Similar behavior is also displayed in our recent work on the recovery of titanium and silicon at a liquid iron cathode from Ti-bearing blast furnace slag.30
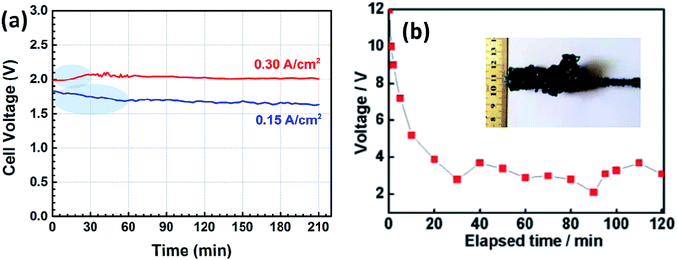 | ||
| Fig. 4 (a) Cell voltage–time plots recorded by galvanostatic electrolysis at different cathodic current densities of 0.15 and 0.30 A cm−2 for 210 min; (b) the cell voltage plot of galvanostatic electrolysis for Fe on a solid molybdenum cathode at a current of 0.85 A for 2 h (inset is the photograph of the cathodic product Fe after electrolysis).22 | ||
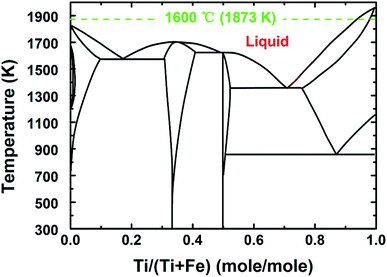 | ||
| Fig. 5 The phase diagram of Fe and Ti.23 | ||
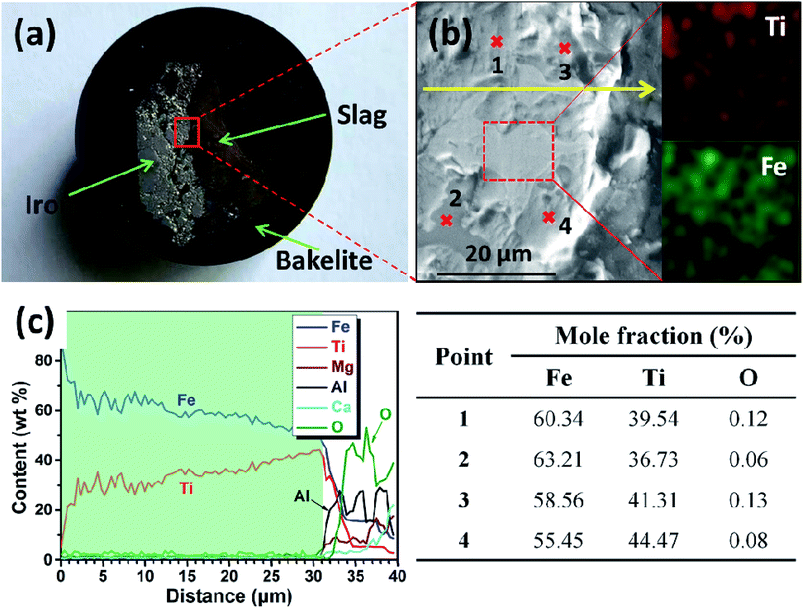
After electrolysis at a cathodic current of 0.15 A cm−2 for 210 min, the cathodic product was collected by breaking the crucible in a laboratory scale study. Meanwhile, because the separation of metal and slag is difficult at ambient temperatures, the cathodic product covered with a tawny coloured slag is selected to study the deposition of titanium on the surface of the iron cathode. Fig. 6a is a photograph of the cross section of the cathodic product that was inlaid in bakelite. The black area of Fig. 6a is bakelite, the white area with metallic luster is iron or its alloys and the tawny area is slag. This indicates that the interface between iron and slag is relatively smooth compared with the interface between the dendritic deposit and the slag (as shown in Fig. 4b),22 This result further verifies that the liquid iron cathode can effectively prevent the formation of dendritic deposits. Fig. 6b shows an SEM image of the cathodic product. According to the EDS map analysis shown in the right of Fig. 6b, titanium and iron are evenly distributed under the selected region of the cathodic product, which preliminarily confirms the feasibility of the preparation of Ti–Fe alloys by MOE at a liquid iron cathode from a CaO–Al2O3–MgO–TiO2 melt. Subsequently, the possible elements in the cathodic product were analyzed by an EDS line scan, and the results are shown in Fig. 6c, which obviously shows that the impurity elements including aluminum and oxygen are almost negligible in the cathodic product. These results prove that the underpotential deposition of titanium occurs at the liquid iron cathode prior to the electro-deposition of aluminum. In addition, it is also observed that the titanium content increases gradually with the decrease of distance from the interface between metal and slag, caused by the inter-diffusion process during titanium electro-deposition. The composition at different regions of the product is also disclosed in Fig. 6b and the table. They indicate that there is titanium at different regions. In addition, the titanium content of the edge region of the iron cathode (point 3 and 4) is more than that of the inner region (point 1 and 2), which is in agreement with the result of the EDS line scan. The XRD pattern of the cathodic product after roughly removing the covered slag is shown in Fig. 7. The presence of Ti–Fe alloys and the slag phase of Ca25Mg8Al34O84 is detected, which is in agreement with the result of the EDS analysis.
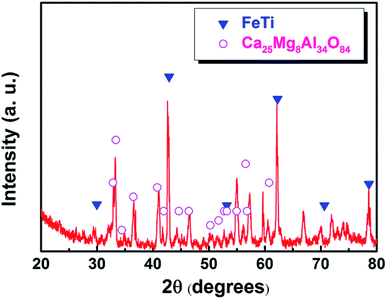 | ||
| Fig. 7 XRD pattern of the cathodic product obtained by electrolysis at a cathodic current density of 0.15 A cm−2 for 210 min. | ||
Furthermore, the cathodic product obtained by galvanostatic electrolysis at a current density of 0.30 A cm−2 for a period of 210 min is collected in the same way. An SEM image and an EDS line scan of the cross section of the cathodic product are presented in Fig. 8a and b, respectively. It is found that the cathodic product consists of two regions (region I and II) and the interface between these two is pretty obvious. EDS line analysis discloses that the composition of region I is a lot of iron and little titanium. Region II is composed of titanium and iron, and the titanium content is about three to four times that of the iron content, presenting a titanium-rich Ti–Fe alloy containing low levels of impurities, for example less than 1 wt% of aluminum and oxygen. In addition, as shown in Fig. 8b, the titanium content increases rapidly at the interface (ranging from 13 to 16 μm). This feature may have resulted from the diffusion rate of titanium in pure iron being lower than the electro-deposition rate of titanium at a high current density, and it is similar to the formation of the transition layer between the deposited iron and substrate as shown in previous studies.31 This may be the reason why the initial cell voltage increases slightly from ∼2.0 to ∼2.1 V as shown in Fig. 4. The melting point of Ti–Fe alloys decreases with an increase in titanium content and it reaches a minimum when the titanium content is about 70 mol% (Fig. 5). At this point, the diffusion rate of titanium in Ti–Fe alloys is high enough to enable the dissolution of deposited titanium into the cathode, which results in a steady cell potential in the later stage of electrolysis (Fig. 4) and the formation of titanium-rich Ti–Fe with a uniform composition. These findings show that we can prepare Ti–Fe alloys with different titanium contents by changing the electrolysis conditions.
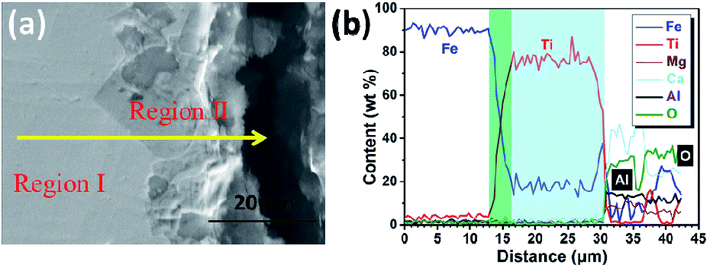 | ||
| Fig. 8 (a) SEM image of the cathodic product obtained by electrolysis at a cathodic current density of 0.3 A cm−2 for 210 min; (b) EDS line analysis along the solid yellow line shown in (a). | ||
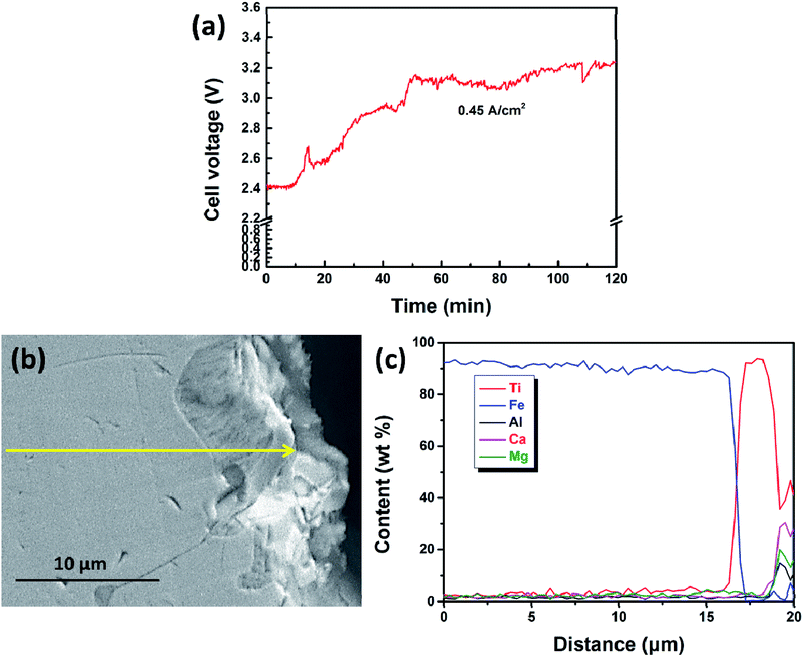
Lastly, the current density was increased to 0.45 A cm−2 to study the deposition layer of titanium. The cell voltage shown in Fig. 9a showed a significant increase from 2.4 V to 3.2 V in the initial 50 min, unlike that shown in Fig. 4a. SEM and EDS results show that the iron cathode is covered by a thin layer bearing metal titanium. Notably, the thickness (5–6 μm thick, as shown in Fig. 9c) of the titanium-bearing layer obtained at 0.45 A cm−2 is much thinner than the thicknesses obtained at current densities of 0.15 and 0.30 A cm−2. This further indicates that solid metal titanium or its alloys will appear on the surface of the iron cathode at the initial electrolysis stage because the diffusion rate of titanium in iron is lower than the electro-deposition rate of titanium ions at a high current density. In this case, it is difficult to deposit titanium during electrolysis when the cathode is becoming a solid metal. So, only a thin layer bearing metal titanium is obtained at a high current density of 0.45 A cm−2.
Conclusions
In summary, this work demonstrates the feasibility of producing Ti–Fe alloys with oxide feedstock through the MOE method based on the application of a liquid iron cathode. The finding potentially provides a novel process for alloy preparation from metallurgical slags. Further work will involve detailed fundamental research on this process including the current efficiency, the detailed cathodic process of titanium ions and the optimization of the current density. With the optimization of the electrolysis conditions and anode materials to further lower environmental pollution, we expect that molten oxide electrolysis at a liquid iron cathode can be used to address the predictable resource and cost issues for the preparation of Ti–Fe alloys.Conflicts of interest
There are no conflicts of interest to declare.Acknowledgements
Thanks are given for the financial support from the National Natural Science Foundation of China (No. 51725401 and No. 51474020).References
- J. J. Reilly and R. H. Wiswall Jr, Inorg. Chem., 1974, 13, 218–222 CrossRef.
- N. Endo, S. Suzuki, K. Goshome and T. Maeda, Int. J. Hydrogen Energy, 2016, 42, 5246–5251 CrossRef.
- M. W. Davids and M. Lototskyy, Int. J. Hydrogen Energy, 2012, 37, 18155–18162 CrossRef.
- N. Endo, I. Saita, Y. Nakamura, H. Saitoh and A. Machida, Int. J. Hydrogen Energy, 2015, 40, 3283–3287 CrossRef.
- X. Wang, F. Han, X. Liu, S. Qu and Z. Zou, Wear, 2008, 265, 583–589 CrossRef.
- D. Liu, R. Liu and Y. Wei, Surf. Coat. Technol., 2012, 207, 579–586 CrossRef.
- M. Pourabdoli, S. Raygan, H. Abdizadeh and K. Hanaei, Can. Metall. Q., 2007, 46, 17–23 CrossRef.
- L. Zaluski, P. Tessier, D. H. Ryan, C. B. Doner, A. Zaluska and J. O. Strömolsen, J. Mater. Res., 1993, 8, 3059–3068 CrossRef.
- H. Hotta, M. Abe, T. Kuji and H. Uchida, J. Alloys Compd., 2007, 439, 221–226 CrossRef.
- T. Saito, J. Alloys Compd., 2004, 364, 113–116 CrossRef.
- W. J. Kroll, Trans. Am. Electrochem. Soc., 1940, 78, 35–47 CrossRef.
- G. Z. Chen, D. J. Fray and T. W. Farthing, Nature, 2000, 407, 361–364 CrossRef PubMed.
- M. Panigrahi, E. Shibata, A. Iizuka and T. Nakamura, Electrochim. Acta, 2013, 93, 143–151 CrossRef.
- M. Ma, D. Wang, X. Hu, X. Jin and G. Z. Chen, Chem.–Eur. J., 2006, 12, 5075–5081 CrossRef PubMed.
- X. S. Ye, X. G. Lu, C. H. Li, W. Z. Ding, X. L. Zou, Y. H. Gao and Q. D. Zhong, Int. J. Hydrogen Energy, 2011, 36, 4573–4579 CrossRef.
- D. R. Sadoway, J. Mater. Res., 1995, 10, 487–492 CrossRef.
- H. Kim, J. Paramore, A. Allanore and D. R. Sadoway, J. Electrochem. Soc., 2011, 158, E101–E105 CrossRef.
- A. Allanore, L. Yin and D. R. Sadoway, Nature, 2013, 497, 353–356 CrossRef PubMed.
- D. Wang, A. J. Gmitter and D. R. Sadoway, J. Electrochem. Soc., 2011, 158, E51–E54 CrossRef.
- A. H. Sirk, D. R. Sadoway and L. Sibille, ECS Trans., 2010, 28, 367–373 Search PubMed.
- K. Zhang, H. Jiao, Z. Zhou, S. Jiao and H. Zhu, J. Electrochem. Soc., 2016, 163, D710–D714 CrossRef.
- Z. Zhou, H. Jiao, J. Tu, J. Zhu and S. Jiao, J. Electrochem. Soc., 2017, 164, E113–E116 CrossRef.
- F. Lantelme and A. Salmi, J. Electrochem. Soc., 1995, 142, 3451–3456 CrossRef.
- J. Song, Q. Wang, J. Wu, S. Jiao and H. Zhu, Faraday Discuss., 2016, 190, 421–432 RSC.
- H. Jiao, J. Wang, L. Zhang, K. Zhang and S. Jiao, RSC Adv., 2015, 5, 62235–62240 RSC.
- H. Reimers, J. Gold, B. Kasemo and D. Chakarov, Appl. Phys. A, 2003, 77, 491–498 CrossRef.
- H. F. Franzen, M. X. Umaña, J. R. Mccreary and R. J. Thorn, J. Solid State Chem., 1976, 18, 363–368 CrossRef.
- D. Gonbeau, C. Guimon, G. Pfister-Guillouzo, A. Levasseur, G. Meunier and R. Dormoy, Surf. Sci., 1991, 254, 81–89 CrossRef.
- C. W. Bale, E. Bélisle, P. Chartrand, S. A. Decterov, G. Eriksson, A. E. Gheribi and A. D. Pelton, Calphad, 2016, 54, 35–53 CrossRef.
- H. Jiao, D. Tian, S. Wang, J. Zhu and S. Jiao, J. Electrochem. Soc., 2017, 164, D511–D516 CrossRef.
- J. H. Liu, G. H. Zhang and K. C. Chou, J. Electrochem. Soc., 2015, 162, E314–E318 CrossRef.
| This journal is © The Royal Society of Chemistry 2018 |

