 Open Access Article
Creative Commons Attribution 3.0 Unported Licence
High-temperature thermoelectric properties of Na- and W-Doped Ca3Co4O9 system
Uzma Hiraab,
Li Hanb,
Kion Norrmanb,
Dennis Valbjørn Christensenb,
Nini Pryds*b and
Falak Sher *a
*a
aDepartment of Chemistry and Chemical Engineering, SBA School of Science and Engineering, Lahore University of Management Sciences (LUMS), Lahore, Pakistan. E-mail: fsher@lums.edu.pk; Tel: +92 42 3560 8131
bDepartment of Energy Conversion and Storage, Technical University of Denmark, Risø DTU, Denmark. E-mail: nipr@dtu.dk; Tel: +45 46 775752
First published on 28th March 2018
Abstract
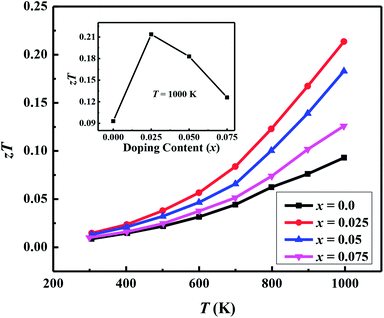
The detailed crystal structures and high temperature thermoelectric properties of polycrystalline Ca3−2xNa2xCo4−xWxO9 (0 ≤ x ≤ 0.075) samples have been investigated. Powder X-ray diffraction data show that all samples are phase pure, with no detectable traces of impurity. The diffraction peaks shift to lower angle values with increase in doping (x), which is consistent with larger ionic radii of Na+ and W6+ ions. X-ray photoelectron spectroscopy data reveal that a mixture of Co2+, Co3+ and Co4+ valence states are present in all samples. It has been observed that electrical resistivity (ρ), Seebeck coefficient (S) and thermal conductivity (κ) are all improved with dual doping of Na and W in Ca3Co4O9 system. A maximum power factor (PF) of 2.71 × 10⁻⁴ W m−1 K−2 has been obtained for x = 0.025 sample at 1000 K. The corresponding thermoelectric figure of merit (zT) for x = 0.025 sample is calculated to be 0.21 at 1000 K, which is ∼2.3 times higher than zT value of the undoped sample. These results suggest that Na and W dual doping is a promising approach for improving thermoelectric properties of Ca3Co4O9 system.
1. Introduction
Thermoelectric (TE) power generation from waste heat is considered as a promising renewable energy technology.1,2 TE devices convert thermal energy into electricity via the Seebeck effect, and electrical power into solid state refrigeration via the Peltier effect.3 In order to convert waste heat into electrical energy efficiently, good TE materials with high values of dimensionless figure of merit (zT) are required:4
 | (1) |
For practical high waste heat to electricity conversion efficiency devices, zT > 1 is an essential prerequisite. Therefore robust TE materials with large thermoelectric power factor: PF = S2/ρ and smaller thermal conductivity are required. In addition, TE materials must be stable in air at high operating temperatures over a long period of time and should be made of earth-abundant low cost elements. Conventional thermoelectric materials such as Bi2Te3 (Tmax = 550 K), SiGe (Tmax > 1300 K expensive and oxidation sensitive) and half-Heusler compounds (Tmax = 850 K) do not meet all requirements for high temperature thermoelectric applications.5–7 Transition metal oxides are promising candidates and have been explored for their potential applications in high temperature thermoelectric devices. A number of transition metal oxides such as CaMnO3,2 Al-doped ZnO8 and Ta-doped SrTiO3 (ref. 9) show good thermoelectric properties and are stable in air at high temperatures of around 1000 K. Moreover, metal oxides can be synthesized from non-toxic and inexpensive precursors10 and can possibly segmented with non-oxide materials in TE modules to increase the efficiency of devices.11 Consequently, significant research efforts have been recently devoted to the development of thermoelectric generators (TEGs) for automotive applications.12 Among the transition metal oxides, misfit-layered cobaltites such as NaxCoO2,13 Ca3Co4O9,14 CuAlO2 (ref. 15) and Bi2Sr2Co2Ox (ref. 16) are considered to be promising p-type thermoelectric oxides for high temperature applications. Misfit-layered Ca3Co4O9 (abbreviated as C-349 in the following text) cobaltite is especially an interesting candidate material due to its good thermoelectric performance (zT ∼ 0.83 at 973 K for single crystal Ca3Co4O9 and ∼0.64 at 1073 K for heavily doped polycrystalline Ca3Co4O9+δ materials with metallic nanoinclusions), and its high thermal and chemical stabilities in air.17,18
Ca3Co4O9 cobaltite has a monoclinic misfit structure with superspace group (X2/m(0b0)s0) crystal symmetry. C-349 compound is generally described as [Ca2CoO3][CoO2]1.61 and its high performance is linked with its unique layered crystal structure.14 It consists of two subsystems: a NaCl-type rocksalt (RS) Ca2CoO3 layer [subsystem 1] sandwiched between two CdI2-type (H) CoO2 hexagonal layers [subsystem 2].19 These two subsystems share the same a, c and β lattice parameters, and stack alternatively along the c axis. The mismatch of two unit cells results in dissimilar lattice parameters along the b axis i.e., b1 [subsystem 1] and b2 [subsystem 2] with a ratio b1(RS)/b2(H) ∼ 1.61. The Ca2CoO3 (RS)-type block is an insulating layer whereas CoO2 (H) sheet is conductive.20
Recently, a number of research studies have focused on improving the TE performance of C-349 polycrystalline materials by using innovative synthesis methods such as spark plasma sintering (SPS),21 hot pressing,22 auto-combustion synthesis and sol–gel based electrospinning followed by SPS23,24 etc. Chemical substitution of alternate metal cations at both Ca- and Co-sites of Ca3Co4O9 is another approach that has been used to fine tune the electrical and thermal transport properties of TE oxides. These studies include partial substitution of Na, Bi, Y, Ag, Nd, Sr and Pb ions25–32 at Ca-sites, which adjusts the carrier concentration without changing much the band structure of materials, and substitution of Fe, Mn, Cu, Ti, Ga, Mo, W and In ions33–38 at Co-sites with significant changes in the band structure and transport mechanism. In another research work, it was reported that doping of Na ions at Ca-sites resulted in decrease of electrical resistivity and as a consequence increase of thermoelectric power factor to ∼5.5 × 10⁻⁴ W m−1 K−2 at 1000 K, though thermal conductivity (κ) of these samples was still too high (4.0 W m−1 K−1), impeded the further improvement of zT values.25 On the other hand, high valence 4d and 5d transition metal-doped C-349 samples exhibited much smaller thermal conductivity with reasonably good zT values.39 There are some research studies on simultaneous substitution of two different metal cations at Ca- and Co-sites in C-349 system with significant improvement in TE properties with zT values of ∼0.20–0.25.40–42 However, there are no reports published on dual doping of Na and W metals in Ca3Co4O9 cobaltite as yet.
This prompted us to prepare a series of Ca3−2xNa2xCo4−xWxO9 (0 ≤ x ≤ 0.075) oxides by the conventional solid-state reaction method, and investigate their structural and high-temperature thermoelectric properties. We anticipated that Na and W dual doping in C-349 system would increase the Seebeck coefficient and electrical conductivity while thermal conductivity would decrease due to the W substitution. In this way, we expected to achieve much better zT values for these materials.
2. Experimental
Polycrystalline samples of Ca3−2xNa2xCo4−xWxO9 (0 ≤ x ≤ 0.075) series were prepared by the conventional solid-state reaction method. Stoichiometric quantities of CaCO3 (≥99.5%; Sigma-Aldrich), Co3O4 (≥99.5%; Sigma-Aldrich) and Na2WO4·2H2O (≥99.5%; Sigma-Aldrich) were ground, thoroughly mixed and pressed into pellets and initially sintered at 700 °C for 8 h. Sintered pellets were reground, pressed into pellets again and sintered twice at 900 °C for 8 h, with intermediate grinding and pelletizing, at a heating rate of 10 °C min−1 in air and slowly cooled down to room temperature.Powder X-ray diffraction (XRD) data were collected in 2 theta range 5° ≤ 2θ ≤ 60° with a step size of 0.02° using a Bruker D8 Advanced diffractometer at room temperature with Cu Kα (λ = 1.5406 Å) radiation. Rietveld refinements of XRD data were performed using a computer program JANA2006.43 Surface morphology of samples was studied using a FEI Nova NanoSEM 450 scanning electron microscope (SEM). X-ray photoelectron spectroscopy (XPS, Thermo Electron Limited, Winsford, UK) was used to examine the oxidation states of Co and W ions in C-349 based materials. Analyses were performed using a monochromatic (Al-Kα) X-ray source at room temperature with a take-off angle of 90° from the surface plane. High-resolution Co 2p and W 4f XPS spectra were recorded using 50 eV detector pass energy and 10 scans. The binding energies were assessed by referencing to the Au 4f peak at 84.0 eV. Hall measurements were carried out at room temperature by using van der Pauw method with a (5.08 T) superconducting magnet.
The Seebeck coefficient (S) and electrical resistivity (ρ) were simultaneously measured from room temperature to 1000 K with an ULVAC-RIKO ZEM3 under a low pressure helium atmosphere. The thermal diffusivity (α) was measured with (NETZSCH LFA-457) laser flash system under vacuum. The heat capacity (Cp) was estimated using temperature independent Dulong–Petit law. The thermal conductivity (κ) was calculated using equation (κ = α·ρ·Cp), where Cp, ρ and α are the specific heat capacity, mass density and thermal diffusivity, respectively. Mass density of the samples was measured by Archimedes method using water with a few drops of surfactant.
3. Result and discussion
3.1. Crystal structure and surface morphology
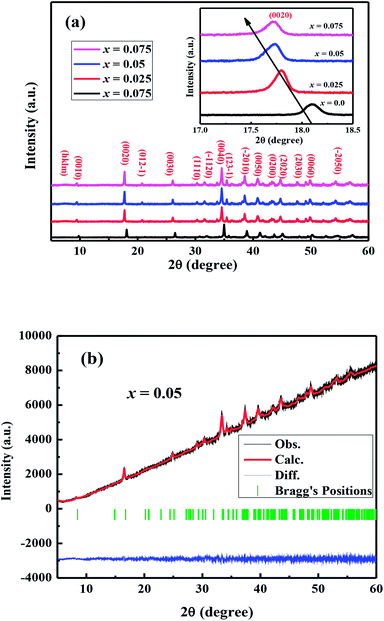
The crystal structures of Ca3−2xNa2xCo4−xWxO9 (0 ≤ x ≤ 0.075) samples were analyzed by collecting the powder X-ray diffraction data at room temperature. The diffraction peaks in XRD patterns of all samples (Fig. 1(a)) are identical to the standard JCPDS card (21-139) of C-349 system,44 indicating the formation of phase pure compounds. The enlarged portions of (0020) diffraction peaks are presented in inset of Fig. 1(a) to illustrate the effect of Na and W dual doping on C-349 crystal structure. It can be clearly seen that the diffraction peaks shift to lower 2θ values with increase in doping content (x). The XRD data was Rietveld refined using a computer program JANA 2006 (ref. 43) in the superspace group X2/m(0b0)s0 and the resulting structural parameters are listed in Table 1. The refined XRD pattern of x = 0.05 sample is shown in Fig. 1(b), as an example. It can be seen from Table 1 and Fig. 2 that the lattice parameters a, b1, c and unit cell volumes (V1 and V2) all slightly increase with increase in doping content (x), which is consistent with the observed shifting of diffraction peaks to lower 2θ values. However, the values of b2 decrease with increase in doping suggesting that there is an increase of crystallographic distortion. This trend in the lattice parameters with doping is in agreement with the observation that ionic radii of Na+ (1.02 Å) and W6+ (0.6 Å) ions are larger than the corresponding Ca2+ (1.0 Å) and Co3+ (0.545 Å)/Co4+ (0.53 Å) ions in the six coordination number,45 respectively. The quality factors like GOF, Rwp and Rp (Table 1) are all within the acceptable statistical range, suggesting that the Rietveld refinements of samples are reliable.| Composition Ca3−2xNa2xCo4−xWxO9 | x = 0.0 | x = 0.025 | x = 0.05 | x = 0.075 |
|---|---|---|---|---|
| a b1 and b2 are the b-axis lattice parameter for [Ca2CoO3] and [CoO2] subsystems, respectively. | ||||
| Lattice parameters | ||||
| a (Å) | 4.8229(2) | 4.8231(5) | 4.8268(5) | 4.8335(2) |
| b1 (Å) | 4.5453(2) | 4.5690(8) | 4.5671(9) | 4.5689(8) |
| b2 (Å) | 2.8215(3) | 2.8134(3) | 2.8103(8) | 2.8145(3) |
| c (Å) | 10.8215(9) | 10.8394(2) | 10.8557(2) | 10.8498(2) |
| β (deg) | 98.807(3) | 98.329(1) | 98.582(8) | 98.396(4) |
| δ (b1/b2) | 1.61 | 1.62 | 1.62 | 1.62 |
| V1 (Å)3 | 234.7(4) | 236.3(4) | 236.6(4) | 237.0(4) |
| V2 (Å)3 | 145.2(7) | 145.5(7) | 145.6(7) | 146.0(7) |
![[thin space (1/6-em)]](https://www.rsc.org/images/entities/char_2009.gif) |
||||
| Reliability factors | ||||
| Rwp (%) | 3.99 | 2.94 | 2.41 | 1.97 |
| Rp (%) | 3.25 | 2.34 | 1.93 | 1.51 |
| GOF | 3.29 | 2.44 | 1.84 | 1.97 |
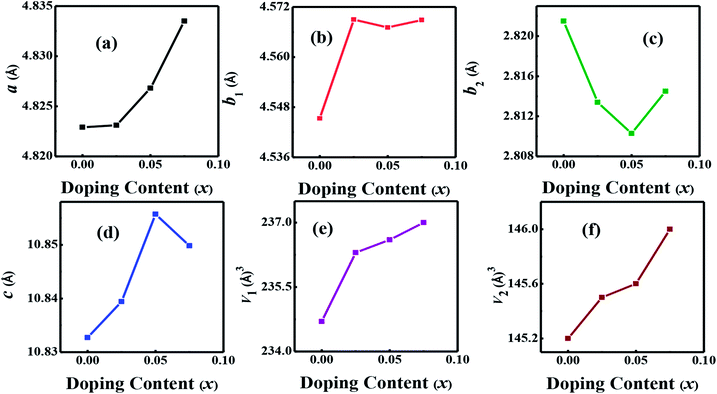 | ||
| Fig. 2 Structural parameters a, b1, b2, c, V1 and V2 as a function of doping content (x) for Ca3−2xNa2xCo4−xWxO9 (0 ≤ x ≤ 0.075) series. | ||
The morphology of samples in two different directions, parallel (‖p) and perpendicular (⊥p), to the pellets pressure axis (Fig. 3) were studied by the scanning electron microscopy in order to find out if there is any micro-dimensional anisotropy in these layered materials. The grain morphology in both parallel (‖p) and perpendicular (⊥p) directions of the pressure axis seems to be almost identical, suggesting that there is no or negligible anisotropy that can be observed on a micrometer scale. The SEM images show the plate-like crystal grains morphology, which is a typical feature of materials, including C-349 system, that are prepared by the conventional solid state chemistry method.46 Close inspection of the SEM micrograph for x = 0.025 sample reveals that crystal grains are larger (∼2.52 μm) and more compact than crystal grains of other samples (0.83–1.45 μm). The measured densities for all samples are in the range ∼86–94% of the theoretical density (Table 2).
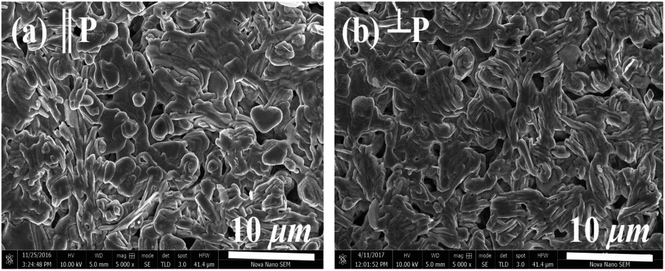 | ||
| Fig. 3 SEM micrographs of (a) parallel (‖P) and (b) perpendicular (⊥P) surfaces for x = 0.05 sample. | ||
| Composition Ca3−2xNa2xCo4−xWxO9 | x = 0.0 | x = 0.025 | x = 0.05 | x = 0.075 |
|---|---|---|---|---|
| Average grain size (μm) | 0.83 (±0.002) | 2.52 (±0.09) | 1.45 (±0.005) | 0.80 (±0.007) |
| Density (g cm−3) | 3.801 (±0.02) | 4.09 (0.045) | 3.98 (±0.032) | 3.844 (±0.068) |
| Theoretical density (g cm−3) | 4.37 | 4.37 | 4.38 | 4.39 |
| Relative density (%) | 86.27 | 94.67 | 90.87 | 87.56 |
| Mobility, μ300 K (cm2 V−1 s−1) | 0.64 | 0.82 | 0.74 | 0.65 |
| ρT = 1000 K × 10−5 (Ωm) | 23.98 | 13.07 | 16.09 | 27.54 |
| Ea (meV) | 49 | 98 | 103 | 76 |
| ST = 1000 K (μV K−1) | 174.99 | 182.72 | 192.67 | 215.99 |
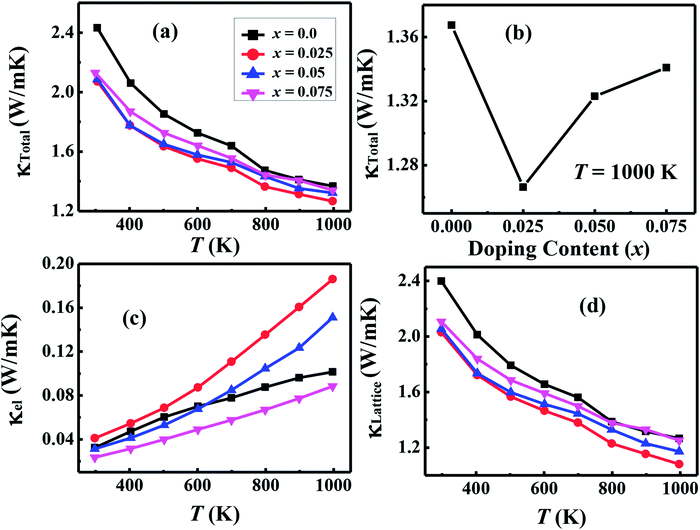
| κT = 1000 K(W m−1 K−1) | 1.367 | 1.266 | 1.323 | 1.343 |
| zTT = 1000 K | 0.093 | 0.21 | 0.18 | 0.13 |
The binding energies of Co 2p and W 4f sub-shells of selected samples were estimated from the high resolution XPS measurements as shown in Fig. 4. As reported elsewhere, the XPS spectrum of Co 2p splits into two parts, Co 2p3/2 and 2p1/2 with an intensity ratio of approximately (2![[thin space (1/6-em)]](https://www.rsc.org/images/entities/char_2009.gif) :
:![[thin space (1/6-em)]](https://www.rsc.org/images/entities/char_2009.gif) 1) due to the spin–orbit coupling.47 The line shapes of both Co 2p3/2 and 2p1/2 spectra are similar to the reported results in literature.48 The main peaks corresponding to the Co 2p3/2 energy are located at 778.8 eV, 779.69 eV and 781.0 eV corresponding to x = 0.0, 0.025 and 0.075 samples, respectively. Shake-up satellite peaks due to the metal-to-ligand charge transfer processes at higher binding energies than the 2p3/2 and 2p1/2 main peaks are also detected. The observed variations in Co 2p3/2 binding energies can be explained by the larger electronegativity of tungsten (2.36, Pauli scale) than cobalt (1.88, Pauli scale).49 With careful analysis of XPS data, we can predict that Co ions have three types of valence states: Co2+, Co3+ and Co4+ in all samples. However, the average valence state of Co is most likely between 3+ and 4+ as reported elsewhere.50,51 The observed increase in binding energies of Co 2p3/2 peaks suggests that the relative population of Co3+ ions is decreasing with increase in doping. The 4f5 and 4f7 peaks for W ions closely resemble with the reference peaks of WO3, indicating that they are present in W6+ valence states in all samples.
1) due to the spin–orbit coupling.47 The line shapes of both Co 2p3/2 and 2p1/2 spectra are similar to the reported results in literature.48 The main peaks corresponding to the Co 2p3/2 energy are located at 778.8 eV, 779.69 eV and 781.0 eV corresponding to x = 0.0, 0.025 and 0.075 samples, respectively. Shake-up satellite peaks due to the metal-to-ligand charge transfer processes at higher binding energies than the 2p3/2 and 2p1/2 main peaks are also detected. The observed variations in Co 2p3/2 binding energies can be explained by the larger electronegativity of tungsten (2.36, Pauli scale) than cobalt (1.88, Pauli scale).49 With careful analysis of XPS data, we can predict that Co ions have three types of valence states: Co2+, Co3+ and Co4+ in all samples. However, the average valence state of Co is most likely between 3+ and 4+ as reported elsewhere.50,51 The observed increase in binding energies of Co 2p3/2 peaks suggests that the relative population of Co3+ ions is decreasing with increase in doping. The 4f5 and 4f7 peaks for W ions closely resemble with the reference peaks of WO3, indicating that they are present in W6+ valence states in all samples.
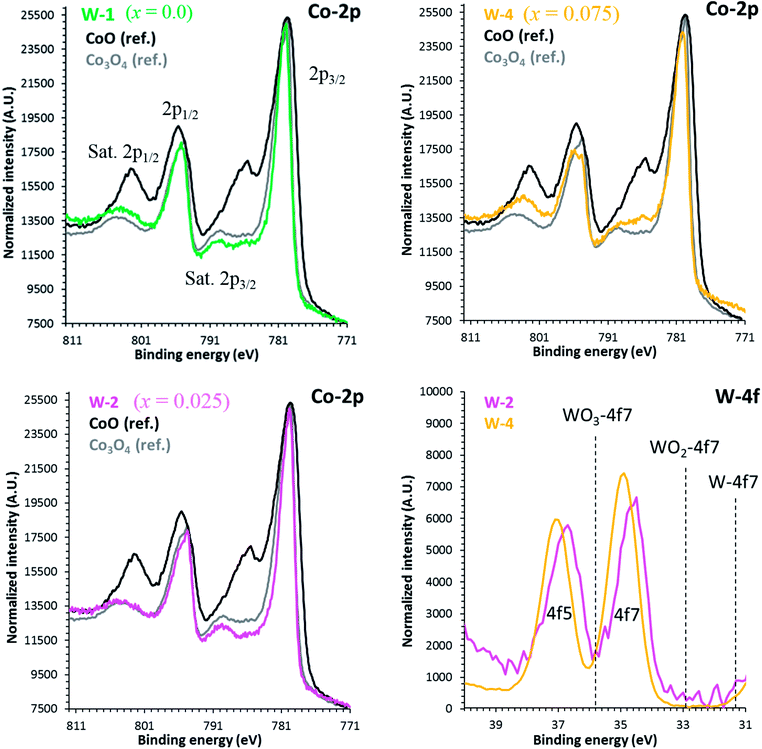 | ||
| Fig. 4 High resolution XPS spectra of Co 2p and W 4f for C-349 doped samples. Reference positions are taken from the NIST database. | ||
3.2. Thermoelectric properties
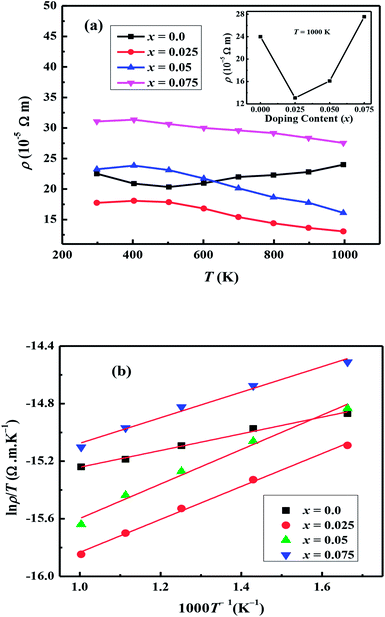
The temperature dependent electrical resistivities, ρ(T), as a function of Na and W co-doping (x) are shown in Fig. 5(a). The ρ(T) curve for x = 0.0 sample exhibits a semiconducting like behavior (dρ/dT < 0) from room temperature to around 500 K, and then shows a transition to metallic like behavior (dρ/dT > 0) from 600 K onwards. This kind of behavior in resistivity of C-349 system has been previously attributed to the spin-state transition,52 removal of oxygen atoms from porous layered cobaltites38 and structural distortion in Ca2CoO3 sheets.53 On the other hand, all doped samples show metallic behavior at low temperatures before showing a transition to semiconducting behavior above 400 K. The absolute values of resistivity at 1000 K for x = 0.025 and 0.05 samples are smaller than that of undoped sample, but higher for x = 0.075. This shows that dual doping of small amounts of Na and W has beneficial effect on resistivity of our samples.We can describe the high temperature electrical resistivity of cobaltites using the small polaron hopping model,54 which is given by the following relation:
 | (2) |
The linear fits of ln(ρ/T) versus 1/T above 600 K, as shown in Fig. 5(b), suggest that the small polaron hopping model applies well to the electrical resistivity of these materials. The slopes of straight lines (Ea/kB) were used to estimate the activation energies for all samples as listed in Table 2. It has been observed that Ea values for doped samples are relatively higher than the pristine C-349 system. This suggests that energy demand for carriers to jump from the top of valence band to the bottom of conduction band, in general, increases with doping in our samples. However, this variation could also be due to the creation of some in-gap states which would change with doping. As discussed elsewhere, hoping of carriers occurs between Co3+ and Co4+ in CoO2 layer and as a consequent the ratio of Co3+ and Co4+ ions directly affects the hopping distance in these materials.55 We anticipate that concentration of Co4+ ions would decrease with increase in doping of W6+ ions resulting in increase of hopping distance and therefore increase in activation energies with doping. Similar results have been reported for the activation energies of Fe, Ag, Gd and Y doped misfit layered cobaltites.41,55,56
Hall effect measurements were carried out at room temperature for all samples, to determine the carrier concentration and their mobility as a function of dopant. It has been observed that carrier concentration (n300 K) initially increases from 5.12 × 1019 cm−3 (x = 0.0) to 6.59 × 1019 cm−3 (x = 0.025) with doping and then decreases again to 4.48 × 1019 cm−3 (x = 0.075) with further increase in doping content as shown in Fig. 6. This increase in carrier concentration at low doping level is probably due to the substitution of Na+ for Ca2+ ions in C-349 system which results in increase of the number of hole carriers. With further increase in doping content (x), structural distortions and electron-doping like behavior of W6+ ions, due to the higher valence state of W6+ than Co3+ and Co4+ ions, start to dominate and result in decrease of carrier concentration. The carrier mobilities (μ300 K) also follow the same trend and decrease to a value of 0.65 cm2 V−1 s−1 with increase in doping after showing the maximum value for x = 0.025 sample (Table 2). These trends in n300 K and μ300 K together with the larger grain sizes (Table 2) of Na and W dual doped samples can be used to explain the electrical resistivity of these materials. With the largest values of n300 K, μ300 K and grain sizes, the x = 0.025 sample has the lowest value of electrical resistivity and then ρ increases with increase in doping according to the equation: 1/ρ = neμ.
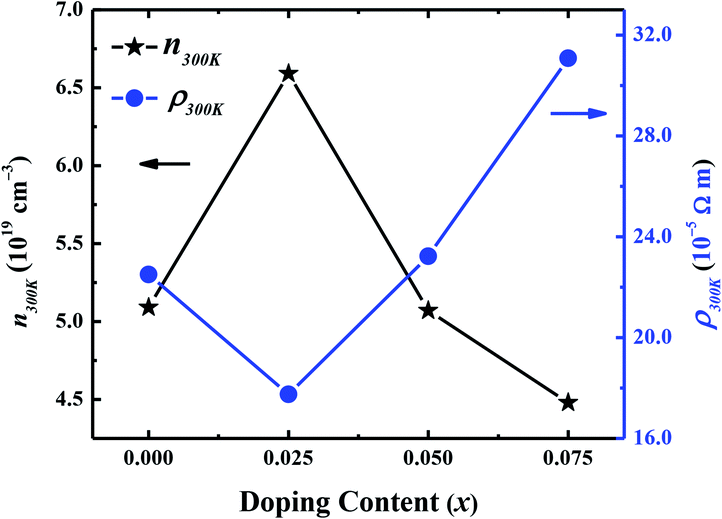 | ||
| Fig. 6 Room temperature carrier concentration (n300 K) and electrical resistivity (ρ300 K) as a function of doping (x) for Ca3−2xNa2xCo4−xWxO9 (0 ≤ x ≤ 0.075) samples. | ||
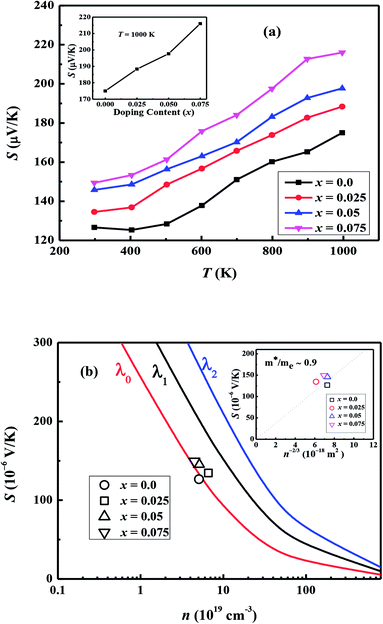
Fig. 7(a) shows the temperature dependence of thermopower (S) of the Ca3−2xNa2xCo4−xWxO9 samples. The sign of S is positive for all samples suggesting that holes are the majority charge carriers. The values of S increase with increase in temperature for all samples. It is also evident from Fig. 7(a) (inset) that thermopower values increase with increase in doping content (x). The maximum value of 216 μV K−1 at 1000 K for x = 0.075 sample is higher than previously reported S values for Na doped C-349 system (187 μV K−1) at this temperature.25,40 As discussed above, x = 0.025 sample shows the largest values of n300 K and μ300 K, and then values of these quantities decrease with further increase in doping. This is consistent with the observed behavior of S with doping in our samples.26,28 The contribution of carrier concentration and carrier mobility, μ(ε) in describing S is given by the Mott's formula (originated from the Sommerfeld expansion).57
 | (3) |
By using [σ = enμ(ε)] in eqn (3), we can get:
 | (4) |
 in above equation is dominant.58 In Na and W dual doped samples, carrier concentration (n) decreases with increase in doping (x) and therefore thermopower (S) increases. However, x = 0.0 sample does not follow this trend suggesting that the electronic specific heat (Ce) and second term in above equation are the dominated factors here. Wang et al., reported that Fe doping in C-349 system increases the carrier concentration (n) and the electronic specific heat (Ce), but the effect of Ce dominates over n which results in larger S values for doped samples.59 (2) We could assume that slope of the density of states at Fermi level is the main contribution to the second part of the above equation for undoped sample. (3) Partial substitution of W6+ for Co3+/Co4+ ions decreases hole carriers and thus results in an increase of thermopower.
According to the Pisarenko relation for degenerated semiconductors:
 | (5) |
 | (6) |
 | (7) |
 | (8) |
We have used the electrical resistivity and thermopower values to calculate the thermoelectric power factor PF = S2/ρ for all samples as shown in Fig. 8. The PF values increase with increase in temperature for all samples due to increase of thermopower with temperature. We can also see from Fig. 8 that PF values are significantly improved with Na and W dual doping in C-349 system. Among all doped samples, x = 0.025 sample exhibits the highest PF of 2.71 × 10⁻⁴ W m−1 K−2 at 1000 K which is about 2.3 times more than PF, 1.27 × 10⁻⁴ W m−1 K−2, of undoped sample. The PF obtained in this work is higher than the previously reported value of ∼2.1 × 10⁻⁴ W m−1 K−2 at 1073 K for Ca3Co3.97Cu0.03O9 sample prepared by the conventional solid state reaction method.61
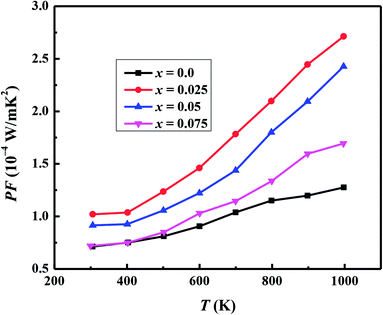 | ||
| Fig. 8 Power factor (PF) for Ca3−2xNa2xCo4−xWxO9 (0 ≤ x ≤ 0.075) samples as a function of temperature. | ||
4. Conclusion
Polycrystalline samples of Ca3−2xNa2xCo4−xWxO9 (0 ≤ x ≤ 0.075) have been synthesized by the conventional solid state reaction method. Powder X-ray diffraction data revealed that Na+ and W6+ ions enter into the Ca2CoO3 and CoO2 layers of Ca3Co4O9 system respectively. High resolution XPS data showed that the average valence state of Co in our samples is between 3+ and 4+. Significant improvements in ρ, S and κ values of Na and W dual doped samples have been observed. These results are also supported by the carrier concentrations (n) and carrier mobility (μ) as confirmed by the Hall effect measurements. The observed power factor (PF) and thermoelectric figure of merit (zT) of 2.71 × 10⁻⁴ W m−1 K−2 and 0.21 respectively at 1000 K for x = 0.025 sample are comparable or slightly higher than most of the reported results of C-349 based materials, prepared by the conventional solid state reaction method. These results show that Na and W dual doping is an effective route for improving thermoelectric properties of Ca3Co4O9 system.Conflicts of interest
There are no conflicts to declare.Acknowledgements
We are thankful to the Higher Education Commission (HEC) of Pakistan (Grant no. 1981), and the International Research Support Initiative Program of HEC for providing financial support to us. UH is grateful to the Department of Energy Conversion and Storage, Technical University of Denmark (DTU) for the support.References
- L. E. Bell, Science, 2008, 321, 1457 CrossRef CAS PubMed.
- T. Wu, T. A. Tyson, J. Bai, K. Pandya, C. Jaye and D. Fischer, J. Mater. Chem. C, 2013, 1, 4114–4121 RSC.
- G. J. Snyder and E. S. Toberer, Nat. Mater., 2008, 7, 105 CrossRef CAS PubMed.
- D. M. Rowe, Thermoelectrics Handbook – Macro to Nano, CRC Press, Taylor & Francis Group, Boca Raton, Florida, 2006 Search PubMed.
- G. J. Synder, E. Christensen, E. Nishibori, T. Gaillat and B. B. Iversen, Nat. Mater., 2004, 3, 458 CrossRef PubMed.
- X. B. Zhao, X. H. Ji, Y. H. Zhang, T. J. Zhu, J. P. Tu and X. B. Zhang, Appl. Phys. Lett., 2005, 86, 062111 CrossRef.
- D. Zhao, C. Tian, S. Tang, Y. Liu and L. Chen, J. Alloys Compd., 2010, 504, 552 CrossRef CAS.
- L. Han, N. V. Nong, W. Zhang, L. T. Hung, T. Holagate, K. Tashiro, M. Ohtaki, N. Pryds and S. Linderoth, RSC Adv., 2014, 4, 12353 RSC.
- A. A. Yaremchenko, S. Populoh, S. G. Patrico, J. Macias, P. Thiel, D. P. Fagg, A. Weidenkaff, J. R. Frade and A. V. Kovalevsky, Chem. Mater., 2015, 27, 4995 CrossRef CAS.
- J. W. Fergus, J. Eur. Ceram. Soc., 2012, 32, 525 CrossRef CAS.
- P. H. Ngan, D. V. Christensen, G. J. Synder, L. T. Hung, S. Linderoth, N. V. Nong and N. Pryds, Phys. Status Solidi A, 2014, 211, 9 CrossRef CAS.
- X. Liu, Y. D. Deng, Z. Li and C. Q. Su, Energy Convers. Manage., 2015, 90, 121 CrossRef.
- Y. Terasaki, K. Sasago and K. Uchinokura, Phys. Rev. B: Condens. Matter, 1997, 56, R12685 CrossRef.
- A. C. Masset, C. Michel, A. Maignan, M. Hervieu, O. Toulemonde, F. Studer, B. Raveau and J. Hejtmanek, Phys. Rev. B: Condens. Matter, 2000, 62, 166 CrossRef CAS.
- S. Yanagiya, N. V. Nong, X. Jianxiao and N. Pryds, Materials, 2010, 3, 318 CrossRef CAS.
- F. Funahashi, I. Matsubara and S. Sodeoka, Appl. Phys. Lett., 2000, 76, 2385 CrossRef.
- M. Shikano and R. Funahashi, Appl. Phys. Lett., 2003, 82, 1851 CrossRef CAS.
- N. V. Nong, N. Pryds, S. Linderoth and M. Ohtaki, Adv. Mater., 2011, 23, 2484 CrossRef PubMed.
- D. Grebille, S. Lambert, F. Bouree and V. Petricek, J. Appl. Crystallogr., 2004, 37, 823 CAS.
- G. Yang, Q. Ramasse and R. F. Klie, Phys. Rev. B: Condens. Matter Mater. Phys., 2008, 78, 153109 CrossRef.
- J. G. Noudem, D. Kenfaui, D. Chateigner and M. Gomina, J. Electron. Mater., 2011, 40, 1100 CrossRef CAS.
- V. Garnier, R. Caillard, A. Sotelo and G. Desgardin, Phys. C, 1999, 319, 197 CrossRef CAS.
- N. Y. Wu, T. C. Holgate, N. V. Nong, N. Pryds and S. Linderoth, J. Eur. Ceram. Soc., 2014, 34, 925 CrossRef CAS.
- T. Yin, D. Liu, Y. Ou, F. Ma, S. Xie, J.-F. Li and J. Li, J. Phys. Chem. C, 2010, 114, 10061 CAS.
- G. Xu, R. Funahashi, M. Shikano, Q. Pu and B. Liu, Solid State Commun., 2002, 124, 73 CrossRef CAS.
- G. Xu, R. Funahashi, M. Shikano, I. Matsubara and Y. Zhou, Appl. Phys. Lett., 2002, 80, 3760 CrossRef CAS.
- Y. Song, Q. Sun, L. Zhao and F. Wang, Key Eng. Mater., 2010, 434, 393 CrossRef.
- Y. Wang, Y. Sui, J. G. Cheng, X. J. Wang, W. H. Su, X. Y. Liu and H. J. Fan, J. Phys. Chem. C, 2010, 114, 5174 CAS.
- Y. Wang, Y. Sui, J. Cheng, X. Wang, J. Miao, Z. Liu, Z. Qian and W. Su, J. Alloys Compd., 2008, 448, 1 CrossRef CAS.
- M. Prevel, S. E. Reddy, O. Perez and W. Kobayashi, Jpn. J. Appl. Phys., 2007, 46, 6533 CrossRef CAS.
- F. Delorme, C. F. Martin, P. Marudhachalam, D. O. Ovono and G. Guzman, J. Alloys Compd., 2011, 509, 2311 CrossRef CAS.
- S. Demirel, E. Altin, E. Oz, S. Altin and A. Bayri, J. Alloys Compd., 2015, 627, 430 CrossRef CAS.
- Y. Wang, P. Sui, P. Ren, L. Wang, X. J. Wang, W. H. Su and H. J. Fan, Chem. Mater., 2010, 22, 1155 CrossRef CAS.
- B. C. Zhao, Y. P. Sun and W. H. Song, J. Appl. Phys., 2006, 99, 073906 CrossRef.
- R. Tian, R. Donelson, C. D. Ling, E. R. Blanchard, T. Zhang, D. Chu, T. T. Tan and S. Li, J. Phys. Chem. C, 2013, 117, 13382 CAS.
- Y. Fu, B. Zhao, Y. Huang, J. Yang, J. Dai, M. Zhou and Y. Sun, Solid State Commun., 2011, 151, 933 CrossRef CAS.
- Y. Fu, B. Zhao, Y. Huang, J. Dai and Y. Sun, Phys. B, 2013, 414, 16 CrossRef CAS.
- Y. Huang, B. Zhao, R. Ang, S. Lin, Z. H. Huang, L. Yin, S. Tan, Y. Liu, W. Song and Y. Sun, J. Am. Ceram. Soc., 2013, 96, 791 CrossRef CAS.
- Y. Huang, B. Zaho, R. Ang, S. Lin, W. Song and Y. Sun, J. Alloys Compd., 2013, 574, 233 CrossRef CAS.
- Y. Ou, J. Peng, F. Li, Z. X. Yu, F. Y. Ma, S. H. Xie, J. F. Li and J. Y. Li, J. Alloys Compd., 2012, 526, 139 CrossRef CAS.
- S. Butt, Y. C. Liu, J. L. Lan, K. Shehzad, B. Zhan, Y. Lin and C. W. Nan, J. Alloys Compd., 2014, 588, 277 CrossRef CAS.
- N. Y. Wu, N. V. Nong, N. Pryds and S. Linderoth, J. Alloys Compd., 2015, 638, 127 CrossRef CAS.
- M. D. Petricek and L. Palatinous, JANA2006, The Crstallographic Computing System, Institute of Physics, Praha, Czech Republic, 2006 Search PubMed.
- T. Wu, T. Tyson, J. M. Bai, K. Pandya, C. Jaye and D. A. Fischer, J. Mater. Chem. C, 2013, 1, 4114 RSC.
- R. D. Shannon, Acta Crystallogr., Sect. A: Cryst. Phys., Diffr., Theor. Gen. Crystallogr., 1976, 32, 751 CrossRef.
- S. Li, R. Funahashi, I. Matsubara, K. Ueno, S. Sodeoka and H. Yamada, Chem. Mater., 2000, 12, 2424 CrossRef CAS.
- P. Limelette, J. C. Soret, H. Muguerra and D. Grebille, Phys. Rev. B: Condens. Matter Mater. Phys., 2008, 77, 245123 CrossRef.
- Y. Wakisaka, S. Hirata, T. Mizokawa, Y. Suzuki, Y. Miyazaki and T. Kajitani, Phys. Rev. B: Condens. Matter Mater. Phys., 2008, 78, 255107 CrossRef.
- D. Marani, R. H. Silva, A. Dankeaw, K. Norman, R. M. L. Wercheister, D. Ippolito, M. Gudik-Sørensen, K. K. Hansen and V. Esposito, New J. Chem., 2017, 41, 3466 RSC.
- T. Mizokawa, L. H. Tjeng, H.-J. Lin, C. T. Chen, R. Kitawaki, I. Terasaki, S. Lambert and C. Michel, Phys. Rev. B: Condens. Matter Mater. Phys., 2005, 71, 193107 CrossRef.
- C. S. Lim, C. K. Chua, Z. Sofer, O. Jankovský and M. Pumera, Chem. Mater., 2014, 26, 4230 CrossRef.
- Y. Huang, B. Zhao, X. Hu, S. Lin, R. Ang, W. Song and Y. Sun, Dalton Trans., 2012, 41, 11176 RSC.
- T. Wu, T. A. Tyson, H. Chen, J. Bai, H. Wang and C. Jaye, J. Phys.: Condens. Matter, 2012, 24, 455602 CrossRef PubMed.
- N. F. Mott and E. A. Davis, Electronic Processes in Non-Crystalline Materials, Clarendon Press, Oxford, 1971 Search PubMed.
- H. Q. Liu, X. B. Zhao, T. J. Zhu, Y. Song and F. P. Wang, Curr. Appl. Phys., 2009, 9, 409 CrossRef.
- F. P. Zhang, X. Zhang, Q. M. Lu, J. X. Zhang, Y. Q. Liu and G. Z. Zhang, Solid State Ionics, 2011, 201, 1 CrossRef CAS.
- G. C. Mclntosh and A. B. Kaiser, Phys. Rev. B: Condens. Matter Mater. Phys., 1996, 54, 12569 CrossRef.
- N. W. Aschcroft and N. D. Mermin, Solid State Phys, Philadelphia, Saunders, 1976 Search PubMed.
- Y. Wang, Y. Sui, X. Wang, W. Su and X. Liu, J. Appl. Phys., 2014, 107, 033708 CrossRef.
- A. F. May and G. J. Synder, Introduction to Modelling Thermoelectric Transport at High Temperatures in Thermoelectrics and its Energy Harvesting, ed. D. M. Rowe, CRC Press, Boca Raton, 2012 Search PubMed.
- S. H. Rasekh, M. A. Torres, G. Constantinescu, M. A. Madre, J. C. Diez and A. Sotelo, J. Mater. Sci.: Mater. Electron., 2013, 24, 2309 CrossRef CAS.
- Y. Masuda, D. Nagahama, H. Itahara, T. Tani, W. S. Seo and K. Koumoto, J. Mater. Chem., 2003, 13, 1094 RSC.
- H. Q. Liu, X. B. Zhao, T. J. Zhu, Y. Song and F. P. Wang, Curr. Appl. Phys., 2009, 9, 409 CrossRef.
- S. Porokhin, L. Shvanskaya, V. Khovaylo and A. Vasiliev, J. Alloys Compd., 2017, 695, 2844 CrossRef CAS.
| This journal is © The Royal Society of Chemistry 2018 |

