 Open Access Article
Retracted Article: High-throughput metabolomics identifies serum metabolic signatures in acute kidney injury using LC-MS combined with pattern recognition approach
Hai-Hong Li†
a,
Jian-Liang Pan†b,
Su Huic,
Xiao-Wei Maa,
Zhi-Long Wangd,
Hui-Xin Yaoe,
Jun-Feng Wange and
Hong Li *f
*f
aDepartment of Critical-Care Medicine, Mudanjiang Medical University Affiliated HongQi Hospital, Mudanjiang, 157000, China
bDepartment of Critical-Care Medicine, The Second People's Hospital of Weifang, Weifang, 261041, China
cDepartment of Operating Theatre, The Second Affiliated Hospital of Mudanjiang Medical University, Mudanjiang, 157000, China
dDepartment of Postgraduate Culture Department, The First Clinical Medicine School of Mudanjiang Medical University, Mudanjiang, 157000, China
eDepartment of Medical Department, Mudanjiang Medical University Affiliated HongQi Hospital, Mudanjiang, 157000, China
fClinical Skills Center of the First Clinical College, Mudanjiang Medical University, Mudanjiang, 157000, China. E-mail: metabolomics123@163.com; lh-li-hong@163.com; Tel: +86-0453-6602104 Tel: +86-1594-5325338
First published on 18th April 2018
Abstract
Metabolomics, as a promising and powerful approach, refers to comprehensive assessment and identification of small molecule endogenous metabolites in a biological system which is capable of further understanding the mechanisms of diseases for early diagnosis, effective treatment and prognosis. Acute kidney injury (AKI) induced by contrast is a serious complication in patients undergoing administration of iodinated contrast media. It is becoming a major health concern in clinic, however, the molecular mechanisms of contrast-induced acute kidney injury (CI-AKI) have not been well characterized. In this study, we used serum metabolomics based on liquid chromatography-mass spectrometry (LC-MS) combined with pattern recognition to explore and characterize potential metabolites and metabolic pathway in an experimental model for CI-AKI. Seventeen differentiating metabolites in the serum were identified involving the pivotal metabolic pathways related to tryptophan metabolism, glycerophospholipid metabolism, steroid hormone biosynthesis, pyrimidine metabolism, sphingolipid metabolism, aminoacyl-tRNA biosynthesis. Our study provides novel insight into pathophysiologic mechanisms of AKI by changing biomarkers and pathways.
1. Introduction
The prevalence of acute kidney injury (AKI) is increasing in the world, and bringing about severe health problems for millions of people. Contrast-induced acute kidney injury (CI-AKI) is presently a leading cause of hospital-acquired renal insufficiency, which causes about 12% of all cases of AKI.1,2 It is an iatrogenic complication characterized by impairment of renal function and an increase in serum creatinine (SCr) concentration of patients after the administration of contrast medium during diagnostic and therapeutic procedures.3 However, the increased SCr levels presents at a relatively late stage of kidney injury, which lacks the sensitivity and specificity and remains challenging for early diagnosis.4,5 It is needed for identification of novel biomarkers applied to detect patients at risk for reducing the incidence of AKI and proven preventive interventions to enhance clinical efficacy.Metabolomics comes down to the comprehensive qualitative and quantitative analysis of the whole low molecular weight compounds in a biological system for forming a novel bridge between genotype and phenotype.6–9 The metabolome can be regarded as the magnifying glass of a biological system, because subtle changes induced by external stimuli and internal metabolic response in living systems lead to large alteration in metabolite level.10 Compared with any other “omics” such as genomics, transcriptions as well as proteomics, metabolomics is characterized by high level of sensitivity and the capacity to analysis relatively fewer metabolites for study by comparison to a large number of complicated corresponding genes or miRNA molecules in priority. By screening metabolic signatures in illness, we seek to offer disturbance of whole metabolic networks for characterizing pathological states and better understanding the biochemical effects of the drugs in clinical practice.
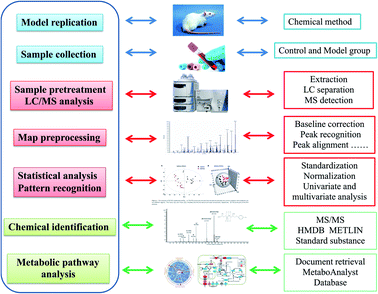
In this article, our aim is using LC-MS combined with pattern recognition to detect and investigate serum metabolic signatures in AKI rats caused by contrast media. Metabolic profiling is disposed by modern chemometrics and biostatistics methods such as PCA and PLS to reduce the dimension and information mining for revealing the momentary variation of pathophysiology and distinguishing morbidity from healthy status of a living body. Metabolic pathway analysis provides the annotation of biological alterations by potential biomarkers concentration fluctuation.
2. Materials and methods
2.1 Chemicals and reagents
Absolute methanol, formic acid (HPLC grade) was purchased from Thermo Fisher Scientific (Pittsburgh, PA, USA); absolute acetonitrile (HPLC grade) was purchased from Merck (Darmstadt, Germany); deionized water was acquired from Wahaha purified water company (Hangzhou, China). Leucine enkephalin was purchased from Sigma-Aldrich (St. Louis, MO, USA), which the purity is more than 99%. Omnipaque and furosemide were purchased from Harvest Pharmaceutical Co. (Shanghai, China). Isoflurane and physiologic saline solution were purchased Kermel Chemical Reagent Co., Ltd. (Tianjin, China). The assay kit for serum creatinine (SCr), blood urea nitrogen (BUN) were purchased from Weifang SanWei Biotechnology Institute (Beijing, China); the assay kit for cystatin C (Cys C) were purchased from Thermo Fisher Scientific (Waltham, MA, USA); the assay kit for tumor necrosis factor-α (TNF-α), interleukin-1β (IL-1β), interleukin-6 (IL-6) and interleukin-10 (IL-10) were acquired from the Blue Wave Biotechnology Research Institute, Fujian Sino-foreign joint venture (Fujian, China). The assay kit for maleicdialdehyde (MDA) and superoxide dismutase (SOD) were purchased from Sigma-Aldrich (Munich, Germany).The fluorescently-labeled antibody of CD8+-Percp and CD4+-PE were purchased from Becton Dickinson (New York, USA). All other reagents and chemicals in the process of the experiment were of analytical grade.
2.2 Animals handling
Male Sprague-Dawley rats, weighing approximately 200 ± 20 g, were purchased from the Vital River Laboratory Animal Technology Co., Ltd. (Beijing, China) in the study. All animals were provided in cages without pathogen-free. Under the condition of a 12 h diurnal cycles, the room appropriate temperature was regulated at 24 ± 2 °C with 50 ± 5% relative humidity. Animals possess unrestrained route to standard rodent pellet and water every day. Experiments stipulation must be strictly complied that animals and cages were homologous during the whole process for avoiding any external interference factors, in addition, all animal experiments operation conformed to the guidelines on animal care of Shanghai Jiaotong University School of Medicine. After acclimatizing in cages for 7 days, 28 rats were randomly assigned to a CIN-induced group and a control group with 14 rats in each. The CI-AKI model was reproduced by tail vein injection with omnipotence 10 mL kg−1 over 5 min after dehydration for 3 days and furosemide injection intramuscularly at 10 mL kg−1 for 20 min. Rats in the control group were injected with the same dose of saline at each processing time point. The experimental procedures were approved by the Animal Care and Ethics Committee at Mudanjiang Medical University and all experiments were performed in accordance to the declaration of Helsinki.2.3 Samples collection and preparation
After 24 h of model replication, two groups of rats were injected by 10% chloral hydrate (4 mL kg−1). Blood samples approximately 5 mL from aorta abdominous were delivered into Eppendorf tubes, and then centrifuged at 3500 rpm, 4 °C for 20 min. Serum samples were gained and divided into three sections for biochemical kits detection, flow cytometer detection metabolomics analysis. All serum samples were stored frozen at −80 °C until analysis. After heparin anticoagulant, 1.5 mL blood samples were diluted with normal saline to the separation liquid level of lymphocytes, and then collected lymphocytes in another centrifuge tube by pipetting after centrifugation. Through plus saline to 10 mL and centrifuged twice, removing the supernatant, the serum sample was respectively added CD8+-Percp and CD4+-PE fluorescent labeled antibody according to the requirements for quantitative detection by flow cytometry. For serum metabolomics analysis, the serum sample needs to be further processed. Serum mixed with a solvent mixture including 25% acetonitrile, 40% methanol and 35% water in proportion of 1 to 6 were incubated on ice for 15 min and vortexed for 1 min, then centrifuged at 13![[thin space (1/6-em)]](https://www.rsc.org/images/entities/char_2009.gif) 000 rpm, 4 °C for 20 min. The supernatant shifted into a clean tube was dried by nitrogen gas at 45 °C. The samples were centrifuged at 13
000 rpm, 4 °C for 20 min. The supernatant shifted into a clean tube was dried by nitrogen gas at 45 °C. The samples were centrifuged at 13![[thin space (1/6-em)]](https://www.rsc.org/images/entities/char_2009.gif) 000 rpm, 4 °C for 20 min after reconstituted by buffer including 50% isopropyl alcohol, 25% acetonitrile and 25% water and vortexed for 5 min at 25 °C. The obtained supernatant was injected for LC-MS analysis.11 After blood collection, the right kidney tissue was separated right away and soaked in 10% neutral solution of paraformaldehyde for hematoxylin and eosin (H&E) staining analysis.
000 rpm, 4 °C for 20 min after reconstituted by buffer including 50% isopropyl alcohol, 25% acetonitrile and 25% water and vortexed for 5 min at 25 °C. The obtained supernatant was injected for LC-MS analysis.11 After blood collection, the right kidney tissue was separated right away and soaked in 10% neutral solution of paraformaldehyde for hematoxylin and eosin (H&E) staining analysis.
2.4 Biochemical detection and histopathological examination
Clinical biochemistry analysis including SCr, BUN, Cys C, TNF-α, IL-1β, IL-4, IL-6, MDA and SOD were measured by the requirement of standard methods in kits, which were closely associated to renal function, inflammatory response, oxidation–reduction reactions. CD8+-Percp and CD4+-PE in the serum sample were quantitative detected according to the requirements for by flow cytometry. The renal tissue soaked in 10% neutral solution of paraformaldehyde and embedded by paraffin was firstly sliced approximately 5 μm tissue sections, and then dyed using hematoxylin and eosin. Image analysis between control and model group of tissue sections is observed by Image-Pro Plus 5.0 software (Media Cybernetics, Bethesda, MD, USA).2.5 Serum metabolic data analysis
3. Results
3.1 Biochemical detection and H&E staining analysis
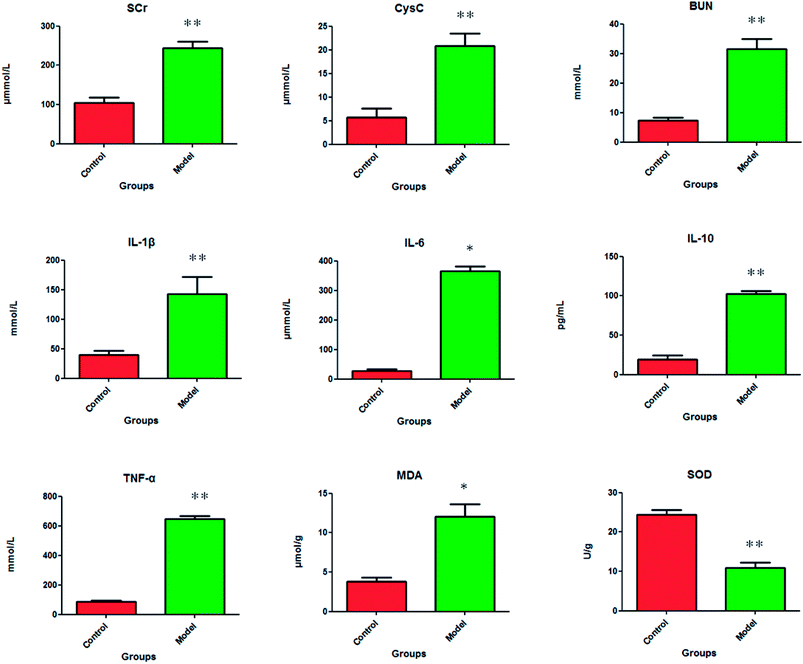
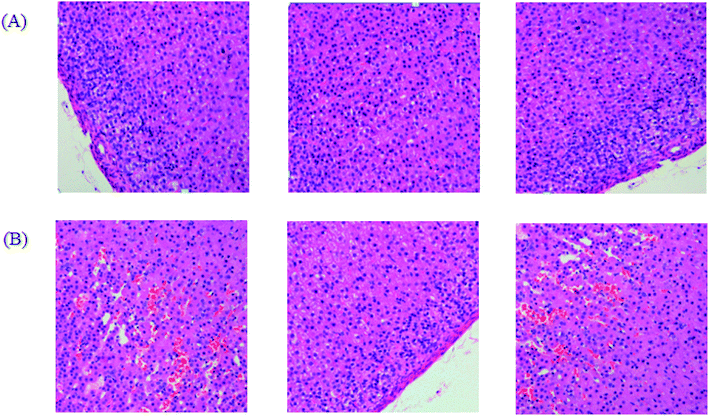
After dehydration for 3 days, furosemide injection 20 min and contrast medium administration, almost all rats in the model group present abnormal behavior such as slowness of movement, poor balance, drowsy and anorexia. To explore whether CI-AKI successfully reproduced, biochemistry parameters were measured between control and model group, which SCr, BUN, Cys C, TNF-α, IL-1β, IL-6, IL-10, MDA and SOD in the serum were widely used as diagnostic tool in clinic and their alteration were presented in Fig. 2. Some of the clinical parameters in the model groups were significantly changed compared with those in the control group. CI-AKI increases in serum SCr, BUN, Cys C, TNF-α, IL-1β, IL-6, IL-10, MDA activities and SCr, BUN, Cys C, TNF-α, IL-1β, IL-10 were more significant (P < 0.01), while SOD content in the serum were evidently reduced (P < 0.01) compared with control group. The biochemical results was indicated that the model group of rats in pathological state were related with renal damage, immune reaction, peroxidation and others. The ratio of CD4+/CD8+ is significantly lower at 24 h in model group of rats (P < 0.01) in comparison to control group (Fig. 3). As shown in Fig. 4, H&E examination of rats' kidney tissues are performed for further verification of disease severity. In model group, kidney tissues present abnormal structure, tubular dilatation, severe tubular atrophy, lipid droplets, cells swollen, severe inflammatory cell infiltration and kidney congestion. The biochemical observations were supplemented by metabolomic analysis.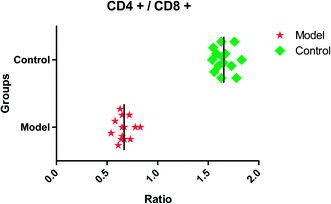 | ||
| Fig. 3 The ratio of CD4+/CD8+ in control and model group. CD4+/CD8+ in model group is significantly lower (P < 0.01) compared with control group. | ||
3.2 Pattern recognition analysis of metabolome
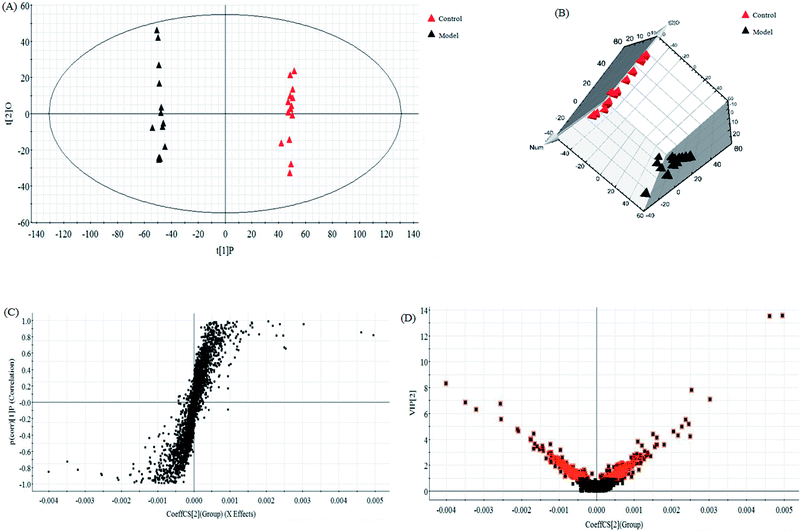
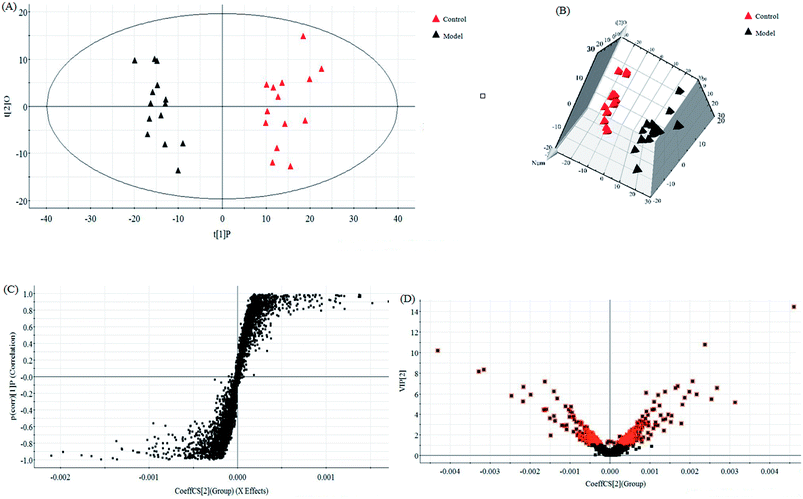
In this research, an untargeted approaches for metabolomics study involved in LC/MS method was used to explore the processes of all metabolites in diseased samples and uncover disease-related metabolic pathways. The total ion chromatograms showed the ideal separation in ESI+ and ESI− modes. Endogenous metabolites with low molecular mass could be separated well in 12 min by the optimized gradient elution procedure. Because of the complexity of the spectra, these complex data sets from control and model group were analyzed by multiple pattern recognition methods to better visualize the subtle similarities and differences. Typically, PCA scores plot present original data average weights, which the trajectory analysis in both ionization mode can really reflect a clear separation between the model and control groups. OPLS-DA score plots, as a more sophisticated supervised pattern recognition analysis, bring out an accurate calculation of discrepancy in different groups. OPLS-DA score plots (Fig. 5A and 6A) and 3D OPLS-DA score plots (Fig. 5B and 6B) exhibited obvious separation indicating that rats appear distinct biochemical alteration characteristics under the molding operation. S-Plot derived from OPLS-DA score plots identify typical metabolites in the organism using the covariance and correlation between metabolites and causative factors. The ions in the loading plot that more furthest away from the origin may be regarded as the differentiating endogenous metabolites (Fig. 5C and 6C). For further optimizing potential ions, VIP score of the OPLS-DA data (Fig. 5D and 6D) was performed to select distinct variables as potential biomarkers for distinguishing model rats from controls according to a threshold of VIP values (VIP > 1.0) and t-test (p < 0.05).3.3 Candidate metabolites identification and metabolic pathways analysis
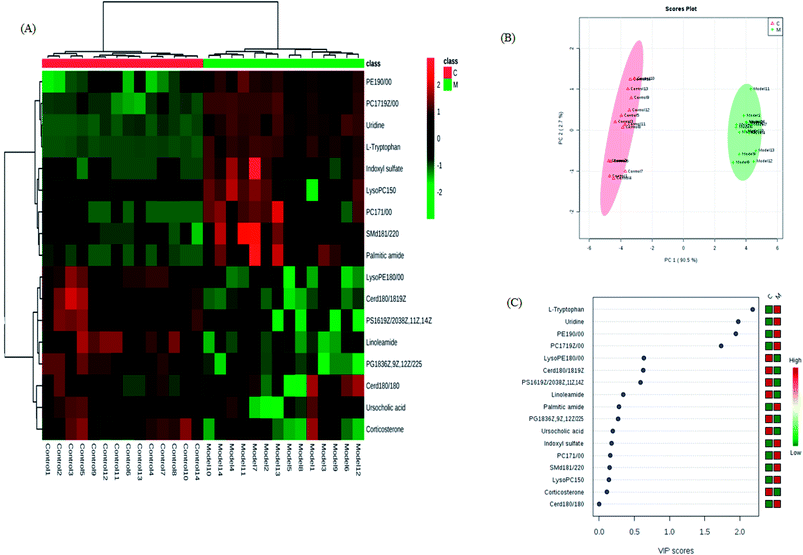
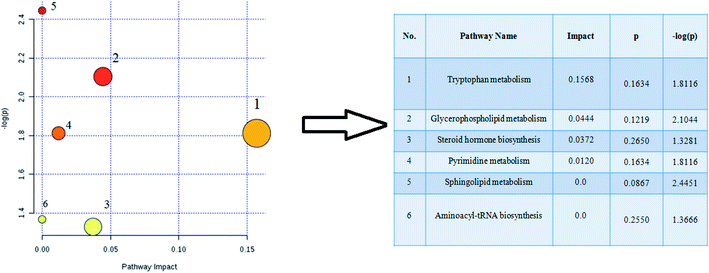
The retention time, the exact mass and the MS/MS data were provided using the LC-MS platform. By MS system, the precise molecular mass was ensured in a logical degree of measurement error, in addition, potential element composition, degree of unsaturation and fractional isotope abundance of the ingredients were also gained. Metabolite presumed molecular formula and was performed through accurate MS and MS/MS fragments couple with relevant databases, 17 endogenous metabolites were identified and summarized in Table 1, including PC(17:1(9Z)/0:0), PC(17:1/0:0), PE(19:0/0:0), LysoPE(18:0/0:0), PS(16:1(9Z)/20:3(8Z,11Z,14Z)), Cer(d18:0/18:0), SM(d18:1/22:0), ursocholic acid, indoxyl sulfate, uridine, linoleamide, LysoPC(15:0), corticosterone, L-tryptophan, Cer(d18:0/18:1(9Z)), PG(18:3(6Z, 9Z, 12Z)/22:5(4Z,7Z,10Z,13Z,16Z)) and palmitic amide. 9 of the 17 biomarkers were up-regulated and 8 of them were down-regulated in the model group in hierarchical clustering heat map of the 17 differential metabolites by Pearson's linear correlation analysis (Fig. 7A). The corresponding targeted PCA showed clear separation of the two groups (Fig. 7B). As shown in Fig. 7C, the cluster diagram disclosed that the two groups have chance to be detached by 4 metabolites with VIP scores >1.0. MetaboAnalyst 3.0 software is a powerful tool on the basis of the high-quality KEGG metabolic pathways to further understand the most relevant pathways, which potential biomarkers are mainly involved in tryptophan metabolism, glycerophospholipid metabolism, steroid hormone biosynthesis, pyrimidine metabolism, sphingolipid metabolism and aminoacyl-tRNA biosynthesis. The results suggested that these target pathways showed the marked disturbations od CI-AKI and were relevant to development of disease (Fig. 8).| No. | rt (min) | Ion form | m/z | Proposed compound | Formula | Trend in model |
|---|---|---|---|---|---|---|
| 1 | 7.91 | M − H | 506.32 | PC(17:1(9Z)/0:0) | C25H50NO7P | ↑ |
| 2 | 6.09 | M + H | 507.33 | PC(17:1/0:0) | C25H50NO7P | ↑ |
| 3 | 5.74 | M + H | 495.33 | PE(19:0/0:0) | C24H50NO7P | ↑ |
| 4 | 10.68 | M − H | 480.31 | LysoPE(18:0/0:0) | C23H48NO7P | ↓ |
| 5 | 1.62 | M + H | 784.51 | PS(16:1(9Z)/20:3(8Z,11Z,14Z)) | C42H74NO10P | ↓ |
| 6 | 5.10 | M − H | 566.55 | Cer(d18:0/18:0) | C36H73NO3 | ↓ |
| 7 | 2.78 | M − H | 785.65 | SM(d18:1/22:0) | C45H91N2O6P | ↑ |
| 8 | 7.72 | M − H | 453.28 | Ursocholic acid | C24H40O5 | ↓ |
| 9 | 3.03 | M − H | 212.00 | Indoxyl sulfate | C8H7NO4S | ↑ |
| 10 | 1.53 | M − H | 243.06 | Uridine | C9H12N2O6 | ↑ |
| 11 | 9.11 | M + H | 280.26 | Linoleamide | C18H33NO | ↓ |
| 12 | 10.06 | M + H | 482.32 | LysoPC(15:0) | C23H48NO7P | ↑ |
| 13 | 2.56 | M + H | 347.22 | Corticosterone | C21H30O4 | ↓ |
| 14 | 2.39 | M + H | 205.09 | L-Tryptophan | C11H12N2O2 | ↑ |
| 15 | 3.89 | M − H | 564.53 | Cer(d18:0/18:1(9Z)) | C36H71NO3 | ↓ |
| 16 | 2.05 | M + H | 819.51 | PG(18:3(6Z,9Z,12Z)/22:5(4Z,7Z,10Z,13Z,16Z)) | C46H75O10P | ↓ |
| 17 | 8.52 | M + H | 256.26 | Palmitic amide | C16H33NO | ↑ |
4. Discussion
A suitable animal model will better understand the pathogenesis of CI-AKI and contribute to design novel treatment options for accelerating patient recovery. It is not easy to induce AKI that healthy animals given contrast medium simply. Pretreatment of experimental animals with risk factors associated with kidney injury in humans can help induce AKI in animal model.12 Rats are widely used for CI-AKI model replication, and various factors such as nephrectomy, salt depletion, dehydration, furosemide or indometacin injection have been applied for the preparation of rat models.13–16 Dehydration is considered as a simple and quick way of pretreatment because it is easy to prepare without medication or surgery. Some clinical studies have reported that low-osmolar contrast medium can significantly reduce the frequency of renal damage in patients compared to high-osmolar contrast medium. Therefore, we firstly carry out dehydration and diuretics to rats in the model group, and then give hypotonic contrast agent to rats for preparing animal models. From biochemical parameters and renal tissue examination, we found that changes observed is comparable to the human CI-AKI.Kidney damage causes acid base and electrolyte disorders in the body to induce or aggravate damage to other organs. In this experiment, the levels of TNF-α, IL-1 and IL-6 in the serum were increased, which indicate that the early pro-inflammatory cytokines were out of control and led to tissue damage. As a kind of effective anti-inflammatory cytokine, IL-10 began to rise after molding that may help inhibit the production of proinflammatory cytokines and protect the organism. Oxidative stress is the main cause of mitochondrial damage, which endotoxin accumulation of free radicals in the body lead to loss antioxidant enzymes and antioxidant depletion due to serum up-regulated MDA content and down-regulated SOD content in the serum.17 Serum SCr, BUN, Cys C level increased that renal dysfunction have appeared in model rats.18 In recent years, CD4+/CD8+ ratio in serum used to measure the body immunity is more effective than the traditional laboratory tests and scoring to detect. It is one of the most commonly used indicators of immune function in clinical practice. Under normal conditions, the number of T-lymphocytes and their subbands is in a dynamic equilibrium. The ratio of CD4+/CD8+ is lower than the normal one due to the increase of CD8+. The results of this study show that CI-AKI show significant cellular immune dysfunction. Using the database for pathway analysis, we identified several biologically relevant metabolic pathways that changed in this disease. CI-AKI related metabolites are closely associated with tryptophan metabolism, glycerophospholipid metabolism, steroid hormone biosynthesis and pyrimidine metabolism.19 Glycerophospholipid metabolism is concerned with the recognition and signals transduction of proteins in cell membranes.20 The level of LysoPC(15:0) is up-regulated in glycerophospholipid metabolism which indicate abnormal the kidneys function. Steroid hormone biosynthesis disorder that regulate water and salt metabolism and sugar metabolism in animal induce down-regulated corticosterone level in CI-AKI rats serum.21 Uridine, a pyrimidine nucleoside that is essential for cellular function and survival, is necessary for DNA and RNA synthesis, glycogen accumulation, glycosylation of proteins and lipids, extracellular lipid synthesis, and detoxification of heterologous substances. When the body adopts the above modeling method to induce kidney injury, the liver cells are mainly used for the production of glucose. Adipocytes take responsibility for supplying uridine to the blood, which raises the level of uridine in the serum.22 These biochemical changes help to understand the key features of CI-AKI. In addition, these metabolic features provide useful clues for exploring mechanisms and identifying targets for treatment of CI-AKI.
Precision medicine and clinical study are two major areas in future research of metabolomics.23–28 Precision medicine provides health implementation and tailor-made clinical decision to patients based on intrinsic biological information and clinical symptoms.29–32 Clinical metabolomics allows companies to find disease-related biomarkers and identify complex metabolic interactions for patients. By identifying, quantifying and describing all the metabolites of the system, metabolomics can provide unique insights into biology and enhance the discovery of biomarkers. Measuring metabolites level is crucial to decode biology due to almost all phenotypic factors changing metabolite levels. More and more laboratories have been capable of metabolite analysis up to now, however, comprehensive analysis techniques are extremely rare which few laboratories achieve accurate and unbiased metabolite identification in metabonomics. Interpreting the large amount of data still remains a challenge that is not impossible for most people but quite slow.25 In the future, we will devote ourselves to identifying unknown metabolites, developing a standard dataset for inquiry such as genomic resources of GenBank and integrating with data from other entire-system.26
5. Conclusion
Emerging high-throughput metabolomics technologies have been widely used for seeking candidate biomarkers for various disease and contributing to reveal the mechanism of illness on the metabolic level. Here, we systematically investigate how serum metabolomics can produce novel mechanistic insights, identify potential biomarkers from metabolome datasets and reveal interpretation of the perturbed metabolic pathway in CI-AKI. Seventeen differentiating metabolites and six distinct pathways such as tryptophan metabolism, glycerophospholipid metabolism, steroid hormone biosynthesis as well as pyrimidine metabolism were found related with CI-AKI according to ingenuity pathway analysis. It is suggested that the metabolomics approach could provide a very promising way to help biomarker identification of AKI. Through the study of continuous, dynamic, and noninvasive detection of metabolites in serum, they will enhance our understanding of the pathophysiological processes and guide us to identify potential biomarkers to develop new therapeutic strategies. The altered metabolites might be deemed as potential biomarkers in clinical practice if replied in larger studies at a population level in the future.Conflicts of interest
There are no conflicts to declare.References
- P. A. McCullough, Contrast-induced acute kidney injury, J. Am. Coll. Cardiol., 2008, 51, 1419–1428 CrossRef PubMed.
- T. Zhang, L. H. Shen and L. H. Hu, et al., Statins for the prevention of contrast-induced nephropathy: a systematic review and meta-analysis, Am. J. Nephrol., 2011, 33, 344–351 CrossRef CAS PubMed.
- J. Golshahi, H. Nasri and M. Gharipour, Contrast-induced nephropathy: A literature review, J Nephropathol, 2014, 3(2), 51–56 Search PubMed.
- N. M. Mohammed, A. Mahfouz and K. Achkar, et al., Contrast-induced nephropathy, Heart Views, 2013, 14(3), 106–116 CrossRef PubMed.
- A. L. Jorgensen, Contrast-induced nephropathy: pathophysiology and preventive strategies, Crit Care Nurse, 2013, 33(1), 37–46 CrossRef PubMed.
- A. Zhang, Q. Liu and H. Zhao, et al., Phenotypic characterization of nanshi oral liquid alters metabolic signatures during disease prevention, Sci. Rep., 2016, 6, 19333 CrossRef CAS PubMed.
- A. Zhang, H. Sun and S. Qiu, et al., NMR-based metabolomics coupled with pattern recognition methods in biomarker discovery and disease diagnosis, Magn. Reson. Chem., 2013, 51(9), 549–556 CrossRef CAS PubMed.
- A. Zhang, H. Sun and P. Wang, et al., Metabonomics for discovering biomarkers of hepatotoxicity and nephrotoxicity, Pharmazie, 2012, 67(2), 99–105 CAS.
- A. Zhang, H. Sun and G. Yan, et al., Metabolomics for Biomarker Discovery: Moving to the Clinic, BioMed Res. Int., 2015, 2015, 354671 Search PubMed.
- H. Chu, A. Zhang and Y. Han, et al., Metabolomics approach to explore the effects of Kai-Xin-San on Alzheimer's disease using UPLC/ESI-Q-TOF mass spectrometry, J. Chromatogr. B: Anal. Technol. Biomed. Life Sci., 2016, 1015, 50–61 CrossRef PubMed.
- M. Mapstone, A. K. Cheema and M. S. Fiandaca, et al., Plasma phospholipids identify antecedent memory impairment in older adults, Nat. Med., 2014, 20(4), 415–418 CrossRef CAS PubMed.
- J. M. Idee and B. Bonnemain, Reliability of experimental models of iodinated contrast media-induced acute renal failure. From methodological considerations to pathophysiology, Invest. Radiol., 1996, 31, 230–241 CrossRef CAS PubMed.
- O. Toprak, M. Cirit and M. Tanrisev, et al., Preventive effect of nebivolol on contrast-induced nephropathy in rats, Nephrol., Dial., Transplant., 2008, 23, 853–859 CrossRef CAS PubMed.
- S. K. Kang, W. C. Huang and S. Wong, et al., Dynamic contrast-enhanced magnetic resonance imaging measurement of renal function in patients undergoing partial nephrectomy: preliminary experience, Invest. Radiol., 2013, 48(10), 687–692 CrossRef PubMed.
- F. Vanommeslaeghe, E. De Mulder and C. Van de Bruaene, et al., Selecting a strategy for prevention of contrast-induced nephropathy in clinical practice: an evaluation of different clinical practice guidelines using the AGREE tool, Nephrol., Dial., Transplant., 2015, 30(8), 1300–1306 CrossRef CAS PubMed.
- B. Jin, B. W. Wu and J. J. Zhang, et al., Preventive effect of reduced glutathione on contrast-induced nephropathy in elderly patients undergoing coronary angiography or intervention: a randomized, controlled trial, Braz. J. Med. Biol. Res., 2015, 48(9), 839–842 CrossRef CAS PubMed.
- H. Ma, J. Kou and D. Zhu, et al., Liu-Shen-Wan, a traditional Chinese medicine, improves survival in sepsis induced by cecal ligation and puncture via reducing TNF-alpha levels, MDA content and enhancing macrophage phagocytosis, Int. Immunopharmacol., 2006, 6(8), 1355–1362 CrossRef CAS PubMed.
- T. Johannes, E. G. Mik and C. Ince, Nonresuscitated endotoxemia induces microcirculatory hypoxic areas in the renal cortex in the rat, Shock, 2009, 31, 97–103 CrossRef PubMed.
- M. Sallée, L. Dou and C. Cerini, et al., The aryl hydrocarbon receptor-activating effect of uremic toxins from tryptophan metabolism: a new concept to understand cardiovascular complications of chronic kidney disease, Toxins, 2014, 6(3), 934–949 CrossRef PubMed.
- S. Kim, H. S. Cheon and J. C. Song, et al., Aging-related Changes in Mouse Serum Glycerophospholipid Profiles, Osong Public Health Res Perspect, 2014, 5(6), 345–350 CrossRef PubMed.
- Y. Shu, C. L. Bello and L. M. Mangravite, et al., Functional characteristics and steroid hormone-mediated regulation of an organic cation transporter in Madin-Darby canine kidney cells, J. Pharmacol. Exp. Ther., 2001, 299(1), 392–398 CAS.
- M. Tölle, M. Schuchardt and A. Wiedon, et al., Differential effects of uridine adenosine tetraphosphate on purinoceptors in the rat isolated perfused kidney, Br. J. Pharmacol., 2010, 161(3), 530–540 CrossRef PubMed.
- X. Wang, A. Zhang and G. Yan, et al., Metabolomics and proteomics annotate therapeutic properties of geniposide: targeting and regulating multiple perturbed pathways, PLoS One, 2013, 8(8), e71403 CAS.
- X. Wang, A. Zhang and H. Sun, et al., Systems biology technologies enable personalized traditional Chinese medicine: a systematic review, Am. J. Chin. Med., 2012, 40(06), 1109–1122 CrossRef PubMed.
- A. Zhang, H. Sun and X. Wang, Urinary metabolic profiling of rat models revealed protective function of scoparone against alcohol induced hepatotoxicity, Sci. Rep., 2014, 4, 6768 CrossRef PubMed.
- Q. Liang, H. Liu and H. Xing, et al., High-resolution mass spectrometry for exploring metabolic signatures of sepsis-induced acute kidney injury, RSC Adv., 2016, 6, 29863–29868 RSC.
- Q. Liang, H. Liu and H. Xing, et al., UPLC-QTOF/MS based metabolomics reveals metabolic alterations associated with severe sepsis, RSC Adv., 2016, 6, 43293–43298 RSC.
- A. Zhang, H. Fang and Y. Wang, et al., Discovery and verification of the potential targets from bioactive molecules by network pharmacology-based target prediction combined with high-throughput metabolomics, RSC Adv., 2017, 7, 51069–51078 RSC.
- A. Zhang, H. Sun and H. Xu, et al., Cell metabolomics, OMICS: J. Integr. Biol., 2013, 17(10), 495–501 CrossRef CAS PubMed.
- X. Wang, J. Li and A. H. Zhang, Urine metabolic phenotypes analysis of extrahepatic cholangiocarcinoma disease using ultra-high performance liquid chromatography-mass spectrometry, RSC Adv., 2016, 6(67), 63049–63057 RSC.
- Y. Li, S. Qiu and A. Zhang, High-throughput metabolomics to identify metabolites serve as diagnostic biomarkers of prostate cancer, Anal. Methods, 2016, 8, 3284–3290 RSC.
- A. Zhang, X. Zhou and H. Zhao, et al., Rapidly improved determination of metabolites from biological data sets using the high-efficient TransOmics tool, Mol. BioSyst., 2014, 10(8), 2160–2165 RSC.
Footnote |
| † These authors contributed equally to this work. |
| This journal is © The Royal Society of Chemistry 2018 |

