 Open Access Article
Creative Commons Attribution 3.0 Unported Licence
Fiber optic magnetic field sensor using Co doped ZnO nanorods as cladding
S. Narasimmana,
L. Balakrishnan *b and
Z. C. Alex*a
aSchool of Electronics Engineering, VIT, Vellore 632 014, India. E-mail: zcalex@gmail.com
bDepartment of Physics, Government College of Technology, Coimbatore 641 013, India. E-mail: bslv85@gmail.com; Tel: +91-9944881875
First published on 18th May 2018
Abstract
A fiber optic magnetic field sensor is proposed and experimentally demonstrated. Pristine and Co doped ZnO nanorods of different Co concentrations (5, 10, 15 and 20 at%) were synthesized using a hydrothermal method. The synthesized nanorods were subjected to various characterization methods like X-ray diffraction (XRD), optical absorption, scanning electron microscopy, energy dispersive X-ray spectroscopy, Fourier transform infrared spectroscopy, vibrating sample magnetometry and X-ray photoelectron spectroscopy (XPS). XRD and XPS analysis confirms that the Co ions were successfully incorporated into the Zn site of the wurtzite ZnO lattice without altering the structure. The pristine and Co doped ZnO nanorods showed remarkable changes in the M–H loop where the diamagnetic behavior of ZnO changes to paramagnetic when doped with Co. The sensor structure is composed of cladding modified fiber coated with Co doped ZnO nanorods as a sensing material. The modified cladding is proportionally sensitive to the ambient magnetic field because of the magneto-optic effect. Experimental results revealed that the sensor has an operating magnetic field range from 17 mT to 180 mT and shows a maximum sensitivity of ∼18% for 15 at% Co doped ZnO nanorods. The proposed magnetic field sensor would be attractive due to its low cost fabrication, simplicity of the sensor head preparation, high sensitivity and reproducibility.
1. Introduction
Nanostructured metal oxides have acquired a significant role in the scientific world due to their efficient technological applications in the field of solar cells, optoelectronic devices, gas sensors and spintronics.1–5 ZnO is a unique wide band gap (3.37 eV) semiconductor with a large exciton binding energy (60 meV) and good chemical stability.6 The inception of impurities into the ZnO host is an efficient way to produce novel properties in ZnO. Diluting non-magnetic ZnO with transition metal dopants such as Mn2+, Co2+, Ni2+ and Fe2+ could deliver different magnetic properties. This new genre of semiconductor is entitled as dilute magnetic semiconductors.7,8In the last few decades, many researchers have curiously investigated the impact of doping ZnO nanostructures with TM ions. Among the various TM ions, Co has its own importance in that (i) it is more reconcilable with Zn while doping, (ii) it can amend the morphology and optical properties of ZnO nanostructures, (iii) easily soluble in ZnO nanostructures, (iv) it has a strong magnetic moment (μCo = 1.8 μB) compared with other transition metals and (v) the ionic radius of Zn2+ (0.60 Å) is nearly same as Co2+ (0.58 Å).9 Many research groups have synthesized Co doped ZnO nanostructures and assessed their performance on doping. For instance, Sharma et al. have synthesized Co![[thin space (1/6-em)]](https://www.rsc.org/images/entities/char_2009.gif) :
:![[thin space (1/6-em)]](https://www.rsc.org/images/entities/char_2009.gif) ZnO nanoparticles using a co-precipitation method and showed their ferromagnetism at room temperature.10 Xu et al. have synthesized Co doped ZnO nanoflakes using a hydrothermal method and noticed their ferromagnetism at room temperature. However, with increasing Co2+ dopant concentration, paramagnetism was exhibited.11 Qiu et al. have also reported room temperature ferromagnetism (RTFM) in Co
ZnO nanoparticles using a co-precipitation method and showed their ferromagnetism at room temperature.10 Xu et al. have synthesized Co doped ZnO nanoflakes using a hydrothermal method and noticed their ferromagnetism at room temperature. However, with increasing Co2+ dopant concentration, paramagnetism was exhibited.11 Qiu et al. have also reported room temperature ferromagnetism (RTFM) in Co![[thin space (1/6-em)]](https://www.rsc.org/images/entities/char_2009.gif) :
:![[thin space (1/6-em)]](https://www.rsc.org/images/entities/char_2009.gif) ZnO by water-bubble template process.12
ZnO by water-bubble template process.12
In the past few years, several techniques have been ratified to synthesize pristine ZnO and TM doped ZnO nanostructures including co-precipitation,13 hydrothermal,14 sol–gel,15 magnetron sputtering,16 ball milling,17 etc. Of these, the hydrothermal method offers various nanostructure morphologies, controlled particle size, high reaction rate, different phase formation, etc.18 To explore the potential of nanoparticles in the field of magnetic field sensing, various types of sensor such as thin films,19 fiber optics,20 Hall effect based magnetic field sensors and magnetic switches have been fabricated. Though, fiber optic based magnetic sensors offer numerous advantages such as small size, on-line analysis, remote sensing, high sensitivity, immunity to electromagnetic interference and a capability of working in harsh environments.21 In fiber optic sensor, the principle of sensing is based on cladding modification technology, in which the middle part of the cladding was replaced with a magnetic sensing material. The magnetic field sensing material causes the magneto-optic effect such as change in refractive index as a result of an applied external magnetic field.
Hitherto, various kinds of fiber optic based magnetic sensor have been proposed using magnetic fluid (MF) as the cladding with different optical devices such as Fiber Bragg Grating (FBG),22 Long Period Fiber Bragg Grating (LPFG),23 single-mode–multi-mode–single-mode (SMS) structures,24 multi-mode–single-mode–multi-mode (MSM) structures,25 micro resonators,26 and Fabry–Pérot devices.27 However, minor shortcomings like the feeble response of MF to external magnetic fields, low interaction between core mode/lower order cladding mode and MF, structure instability and complicated technology mean that they fail to achieve higher magnetic sensitivity.
To overcome these shortcomings, a fiber optic magnetic field sensor based on Co doped ZnO nanorods is proposed and demonstrated. The impact of doping concentration on structural, optical and magnetic properties is also investigated.
2. Materials and methods
2.1. Synthesis of pristine and Co doped ZnO nanorods
Pristine ZnO and Zn1−xCoxO (x = 5, 10, 15 and 20 at%) were synthesized using a hydrothermal method. All the chemicals used in this work were analytical reagent grade and used as received without further purification. Zinc acetate dihydrate (Zn(CH3COO)2·2H2O, 99.99%, Sigma-Aldrich) and cobalt(II) chloride, (99.99%, Sigma-Aldrich) in suitable weight percentages were used as starting materials. Additionally, sodium hydroxide (NaOH, 99.99%, Alfa Aesar) was used as the precipitating agent and cetyl trimethyl ammonium bromide (CTAB) (C19H42BrN) was used as a surfactant.For the synthesis of pristine ZnO nanorods, 50 ml of 0.2 M zinc acetate dihydrate, 50 ml of 0.1 M CTAB and 100 ml of 2 M NaOH aqueous solution were prepared. Initially, zinc acetate dihydrate solution was stirred continuously for 3 h and aqueous NaOH solution was added dropwise to the mixture until the pH value of solution reaches 8.0. Later, the white precipitated solution was stirred for 1 h. Finally, CTAB solution was added into the mixture and stirred vigorously for another 30 min. Then, the final solution was transferred into a 100 ml teflon-lined autoclave and maintained at 170 °C for 72 h. After the reaction was completed, the resultant product was washed several times with distilled water and ethanol alternatively, and dried at 60 °C overnight.
For the synthesis of Zn1−xCoxO (x = 5, 10, 15 and 20 at%) nanorods, the calculated amount of cobalt(II) chloride and zinc acetate dihydrate were dissolved in 50 ml of distilled water and stirred for 3 h. Then, aqueous NaOH solution was added drop wise into the above mixture to form a white precipitate with a slight pale pink colour. After that the same procedure that was adopted for the synthesis of pristine ZnO nanorods was followed for the synthesis of Co doped ZnO nanorods.
2.2. Sensor head preparation and setup
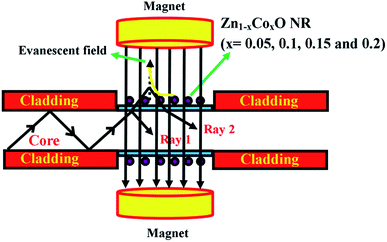
Fig. 1(a) shows the schematic diagram of the proposed magnetic field sensor structure. A multi-mode plastic optical fiber of about 42 cm length with 1000 μm diameter and 0.51 numerical aperture was used as a sensor head. A cladding region of about 3 cm in length was mechanically removed at the center portion of the fiber using a chemical etching process followed by fine polishing. The ablated cladding region was chemically etched using acetone followed by polishing with a 1000 grid sheet. Then, the polished surface was cleaned and coated with Co (at% of 5, 10, 15 and 20) doped ZnO nanorods using a dip coating method.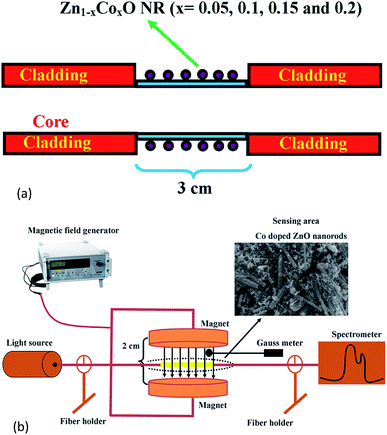 | ||
| Fig. 1 (a) Schematic diagram of the proposed magnetic field sensing structure. (b) Experimental setup for the magnetic field sensor. | ||
The scheme of the experimental setup used for measuring the magnetic field sensing characteristics of the fabricated sensor is shown in Fig. 1(b). In the sensor setup, a broadband light source (halogen lamp-SLS201/M) with the wavelength ranging from 300 to 2600 nm is coupled at one end of the fiber and the intensity spectrum was recorded with a fiber optic spectrometer (CCS200/M) having a spectral range of 200 to 1000 nm at the other end of the fiber. The sensor head was inserted between the two poles of an electromagnet which generates a static magnetic field around the sensing head. The experiment was conducted at ambient temperature (28 °C).
3. Results and discussion
3.1. Structural analysis
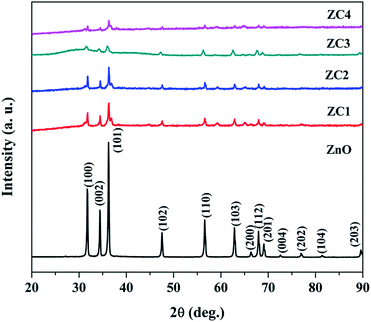
5, 10, 15 and 20 at% Co doped ZnO nanorods are represented as ZC1, ZC2, ZC3 and ZC4 respectively.XRD patterns of pristine ZnO and Zn1−xCoxO (x = 0.05, 0.1, 0.15 and 0.2) nanorods are shown in Fig. 2. All the diffraction peaks from the XRD patterns clearly manifest that the Zn1−xCoxO nanorods addresses the hexagonal wurtzite structure and are very well matched with standard JCPDS card no: 36-1451. No other secondary phases of Co clusters were found. The non-existence of impurity peaks reveal that Co ions were successfully incorporated into the ZnO lattice. The decrease in diffraction peak intensity is due to an increase in the concentration of impurities.28 The average crystallite size and strain of the nanorods are calculated from the Williamson and Hall (W–H) plot.29
The average crystallite size and strain of the nanoparticles are shown in Table 1. It was found that due to the incorporation of impurities, the crystallite size decreases.
| Sample | Crystallite size (D) (nm) | Microstrain (ε) |
|---|---|---|
| ZnO | 65 | 0.00070 |
| ZC1 | 63 | 0.00073 |
| ZC2 | 57 | 0.00076 |
| ZC3 | 53 | 0.00082 |
| ZC4 | 49 | 0.00085 |
3.2. Morphological and elemental analysis
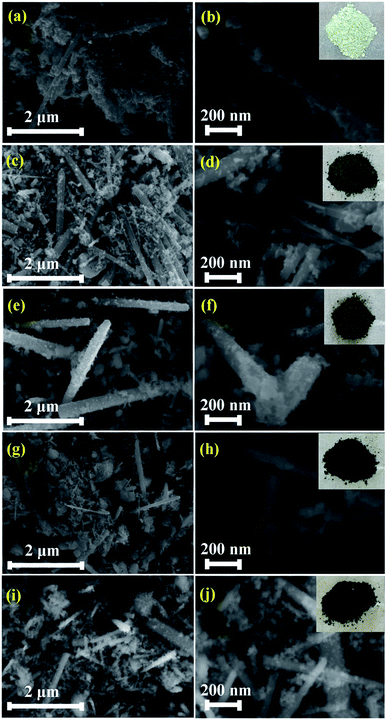
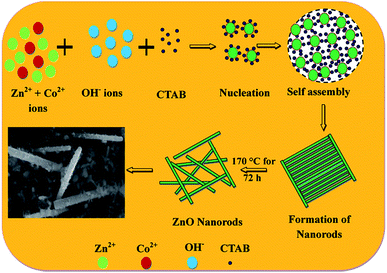
Fig. 3(a–j) shows the morphologies of pristine and Zn1−xCoxO nanoparticles at different magnifications. It is seen that the synthesized nanopowder shows a rod like morphology. In order to analyse the complete morphology information of the ZnO nanorods, a plausible formation mechanism for the ZnO nanorods was proposed, as schematically illustrated in Fig. 4.The formation mechanism of Co doped ZnO nanorods can be invoked via the following chemical reactions:
Decomposition of Zn(Ac)2:
| Zn(CH3COO)2·2H2O + 2NaOH → Zn(OH)2 + 2CH3COONa + 2H2O | (1) |
Production of pristine ZnO nanoparticles:
| Zn(OH)2 ↔ Zn2+ + 2OH− | (2) |
| Zn(OH)2 + 2OH− → [Zn(OH)42−] | (3) |
| [Zn(OH)42−] → ZnO + OH− + H2O | (4) |
Decomposition of CoCl2:
| CoCl2 + 2NaOH → Co(OH)2 + 2NaCl | (5) |
| Co(OH)2 ↔ Co2+ + 2OH− | (6) |
Production of Co doped ZnO nanoparticles:
| Zn1−x(OH)2 + Cox(OH)2 → Zn1−xCoxO + H2O | (7) |
Reaction (1) and (5) shows the decomposition of Zn(Ac)2 and CoCl2 in an ambient environment producing Zn(OH)2 and Co(OH)2, respectively. If the pH value in aqueous solution is about 11, where Zn(OH)2 is the main chemical compound, during the hydrothermal method, a part of the Zn(OH)2 colloid species dissolves into Zn2+ and OH− according to reaction (2). When the concentration of Zn2+ and OH− reaches the super saturation degree of ZnO, then ZnO nuclei will form according to reaction (3) and (4). Reaction (6) indicates the dissolution of Co(OH)2 in water to produce Co2+ ions that will be incorporated into the ZnO lattice. Reaction (7) is the final step of the growth process to accomplish Co doped ZnO nanoparticles.30 To obtain the consistent nanoparticle size, the headway approach to synthesize Co doped ZnO nanoparticles using a hydrothermal method is closely related to a new understanding of the formation mechanism by the introduction of the surfactant CTAB. CTAB is a cationic surfactant having small hydrophilic head and a hydrophobic tail. The element Zn was obtained in [Zn(OH)4]2− as a negatively charged tetrahedrons that were formed according to reaction (3), whereas CTA+ was positively charged with a tetrahedral head. At a higher reaction temperature (∼170 °C), the cationic charge of CTA+ and anionic charge of [Zn(OH)4]2− were formed primarily by electrostatic interactions (reaction (4)). The CTAB could accelerate the ionization of [Zn(OH)4]2− as it is a strong acid–weak-base salt.31 It was assumed that the CTAB was aggregated in between the ZnO crystallites during hydrothermal crystallization and after washing thrice with ethanol, the rod like structure of ZnO was formed.
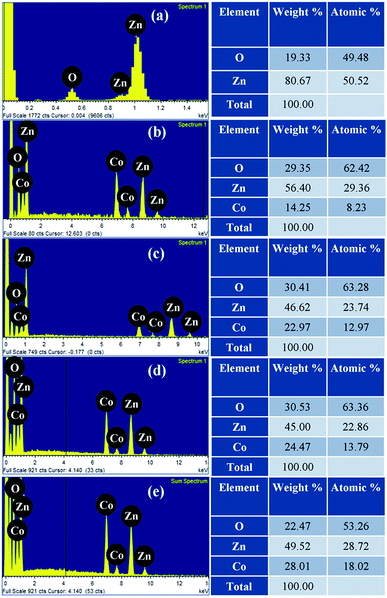
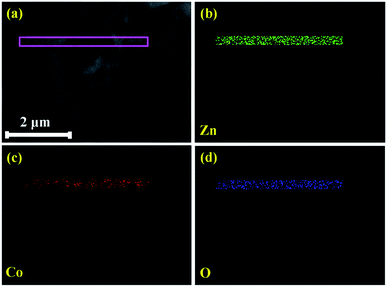
The elemental composition of pristine and Zn1−xCoxO nanorods were investigated using EDS spectra and shown in Fig. 5(a–e). The spectra affirm the presence of Zn and O in ZnO, likewise, Zn, O and Co in Co doped ZnO nanorods. Fig. 6 shows the elemental mapping of Zn, O and Co on a single Co doped ZnO nanorod. The mapping results indicated that Zn, O and Co atoms are uniformly distributed on the single nanorod.
3.3. FTIR analysis
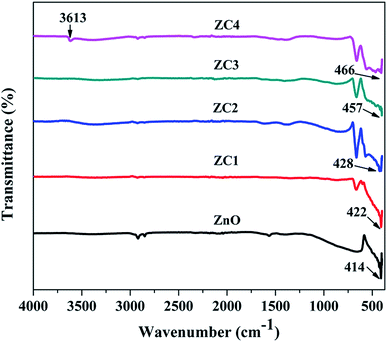
Fig. 7 shows the vibrational frequencies of pristine and Co doped ZnO nanorods. The peak obtained between 3420–3650 cm−1 corresponds to the stretching vibration of O–H.32 The stretching vibrations of Zn–O are observed at 414, 422, 428, 457 and 466 cm−1 for pristine and Co doped ZnO nanorods.33Upon Co doping, the IR peak shifts consistently from 414 cm−1 to 466 cm−1 and this shift is attributed to the incorporation of Co2+ ions in the ZnO lattice.34
3.4. Optical absorption studies
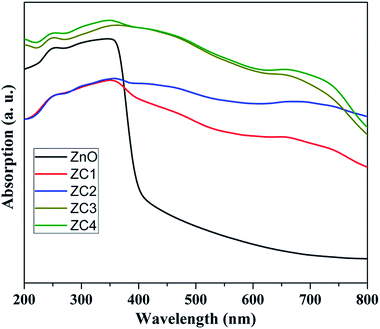
Fig. 8 shows the optical absorption spectra of pristine and Co doped ZnO nanorods recorded in DRS mode. The absorption edge of the Co doped ZnO depicts significant red shift compared with pristine ZnO. It is attributed that the Co doped ZnO nanorods showed absorption from UV to visible region due to the d–d transitions.35 This affirms the incorporation of Co2+ ions into the ZnO lattice, rather than forming as cobalt oxide (CoO) or Co metal.3.5. VSM analysis
Fig. 9 shows magnetization versus magnetic field (M–H) measurements with maximum applied field ±10 kOe at room temperature (300 K). All the Co doped ZnO nanorods revealed paramagnetic behaviour excluding pristine ZnO (diamagnetic behaviour). The diamagnetic behaviour of pristine ZnO is ascribed to the presence of paired electrons in its d orbital. The 5% and 10% Co doped ZnO nanorods (ZC1 and ZC2) deduces weak ferromagnetism (Fig. 9(b)). It is suggested that a few of the doped Co2+ cations occupy the next nearest lattice sites. The nearest Co–Co pairs couple in an antiferromagnetic way and suppress the magnetization.36–39 Thus, weak ferromagnetism was observed in the ZC1 and ZC2 samples. When the level of Co doping increases to 20%, the sample demonstrates linear magnetization curves with the absence of a hysteresis loop within the applied field (ZC3 and ZC4), which can be concluded as good paramagnetism. As Co dopant concentration increases, more and more nearest Co–Co pairs exhibit larger antiferromagnetic interactions, which leads to the vanishing of hysteresis in the ZC3 and ZC4 samples. This implies that higher Co doping concentrations in ZnO lead to paramagnetism.40 Similar paramagnetic behaviour with the same composition has been reported by many research groups.41–45 However, for higher magnetizing fields the magnetization is found to increase with increasing Co concentration (Fig. 9(c)).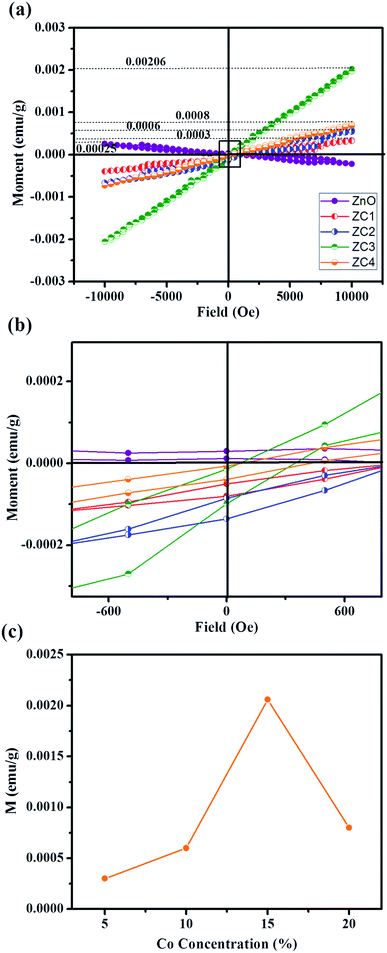 | ||
| Fig. 9 (a) Magnetic field dependent magnetization curve of pristine ZnO and Zn1−xCoxO nanorods at 300 K. (b) Zoomed magnetization plot and (c) variation of magnetization M with Co concentration. | ||
3.6. XPS analysis
Furthermore, to confirm the presence of elements and its chemical bonding states in synthesized Co doped ZnO nanorods (x = 0.15), XPS analysis has been carried out. Fig. 10(a) depicts the full range survey spectrum of Co doped ZnO nanorods (x = 0.15), which reveals the presence of characteristic peaks of Zn, O and Co in the synthesized Co doped ZnO nanorods. The selected data was corrected with C 1s carbon contamination peak (284.6 eV). Fig. 10(b) shows the high resolution spectra of the Zn 2p energy state. The core level binding energy of Zn 2p3/2 and Zn 2p1/2 was observed at 1021.9 eV and 1044.9 eV, respectively. The energy difference between these two peaks (∼23 eV) confirms that Zn exists primarily in the Zn2+ chemical state.46 Fig. 10(c) depicts three distinct characteristic peaks of the O 1s energy state observed at 528.3 eV, 530.1 eV and 531.8 eV, which are ascribed to the formation of three different O species in the synthesized nanorods. The lower binding energy implies that lattice oxygen in hexagonal wurtzite structure is surrounded by zinc and cobalt ions. The medium binding energy affirms the presence of oxygen vacancies in the ZnO matrix. The higher binding energy attributes the formation of adsorbed oxygen (O2−) on the surface of the ZnO nanorods.47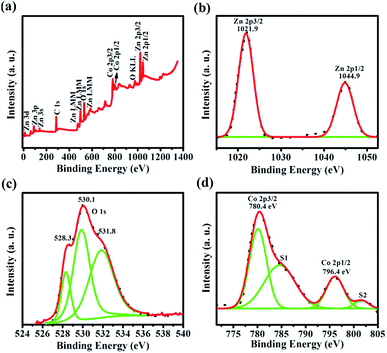 | ||
| Fig. 10 (a) XPS survey spectrum of Co doped ZnO nanorods (x = 0.15). (b–d) High resolution spectra of Zn, O and Co, respectively. | ||
Fig. 10(d) shows the Co 2p energy state high resolution spectra. The two characteristic peaks of Co 2p3/2 and Co 2p1/2, located at 780.4 eV and 796.4 eV, respectively, have been observed. In the high resolution spectra of Co 2p, the energy difference between Co 2p3/2 and Co 2p1/2 energy states is ∼16 eV, clearly showing that Co was successfully incorporated as a divalent ion. This is very well matched with previous literature reports.48–50 In addition to this, two shake-up satellite peaks (S1 and S2) were observed at 785 eV and 796.4 eV along with the main characteristic peaks of the Co 2p energy state. Thus, XPS analysis clearly reveals that Co2+ was successfully incorporated into the ZnO lattice by substituting Zn2+ without any additional impurities or phases.
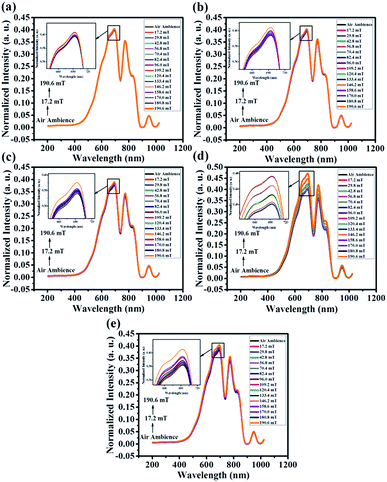
3.7. Magnetic field sensing analysis
 | (8) |
From the equation, εr is the dielectric constant and χ is the electric susceptibility. When an external magnetic field is applied perpendicularly to the direction of the propagated light, then
 | (9) |
So the refractive index of Co doped ZnO nanorods will increase with increasing in magnetic field strength. In the present work, a part of the cladding (nclad = 1.402) was replaced with the synthesized pristine and Co doped ZnO nanorods (nZnO = 1.91) which contributes to a certain amount of decreased attenuation in the guided signal depending on the absorbance of the cladding.
Hence, the change in refractive index and the absorbance of the cladding should affect the total internal reflection and evanescent field respectively. This is reflected in the change in intensity of the signal which is guided along the fiber.55 The proposed fiber optic sensor works in a leaky mode condition as the refractive index of the modified cladding (nZnO = 1.91) is higher than that of the core (ncore = 1.492).
 | (10) |
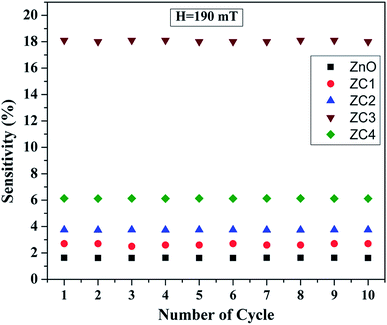
Fig. 13 shows the magnetic field sensitivity plot of pristine and Co doped ZnO nanorods in different magnetic field ranging from 17.2 mT to 190.6 mT at an ambient temperature of 28 °C. From Fig. 13, it can be seen that Co doped ZnO nanorods (x = 0.05, 0.1, 0.15 and 0.2) show enhanced sensitivity compared to pristine ZnO. Particularly, Co doped ZnO nanorods (x = 0.15) exhibit a maximum sensitivity of ∼18% compared with that of other Co doped ZnO nanorods (x = 0.05, 0.1 and 0.2). On the basis of the data plotted in Fig. 13, we can summarize that the sensor response increases fairly up to a Co doping of x = 0.15, then decreases for higher doping concentrations. It is seen that the materials with higher magnetization possess high sensitivity.
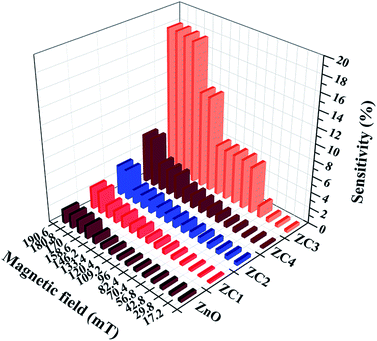 | ||
| Fig. 13 Magnetic sensitivity of the proposed sensor with magnetic field strength ranging from 17.2 mT to 190.6 mT. | ||
Further, beyond the magnetic field of 180.8 mT, the sensor showed a saturated response. Therefore, the operating range for the proposed magnetic sensor is in the range of 17.2 mT to 180.8 mT.
In order to study the effect of reproducibility, the sensor was characterized over ten cycles with a magnetic field strength of 190 mT and the experimental results are shown in Fig. 14. It is seen that the sensing response for all cycles are nearly identical with insubstantial sensitivity fluctuations. This clearly depicts that the sensor has good reproducibility.
4. Conclusions
A fiber optic magnetic field sensor using Co doped ZnO nanorods (5, 10, 15 and 20 at%) has been proposed and experimentally demonstrated. The analysis confirms that the nanorods are in hexagonal wurtzite structure. Furthermore, the VSM analysis indicates that the Co doped ZnO nanorods exhibit weak ferromagnetism at lower doping levels (ZC1 and ZC2) and paramagnetism at higher doping levels (ZC3 and ZC4). Experimental results show that the sensor has an operating magnetic field range from 17.2 mT to 180.8 mT and revealed the maximum sensitivity of ∼18% for Co doped ZnO nanorods (x = 0.15) which shows higher value of magnetization. The proposed magnetic field sensor will serve as a better platform for the development of fiber optic magnetic field sensors as better replacements for current Hall effect based sensors.Conflicts of interest
There are no conflicts to declare.Acknowledgements
The authors would like to acknowledge the Department of Science and Technology (DST), New Delhi, India for providing financial support through the FIST (Fund for Improvement of S&T Infrastructure in Higher Educational Institutions) project [SR/FST/ETI-015/2011].References
- A. Kołodziejczak-Radzimska and T. Jesionowski, Materials, 2014, 7, 2833 CrossRef PubMed.
- V. Avrutin, D. Silversmith and H. Morkoc, Proc. IEEE, 2010, 98, 1269 CrossRef.
- U. Ozgür, Y. I. Alivov, C. Liu, A. Teke, M. A. Reshchikov, S. Dogan, V. Avrutin, S. J. Cho and H. Morkoc, J. Appl. Phys., 2005, 98, 041301 CrossRef.
- D. S. Bohle and C. J. Spina, J. Phys. Chem. C, 2010, 114, 18139 Search PubMed.
- L. Yan, F. Zhao, S. Li, Z. Hu and Y. Zhao, Nanoscale, 2011, 3, 362 RSC.
- S. Fabbiyola, L. John Kennedy, U. Aruldoss, M. Bououdina, A. A. Dakhel and J. J. Vijaya, Powder Technol., 2015, 286, 757 CrossRef.
- G. Vijayaprasath, G. Ravi, A. S. Haja Hameed and T. Mahalingam, J. Phys. Chem. C, 2014, 118, 9715 Search PubMed.
- M. Shatnawi, A. M. Alsmadi, I. Bsoul, B. Salameh, G. A. Alna’washi, F. Al-Dweri and F. El Akkad, J. Alloys Compd., 2016, 655, 244 CrossRef.
- M. Jay Chithra, K. Pushpanathan and M. Loganathan, Mater. Manuf. Processes, 2014, 29, 771 CrossRef.
- P. K. Sharma, R. K. Dutta and A. C. Pandey, J. Colloid Interface Sci., 2010, 345, 149 CrossRef PubMed.
- X. Y. Xu and C. B. Cao, J. Alloys Compd., 2010, 501, 265 CrossRef.
- Y. C. Qiu, W. Chen, S. H. Yang, B. Zhang, X. X. Zhang, Y. C. Zhong and K. S. Wong, Cryst. Growth Des., 2010, 10, 177 Search PubMed.
- P. Geetha Devi and A. Sakthi Velu, J. Theor. Appl. Phys., 2016, 10, 233 CrossRef.
- T. T. Loan, N. N. Long and L. H. Ha, J. Phys. D: Appl. Phys., 2009, 42, 065412 CrossRef.
- J. El Ghoul, M. Kraini, O. M. Lemine and L. El Mir, J. Mater. Sci.: Mater. Electron., 2015, 26, 2614 CrossRef.
- Y. Jouane, S. Colis, G. Schmerber, P. Kern, A. Dinia, T. Heiser and Y. A. Chapuis, J. Mater. Chem., 2011, 21, 1953 RSC.
- B. Pal and P. K. Giri, J. Nanosci. Nanotechnol., 2011, 11, 1 CrossRef.
- K. Shingange, Z. P. Tshabalala, O. M. Ntwaeaborwa, D. E. Motaung and G. H. Mhlongo, J. Colloid Interface Sci., 2016, 479, 127 CrossRef PubMed.
- F. Pan, C. Song, X. J. Liu, Y. C. Yang and F. Zeng, Mater. Sci. Eng., R, 2008, 62, 1 CrossRef.
- X. Lei, J. Chen, F. Shi, D. Chen, Z. Ren and B. Peng, Opt. Commun., 2016, 374, 76 CrossRef.
- L. Luo, S. Pu, S. Dong and J. Tang, Sens. Actuators, A, 2015, 236, 67 CrossRef.
- C. Li, T. Ning, X. Wen, J. Li, C. Zhang and C. Zhang, Opt. Laser Technol., 2015, 72, 104 CrossRef.
- Z. Gu, Q. Ling, J. Lan and K. Gao, Opt. Laser Technol., 2017, 96, 249 CrossRef.
- L. Luo, S. Pu, S. Dong and J. Tang, Sens. Actuators, A, 2015, 236, 67 CrossRef.
- B. Yin, Y. Li, Z. Liu, S. Feng, Y. Bai, Y. Xu and S. Jian, Opt. Laser Technol., 2016, 80, 16 CrossRef.
- X. Li and H. Ding, Opt. Lett., 2012, 37, 5187 CrossRef PubMed.
- P. Zhang, M. Tang, F. Gao, B. Zhu, S. Fu, J. Ouyang, Z. Zhao, H. Wei, J. Li, P. P. Shum and D. Liu, J. Lightwave Technol., 2015, 33, 3332 CrossRef.
- M. Shatnawi, A. M. Alsmadi, I. Bsoul, B. Salameh, G. A. Alna’washi, F. Al-Dweri and F. El Akkad, J. Alloys Compd., 2016, 655, 244 CrossRef.
- P. Mahala, A. Kumar, S. Nayak, S. Behura, C. Dhanavantri and O. Jani, Superlattices Microstruct., 2016, 92, 366 CrossRef.
- Y. Kumar, A. Sahai, S. F. Olive-Méndez, N. Goswami and V. Agarwal, Ceram. Int., 2016, 42, 5184 CrossRef.
- P. Fageria, S. Gangopadhyay and S. Pande, RSC Adv., 2014, 4, 24962 RSC.
- S. Fabbiyola, L. John Kennedy, U. Aruldoss, M. Bououdina, A. A. Dakhel and J. JudithVijaya, Powder Technol., 2015, 286, 757 CrossRef.
- M. Jay Chithra, K. Pushpanathan and M. Loganathan, Mater. Manuf. Processes, 2014, 29, 771 CrossRef.
- G. Vijayaprasath, R. Murugan, T. Mahalingam and G. Ravi, J. Mater. Sci.: Mater. Electron., 2015, 26, 7205 CrossRef.
- A. A. Jacob, L. Balakrishnan, K. Shambavi and Z. C. Alex, RSC Adv., 2017, 7, 39657 RSC.
- P. K. Sharma, R. K. Dutta and A. C. Pandey, J. Colloid Interface Sci., 2010, 345, 149–153 CrossRef PubMed.
- T. Bulsgen, M. Hilgendorff, S. Irsen, F. Wilhelm, A. Rogalev, D. Goll and M. Giersig, J. Phys. Chem. C, 2008, 112, 2412–2417 Search PubMed.
- H. Hao, M. Qin and P. Li, Structural, optical, and magnetic properties of Co-doped ZnO nanorods fabricated by a facile solution route, J. Alloys Compd., 2012, 515, 143–148 CrossRef.
- M. Tortosa, M. Mollar, B. Marí and F. Lloret, Optical and magnetic properties of ZnCoO thin films synthesized by electrodeposition, J. Appl. Phys., 2008, 104, 033901 CrossRef.
- J. Iqbal, R. A. Janjua and T. Jan, Int. J. Mod. Phys. B, 2014, 28, 1450158 CrossRef.
- O. D. Jayakumar, J. Cryst. Growth, 2007, 300, 358 CrossRef.
- J. H. Yang, L. Y. Zhao, X. Ding, L. L. Yang, Y. J. Zhang, Y. X. Wang and H. L. Liu, Mater. Sci. Eng., B, 2009, 162, 143–146 CrossRef.
- D. Rubi, J. Fontcuberta, A. Calleja, L. Aragones, X. G. Capdevila and M. Segarra, Phys. Rev. B: Condens. Matter Mater. Phys., 2007, 75, 155322 CrossRef.
- S. Deka, R. Pasricha and P. A. Joy, Phys. Rev. B: Condens. Matter Mater. Phys., 2006, 74, 033201 CrossRef.
- A. Chanda, S. Gupta, M. Vasundhara, S. R. Joshi, G. R. Mutta and J. Singh, RSC Adv., 2017, 7, 50527 RSC.
- J. Hu, F. Gao, Z. Zhao, S. Sang, P. Li, W. Zhang, X. Zhou and Y. Chen, Appl. Surf. Sci., 2016, 363, 181 CrossRef.
- R. N. Ali, H. Naz, J. Li, X. Zhu, P. Liu and B. Xiang, J. Alloys Compd., 2018, 744, 90 CrossRef.
- R. N. Aljawf, F. Rahman and S. Kumar, Mater. Res. Bull., 2016, 83, 108 CrossRef.
- Y. Xu, R. Zhang, J. Qian, H. Wang, P. Wang and S. Ye, Mater. Des., 2018, 149, 81 CrossRef.
- H. Li, X. Liu and Z. Zheng, J. Magn. Magn. Mater., 2014, 372, 37 CrossRef.
- X. Xin, N. Zhong, Q. Liao, Y. Cen, R. Wu and Z. Wang, Biosens. Bioelectron., 2017, 91, 623 CrossRef PubMed.
- S. Y. Yang, Y. F. Chen, H. E. Horng, C.-Y. Hong, W. S. Tse and H. C. Yang, Appl. Phys. Lett., 2002, 81, 4931 CrossRef.
- H. E. Horng, C.-Y. Hong, S. Y. Yang and H. C. Yang, Appl. Phys. Lett., 2003, 15, 2434 CrossRef.
- C.-Y. Hong, S. Y. Yang, H. E. Horng and H. C. Yang, J. Appl. Phys., 2003, 94, 3849 CrossRef.
- N. Zhong, M. Zhao, L. Zhong, Q. Liao, X. Zhu, B. Luo and Y. Li, Biosens. Bioelectron., 2016, 85, 876 CrossRef PubMed.
- K. Bremer, T. Reinsch, G. Leen, B. Roth, S. Lochmann and E. Lewis, Sens. Actuators, A, 2017, 256, 84 CrossRef.
| This journal is © The Royal Society of Chemistry 2018 |

